Abstract
Lipid nanoparticles (LNPs), used for mRNA vaccines against severe acute respiratory syndrome coronavirus 2, protect mRNA and deliver it into cells, making them an essential delivery technology for RNA medicine. The LNPs manufacturing process consists of two steps, the upstream process of preparing LNPs and the downstream process of removing ethyl alcohol (EtOH) and exchanging buffers. Generally, a microfluidic device is used in the upstream process, and a dialysis membrane is used in the downstream process. However, there are many parameters in the upstream and downstream processes, and it is difficult to determine the effects of variations in the manufacturing parameters on the quality of the LNPs and establish a manufacturing process to obtain high-quality LNPs. This study focused on manufacturing mRNA-LNPs using a microfluidic device. Extreme gradient boosting (XGBoost), which is a machine learning technique, identified EtOH concentration (flow rate ratio), buffer pH, and total flow rate as the process parameters that significantly affected the particle size and encapsulation efficiency. Based on these results, we derived the manufacturing conditions for different particle sizes (approximately 80 and 200 nm) of LNPs using Bayesian optimization. In addition, the particle size of the LNPs significantly affected the protein expression level of mRNA in cells. The findings of this study are expected to provide useful information that will enable the rapid and efficient development of mRNA-LNPs manufacturing processes using microfluidic devices.
Introduction
The coronavirus disease (COVID-19) pandemic has facilitated the most rapid vaccine development in history; mRNA-based vaccines are highly effective against severe acute respiratory syndrome coronavirus-2 (SARS-CoV-2).1,2) Since the development and manufacturing of vaccines or therapeutics based on this modality is much faster than that of other modality platforms, many mRNA candidates have been developed for future pandemics, cancer vaccines, and disease therapeutics.3) Breakthroughs in the medical application of mRNA were brought about by the development of encapsulation techniques for delivery, and lipid nanoparticles (LNPs) have emerged as the leading technology for nucleic acid delivery.4–8) LNPs are typically composed of ionizable lipids, phospholipids, cholesterol, and lipid-anchored polyethylene glycol (PEG), with ionizable lipids being most important for protein expression by mRNA.6,9,10) It has been reported that LNPs size and charge directly affect cellular uptake, immunogenicity, and delivery site.11–13) The United States Food and Drug Administration (US FDA) has also positioned particle size and size distribution as “critical quality attributes (CQAs)” for liposomal drug products.14) Therefore, the precise control of the LNPs size is critical for developing robust manufacturing processes.
The production of LNPs consists of two steps: an upstream process to prepare LNPs, and a downstream process to remove ethyl alcohol (EtOH) and exchange buffers. Microfluidic devices are mainly used in the upstream process.15,16) The advantages of microfluidic devices are easy scale-up and high reproducibility, and they are used for industrial-scale preparations. LNPs are prepared by nanoprecipitation in a microfluidic device by mixing EtOH, in which the lipid components are dissolved, and a weakly acidic buffer, such as citric acid or acetic acid, in which the mRNA is dissolved. Various parameters, such as pH, EtOH content, and flow rate, must be evaluated to optimize the manufacturing conditions for microfluidic devices. Recently, it was reported that LNPs preparation conditions could be efficiently optimized by systematically evaluating these parameters using a design of experiment (DoE) approach.12,17–19)
The downstream process mainly involves EtOH removal and buffer exchange via dialysis. It has been reported that the LNPs fuse, and the particle size increases in this process, and minimizing this phenomenon is necessary for particle size control.20) Nag et al. showed that particle size is stabilized by performing two-stage dialysis.21)
Our novel ionizable lipid L202-based liquid dosage form was previously developed through in vitro and in vivo experiments. L202-based mRNA-LNPs exhibited protective immunity against SARS-CoV-2 infection22) and therapeutic efficacy against ornithine-transcarbamylase (OTC) deficiency with a sufficient safety profile.23)
Recent advances have also led to an increase in the development of predictive algorithms using machine learning in the pharmaceutical industry.24,25) We demonstrated that Bayesian optimization reduces unnecessary experimentation in optimizing drug formulations and process parameters.26) However, there are few reports on employing machine learning for formulating mRNA-LNPs and the optimizing their manufacturing conditions.27,28)
To manufacture mRNA-LNPs containing L202 using a manufacturing process that employs microfluidic devices in the upstream process and dialysis in the downstream process, we used two machine learning techniques (eXtreme Gradient Boosting [XGBoost] and Bayesian optimization) to determine the importance of each manufacturing parameter for LNPs quality and optimize the manufacturing conditions for LNPs with a specific particle size. To our knowledge, this is the first study on the selection of critical process parameters using XGBoost and the optimization of manufacturing conditions using Bayesian optimization. Therefore, the results obtained in this study may provide useful information for the rapid and efficient development of mRNA-LNPs manufacturing processes using microfluidic devices.
Experimental
Preparation of mRNAThe mRNAs encoding firefly luciferase (FLuc) were synthesized by in vitro transcription (IVT) using a DNA template. Codon optimization was performed for the open reading frame of FLuc. In the designed mRNA, uridine was completely replaced by N1-methylpseudouridine, with the Cap 1 structure (#N-7113, TriLink BioTechnologies, San Diego, CA, U.S.A.), the 5′ and 3′ untranslated regions (UTRs), and a poly(A) tail of approximately 120 nucleotides. The mRNA was digested with ribonuclease (RNase) III and purified using oligo-dT affinity chromatography. The mRNA was cryopreserved at −70 °C before use. The sequence length of the mRNAs encoding FLuc used in this report was 1920 nucleotides.
Preparation of mRNA-LNPsLNPs were prepared by mixing an EtOH phase containing lipids with mRNA in the aqueous phase using a microfluidic device according to the manufacturing scheme shown in Fig. 1. mRNA was dissolved in 50 mM sodium citrate buffer at pH 3.5, while the ionizable lipid L202, 1,2-distearoyl-sn-glycero-3-phosphocholine (DSPC) (Nippon Fine Chemical Co., Ltd., Osaka, Japan), cholesterol (Nippon Fine Chemical Co., Ltd.), and mPEG2000-DMG (SUNBRIGHT GM-020, NOF CORPORATION, Tokyo, Japan) in 50 : 10 : 38.5 : 1.5 M ratio, were dissolved in EtOH. The mRNA/total lipid ratio was 0.05 (wt/wt). The mRNA and lipid solutions were mixed at volumetric flow ratios between 1 : 1 and 3 : 1 (aqueous: ethanol) and total flow rates (TFR) between 1 and 4 mL/min, using a NanoAssemblr (Precision Nanosystems, Vancouver, BC, Canada). The preparation volume of the mRNA-LNP solutions was 1.5 mL. After formulation, the LNPs were diluted 10-fold with 50 mM sodium citrate buffer (pH 3.5). Using 100-kDa dialysis tubes (Spectrum Laboratories Inc., Rancho Dominguez, CA, U.S.A., membrane type: Biotech Cellulose Ester), the LNPs were first dialyzed against 200 times of the prepared LNP formulation volume of phosphate buffered saline (PBS; 10 mM phosphate buffer containing 137 mM NaCl, pH 7.5) for 6 h at 2–8 °C and then against 200 times of the prepared LNP formulation volume of 8% sucrose/20 mM Tris buffer (pH 7.5) overnight at 2–8 °C. As PBS dialysis was conducted to prepare siRNA-LNP in our previous report, solutions were dialyzed against PBS.29) mRNA-LNPs are more unstable than siRNA-LNPs and require freezing for long-term storage. Therefore, buffer exchange was conducted with 8% sucrose/20 mM Tris buffer after PBS dialysis to freeze mRNA-LNPs.
The LNPs were concentrated by ultrafiltration using an Amicon Ultra (molecular weight cut-off [MWCO] 100 kDa; Merck Millipore, Burlington, MA, U.S.A.) as needed to obtain the final concentration and cryopreserved at −70 °C until use. The maximum storage period at −7 °C was 3 months.
Characterization of LNPsParticle size and polydispersity index (PdI) were determined using dynamic light scattering with a Zetasizer Nano ZS (Malvern Panalytical, Malvern, Worcestershire, U.K.). As previously described, free and total mRNA concentrations in LNPs were determined using the Quant-iT Ribogreen RNA assay kit (Invitrogen #R11491, Thermo Fisher Scientific, Waltham, MA, U.S.A.) and SpectraMAX M2 fluorescence microplate reader (Molecular Devices, San Jose, CA, U.S.A.).29) Encapsulation efficiency (EE, %) was calculated as follows:
Cryo-Electron Microscopy (Cryo-EM) Analysis of LNPsA droplet of 3 µL of mRNA-LNPs solution was applied to a glowdischarged holey carbon grid (Cu R1.2/1.3, 300 mesh, #M2955C-1-300, Quantifoil Micro Tools, Jena, Germany). The grid was blotted for 5 s with a blot force of 15 and flash-frozen in liquid ethane using a Vitrobot Mark IV (Thermo Fisher Scientific) at 18 °C and 100% humidity. Data were collected using a Talos Arctica electron microscope (Thermo Fisher Scientific) with a Falcon 4 direct electron detector at 200 kV. Images were acquired at a defocus of −1 µm with a nominal magnification of ×73000 at a pixel size of 1.35 Å.
Nanoparticle Tracking Analysis (NTA)A Malvern NanoSight NS300 (Malvern Panalytical, Malvern, WR, U.K.) was used for NTA. The mRNA-LNPs were diluted 250 to 1000 fold in 1 × PBS pH 7.2 to a final concentration of 50–200 particles per frame. Sixty-second videos were analyzed to obtain the population histograms. The particle count of the merged data was determined using NanoSight software.
Understanding the Upstream Process and Optimization Using Machine LearningXGBoost is an optimized distributed gradient boosting library designed to be highly efficient, flexible, and portable.30) Recently, Wu et al. predicted the absorption, distribution, metabolism, excretion, and toxicity of candidate compounds using XGBoost.31) Chang et al. showed that XGBoost extracted features to predict the fasting state of patients from blood tests.32) Maharjan et al. used six machine learning algorithms, including XGBoost, to predict particle size, PdI, zeta potential, and EE when the manufacturing process parameters of mRNA-LNPs were varied.28) The purpose of their use of machine learning algorithms was to establish a highly accurate predictive model for the quality characteristics of mRNA-LNPs. On the other hand, the purpose of our use of XGBoost is to extract manufacturing process parameters that are highly important for determining the quality characteristics of mRNA-LNPs from a small amount of experimental data.
Bayesian optimization is a method of optimizing the next experimental parameters from past experimental results by obtaining probability distributions. Bayesian optimization can reduce the overall number of experiments and achieve conditional optimization quickly.33) Bayesian optimization is performed in three steps. First, a Gaussian process regression is performed using the experimental data at hand to compute the mean and variance of the predictions under the unexecuted conditions. Next, the expected value in each condition is calculated using an acquisition function with predicted mean and variance as inputs. Conditions in which the expected value output by the acquisition function is greater are those in which better results are more likely to be obtained. Finally, the experiment is performed under the conditions presented to obtain new data. These steps are repeated until results that meet the criteria are obtained. There are several types of acquisition functions for calculating expected values, including Expected Improvement (EI), Probability of Improvement (PoI), and Upper Confidence Bound (UCB). PoI tends to be mostly an exploitation that suggests next conditions around the point where current best value was obtained. Compared to PoI, EI and UCB are acquisition functions that are devised to balance the exploitation aspect with the aspect of exploration for better conditions, although with more uncertainty. Bayesian optimization has also been applied to formulation optimization of biopharmaceutical formulations.34) Bellamy et al. showed that batched Bayesian optimization is effective for identifying compounds with suitable bioactivities in the early stages of the drug design process.35)
We used XGBoost to objectively select the process parameters for the microfluidic devices and derived the manufacturing conditions for the target particle size using Bayesian optimization.
Selection of Critical Process Parameters Using XGBoostThe XGBoost models for LNPs size, PdI, and EE were constructed separately using six input parameters (total flow rate, EtOH concentration, mRNA concentration, lipid concentration, buffer pH, and buffer concentration). Sixteen data points were used to construct the XGBoost models (Supplementary Table S1). Two hyper parameters, i.e., the learning rate and number of rounds, were optimized for each model within the ranges of 0.05 to 0.3 for the learning rate and 5 to 30 for the number of rounds. The importance of each input parameter was calculated for each objective, and the input parameters with higher importance values were selected as the critical process parameters. Model construction was conducted using R with “xgboost” package.36,37)
Determination of Process Conditions Using Bayesian OptimizationBecause Bayesian optimization allowed only one optimal indicator to be set, the optimization indicator consisting of LNPs size (z) and EE was determined from the following equation:
The newly designed optimization indicator took on larger values as the LNPs size approached the target value (target z: 80 or 200 nm), and the encapsulation efficiencies were above the set criterion (80%).
The parameters to be optimized by Bayesian optimization were the EtOH concentration, buffer pH, and total flow rate, with the range of variation for each scaled from 0 to 1 as input values. Ten data points, excluding the lipid and buffer concentration data from the 16 data points used in the XGBoost models, were used for the Bayesian optimization (Supplementary Table S2). The square exponential function was used as the kernel function, and the PoI and UCB were used as the acquisition functions. Calculations relating to the Bayesian optimization process were conducted using R with “rBayesianOptimization” package.36,38)
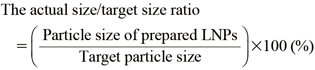
The actual size/target size ratio was calculated as the accuracy of Bayesian optimization as follows:
In Vitro Expression of mRNA Encoding Firefly LuciferaseThe cells were cultured under standard conditions (37 °C, 5% CO2). Human hepatoma cell line Hep3B (American Type Culture Collection [ATCC], HB-8064) and Huh7 (Japanese Collection of Research Bioresources [JCRB], JCRB0403) were grown in Eagle’s Minimum Essential Medium (EMEM) and Dulbecco’s Modified Eagle Medium (D-MEM) (low-glucose), respectively, both containing 10% fetal bovine serum and penicillin/streptomycin. Confluent cells were detached with trypsin–ethylenediaminetetraacetic acid (EDTA) and washed with the medium. The counted cells were seeded in a 96-well plate at 1.0 × 10⁴ cells/well and used for the in vitro LNPs assay after approximately 24 h. The LNPs were diluted with each medium to 500 ng/mL mRNA and 100 ng/mL mRNA, respectively. The culture medium was removed from seeded wells, and 100 mL of each LNPs dilution was added. The culture medium was removed after 24 h of incubation. The Steady Glo® (Cat#E2520; Promega™, Madison, WI, U.S.A.) and CellTiter Glo®2.0 (Cat# G9242; Promega) reaction solutions were adjusted with Dulbecco’s phosphate-buffered saline (D-PBS)(−) and added to the wells containing the treated cells. The plates were protected from light and gently shaken at room temperature for 30 min. After incubation, the luminescence of the reaction wells was measured using a NIVO plate reader (PerkinElmer, Inc., Waltham, MA, U.S.A.). Luciferase expression in the cells, detected as Steady Glo® signals, was normalized to CellTiter Glo® signals.
Results and Discussion
Optimization of the Downstream ProcessThe purpose of the downstream process is to remove EtOH used in the upstream process and exchange buffers. EtOH destabilizes lipid membranes and affects the particle size and EE; therefore, efficient removal of EtOH is essential.20,39) Because the EtOH concentration in the upstream process is frequently changed during the optimization stage of the LNP formulation, a robust downstream process that can reliably remove EtOH is required to obtain high-quality LNPs. Therefore, before understanding and optimizing the upstream process, we confirmed the influence of different downstream process conditions on the quality of the LNPs.
The LNP suspensions were prepared under two different experimental conditions of volumetric percentages of 25 and 45% EtOH in the upstream process, and the quality of LNPs obtained under three different conditions (Methods A, B, and C) of the downstream process was compared (Fig. 2A). The following conditions were used in Method A: the LNP suspension was first dialyzed against PBS (pH 7.5) for 6 h at 2–8 °C and then against 8% sucrose/20 mM Tris buffer (pH 7.5) overnight at 2–8 °C. The following conditions were used in Method B: the LNP suspension was diluted 10-fold with PBS (pH 7.5) and first dialyzed against PBS (pH 7.5) for 6 h at 2–8 °C and then against 8% sucrose/20 mM Tris buffer (pH 7.5) overnight at 2–8 °C. The following conditions were used in Method C: the LNP suspension was diluted 10-fold with 50 mM sodium citrate buffer (pH 3.5) and first dialyzed against PBS (pH 7.5) for 6 h at 2–8 °C and then against 8% sucrose/20 mM Tris buffer (pH 7.5) overnight at 2–8 °C.
At 25% EtOH, the Z-average, PdI, and EE of the LNPs obtained using Method A, B, and C were similar (Figs. 2B, C). Because the EtOH concentration was low, the lipid membranes of the LNPs were considered relatively stable.13,20,39) As a result, it appeared that the difference in the downstream process conditions did not affect the properties of the LNPs at 25% EtOH.
In contrast, at 45% EtOH, Methods A and B showed large Z-average, high PdI, and insufficient EE (Figs. 2D, E). In Method A, the LNPs were exposed to higher EtOH concentration than those in Methods B and C because buffer dilution was not conducted. Therefore, it was considered that the fusion of LNPs and destruction of the particle structure occurred because of the formation of an unstable lipid membrane at a high EtOH concentration.20)
In Method B, the pH was rapidly changed from 3.5 to 7.5 using dilution with PBS. It has been reported that LNPs fuse due to the increase in pH during the dialysis process; this phenomenon results in increased particle size of the LNPs.40) Therefore, it was considered that the reason for the increase in particle size and PdI and the decrease in EE was that the rapid increase in pH abruptly accelerated lipid membrane fusion, destabilizing the LNPs.
In contrast, in Method C, the EtOH concentration was decreased using dilution with a citrate buffer; the buffer was exchanged with PBS at the dialysis step, resulting in a mild change in pH. As a result, destabilization of the lipid membrane was minimized, which maintained the high EE. These findings suggest that rapid removal of EtOH under moderate pH changes is required for downstream processes.
Understanding and Optimizing the Upstream ProcessWe followed the flowchart in Fig. 3 to understand and optimize the upstream process. First, a fundamental dataset was obtained by varying the process parameters using a one-factor-at-a-time approach. Next, we objectively evaluated the impact of the process parameters of the microfluidic device on the quality of the LNPs from the fundamental dataset using XGBoost, which is a machine learning technique. The process parameters that greatly impacted particle size, PdI, and EE were identified. Subsequently, to obtain LNPs with the target particle size, the conditions of the identified process parameters were derived using Bayesian optimization. Finally, LNPs were manufactured under the process conditions derived from Bayesian optimization, and the quality of the LNPs was confirmed as expected.
The effects of buffer pH, buffer concentration, EtOH concentration, and total flow rate on the particle size and EE based on the dataset obtained in STEP 1 are shown in Fig. 4. The particle size increased with lower total flow rate and higher buffer concentration and buffer pH (Figs. 4A, C, D). It has been reported that slowing the total flow rate reduces the mixing efficiency of EtOH and the buffer, resulting in a larger particle size.13,41) Lou et al. reported that increasing the buffer concentration increases the particle size.42) Additionally, Okuda et al. reported that the particle size increases with increasing pH.17) Therefore, our results are similar to those of previous reports.
The particle size increased sharply when EtOH concentrations ranged from 35 to 45%, but the EE decreased dramatically at 50% EtOH (Fig. 4B). The PdI was also higher with 50% EtOH (Supplementary Fig. S1). It is thought that high EtOH concentration renders the lipid membrane unstable, causing the fusion of LNPs and the destruction of the particle structure.13) The effect of the concentration of lipids and mRNA on the particle size and EE seemed to be small (Supplementary Table S1).
XGBoost was used to objectively evaluate the influence of each parameter on the quality characteristics of LNPs. Regression models for particle size, PdI, and EE as objective variables were separately constructed using six input parameters (total flow rate, EtOH concentration, mRNA concentration, lipid concentration, buffer pH, and buffer concentration). Sixteen data points obtained in STEP 1 were used to construct the XGBoost models (Supplementary Table S1). The correlation coefficients between the predicted values derived from the 16 data points were 0.977 for EE, 0.998 for particle size, and 0.990 for PdI, indicating that the constructed regression model had sufficient accuracy. By evaluating the importance of each parameter, the EtOH concentration, buffer pH, total flow rate, and buffer concentration were found to be important for EE, particle size, and PdI (Figs. 5A–C). Previous reports on the particle size control of LNPs showed that particle size was affected by variations in these process parameters.13,15–19) In addition, EE was highly influenced by EtOH concentration, and particle size and PdI were highly influenced by EtOH concentration and buffer pH, showing the same trend as the results shown in Fig. 4 and Supplementary Fig. S1.
EtOH concentration and buffer pH were found to be more important than total flow rate and buffer concentration. High EtOH concentration promotes the fusion of LNPs.20) Buffer pH changes the charge of ionizable lipids and affects the interaction between mRNA and ionizable lipids. These two parameters directly influence the formation of LNPs. We confirmed the effects of EtOH concentration, buffer pH, and buffer concentration at the slowest total flow rate of 1.0 mL/min that we investigated. Therefore, the dilution rate of EtOH was slowed down, and the lipid membrane of LNPs seemed to be easily fused. This illustrated that the EtOH concentration and pH, which directly affected the particle properties, were more critical to the process than total flow rate and buffer solution concentration.
The above results and considerations suggest that the importance of each parameter obtained using XGBoost was appropriate.
The particle size of LNPs is an important parameter that influences their biodistribution. A particle size of approximately 80–120 nm is optimal for delivering LNPs to hepatocytes, whereas a particle size of approximately 200 nm or greater is suitable for delivering LNPs to liver sinusoidal endothelial cells and dendritic cells.17,43,44) Therefore, to develop a size-selective manufacturing method, the process parameters for obtaining LNPs with particle sizes of approximately 80 and 200 nm and EE of 80% or more were derived using 10 data points and Bayesian optimization (Supplementary Table S2). Process parameter evaluation using XGBoost revealed the importance of EtOH concentration, buffer pH, total flow rate, and buffer concentration on the EE and particle size. Although the importance of the total flow rate and buffer concentration is approximately the same, previous reports have shown that the total flow rate strongly affects the particle size.13,19,41,45,46) Considering our results and those of previous reports, the conditions of the three process parameters (EtOH concentration, buffer pH, and total flow rate) were derived using Bayesian optimization. The Z-average, PdI, and EE of the LNPs obtained under the process conditions derived from the representative acquisition functions UCB and PoI are listed in Tables 1 and 2. UCB is an acquisition function that considers the mean and upper bounds of the confidence interval. PoI is an exploitative acquisition function that selects data points that exceed the known maximum from the expected value. The parameter conditions obtained from these two acquisition functions were almost identical at 80 and 200 nm. The Z-average of the LNPs prepared using the obtained parameter conditions was close to the target particle size, and all LNPs showed high EE. The Z-average, PdI, and EE of LNPs prepared in triplicate under each condition are also shown in Supplementary Figs. S2 and S3. The variation in Z-average and EE of LNPs produced under each condition was small, and PdI was sufficiently small. Furthermore, the actual size/target size ratio fell within the range of 90 to 110% under all conditions (Fig. 6). Therefore, the Bayesian optimization model that we had established seemed to have sufficient prediction accuracy.
Table 1. Manufacturing Conditions for LNPs with Particle Sizes of Approximately 80 nm and Encapsulation Efficiency of 80% or More Derived Using Bayesian Optimization, and the Z-Average and Encapsulation Efficiency of LNPs Prepared According to the Derived Conditions
| Conditions calculated using Bayesian optimization | Z-Average (nm)c) | PdIc) | mRNA encapsulation efficiency (%)c) |
|---|
| Acquisition function | pH | Total flow rate (mL/min) | Flow rate ratio |
|---|
| UCBa) | 4.0 | 4.0 | 25 | 83 ± 2 | 0.121 ± 0.021 | 96 ± 2 |
| PoIb) | 3.5 | 4.0 | 25 | 77 ± 5 | 0.081 ± 0.039 | 96 ± 2 |
a) UCB: upper confidence bound; b) PoI: Probability of improvement; c) Values are expressed as means ± standard deviation (S.D.) (n = 3).
Table 2. Manufacturing Conditions for LNPs with Particle Sizes of Approximately 200 nm and Encapsulation Efficiency of 80% or More Derived Using Bayesian Optimization, and the Z-Average and Encapsulation Efficiency of LNPs Prepared According to the Derived Conditions
| Conditions calculated using Bayesian optimization | Z-Average (nm)c) | PdIc) | mRNA encapsulation efficiency (%)c) |
|---|
| Acquisition function | pH | Total flow rate (mL/min) | Flow rate ratio |
|---|
| UCBa) | 3.5 | 2.5 | 44 | 200 ± 9 | 0.058 ± 0.032 | 97 ± 2 |
| PoIb) | 3.5 | 2.5 | 45 | 186 ± 4 | 0.072 ± 0.004 | 97 ± 2 |
a) UCB: upper confidence bound; b) PoI: Probability of improvement; c) Values are expressed as means ± S.D. (n = 3).
The reason for the accuracy of these results was the high validity of the important process parameters that affect the particle size and EE selected using XGBoost and the use of data in which the target variables, particle size, and EE varied greatly as the initial dataset for Bayesian optimization (Supplementary Table S2). Kondo et al. set a broader initial dataset in a parallel screening of multiple parameters for the flow synthesis of biaryl compounds by Bayesian optimization.47) Sano et al. also found that the quality of the initial dataset affected the identification of the optimal solution and showed that a highly diverse dataset could identify the optimal solution more efficiently.26) Considering our Bayesian optimization results and previously reported findings, obtaining initial dataset in which the target variable varies sufficiently is essential to achieve more efficient Bayesian optimization.
In the early stages of formulation development, it is necessary to manufacture various formulations with different qualities to clearly understand how the quality of the formulation affects their efficacy and safety. However, in this development stage, there are limitations in terms of available drug substances and costs for formulation manufacturing. In such a limited environment, there is a need for a method that can identify important manufacturing process parameters with minimal experimental data and find the optimal manufacturing conditions for formulations with different qualities.
DoE is a representative method for optimizing the manufacturing conditions of formulations and is applied to optimize the conditions for the more stable and reliable production of formulations with specific qualities.48,49) However, sufficient regression accuracy may not be obtained when data planned by DoE cannot be obtained. In such cases, additional experiments will be conducted, resulting in consumption of drug substance and raw materials.
In this study, we demonstrated the establishment of a size-selective mRNA-LNPs manufacturing method based on very limited data by combining two types of machine learning, XGBoost for finding critical process parameters and Bayesian optimization for tuning process parameters. Therefore, the optimization of formulation manufacturing conditions using machine learning seems to be useful in the early stages of formulation development, which have various limitations.
Considering these results comprehensively, we believe that selecting the most suitable manufacturing optimization method for the purpose and situation of each formulation development stage is important for the efficient and rapid development of high quality formulations.
Physicochemical Characterization and in Vitro Cell Uptake of Different Particle Size LNPsThe particle properties of four LNP formulations with the same lipid composition but different particle sizes were determined. The size categories were small, medium, large, and extra-large. The average of Z-average, PdI, and EE are shown in Fig. 7A. The data for each LNP formulation are shown in Supplementary Table S3. The standard deviations of Z-average, PdI, and EE for each size category were sufficiently small. Therefore, it seems that the reproducibility of the triplicate preparations was suitable. The data of the Z-average of four size categories were analyzed using one-way ANOVA, followed by Tukey’s multiple comparisons test (Fig. 7B). The results of the analyses showed that there were statistically significant differences in the Z-average of each particle size categories.
Next, the particle size distribution, morphology, and protein expression of one lot in each of the size categories were measured to confirm the effect of the particle size (small: 77 nm, medium: 105 nm, large: 144 nm, extra-large: 214 nm). We evaluated the particle size distribution using NTA, which is commonly used for nanoparticle size distribution measurement.50) The particle size distribution became broader as the particle size of LNPs increased (Fig. 7C). Hassett et al. also revealed a broadening of the size distribution as the particle size increased using NTA.13) Based on these results, it seems that increasing particle size reduces particle homogeneity, which broadens the particle size distribution.
The morphology of the LNPs preparations was observed using Cryo-EM (Fig. 7D). Cryo-EM provides information on the shape and internal morphology of LNPs and promotes an understanding of molecular arrangement and phase separation.51) Cryo-EM indicated bleb structures were formed no matter what size particles were generated. We used DSPC as a helper-lipid and prepared mRNA-LNPs using a sodium citrate buffer in the upstream process of LNPs manufacturing. Leung et al. revealed that blebs are formed in mRNA-LNPs using DSPC as a helper lipid.52) In addition, Cheng et al. recently reported that the citrate buffer is a fusogenic buffer and promotes the formation of bleb structures.53) Our results were consistent with those reported by them.
Finally, we tested the protein expression levels in Hep3B and Huh7 cells treated using the four LNP formulations. These human cell lines are derived from liver tissue, where intravenously administrated LNPs are mainly delivered, as previously reported.54,55) The data of the protein expression levels in cells treated with the four LNP formulations were analyzed using one-way ANOVA followed by Tukey’s multiple comparisons test. The results showed that there were statistically significant differences in the protein expression levels in both cell types for each particle size LNPs with 100 ng/mL mRNA (Figs. 7E, F). The protein expression level of cells treated with medium-sized (105 nm) LNPs was the highest, and that of those treated with extra-large-sized (214 nm) LNPs was the lowest. Similar trends were observed at a higher concentration of 500 ng/mL mRNA (Supplementary Fig. S4).
Previous reports have shown that the rate-limiting step in protein expression by mRNA is the endosomal escape and that LNPs with an optimal particle size exhibit high protein expression.56) Tong et al. reported a correlation between the particle size of respiratory syncytial virus mRNA-LNP vaccine and in vitro cell potency; it was found that cell potency decreases as the LNP size increases.57) Hasset et al. reported that in mice, the humoral immune response was dependent on LNP size after intramuscular injection with the cytomegalovirus mRNA-LNP vaccine, but this was not the case in non-human primates (NHPs).13) Taking these previous reports and our results into consideration, we believe that the establishment of an appropriate method for evaluating the impact of mRNA-LNP particle size on drug effects and the associated in vivo–in vitro correlation is important for the development of mRNA-LNP medicines.
Conclusion
In this study, machine learning was used to understand and optimize the manufacturing of mRNA-LNPs using a microfluidic device. We showed that the objective selection of important process parameters for a microfluidic device using XGBoost and the derivation of manufacturing conditions for LNPs with the required particle size using Bayesian optimization are useful for developing mRNA-LNPs manufacturing processes. Dialysis, a downstream process in LNPs production, significantly affects the particle size and EE, which are CQAs of LNPs; this study demonstrated the importance of optimizing the dialysis process. The uniformity of the particles decreased with increasing particle size. Considering that the particle size of LNPs significantly affects protein expression, we believe that manufacturing LNPs of an appropriate size with a highly uniform particle size distribution is a challenge for LNP-based medicine development. The findings of this study provide useful information that will enable the rapid and efficient development of mRNA-LNPs manufacturing processes using microfluidic devices.
Acknowledgments
We are grateful to the members of the cryo-EM facility at KEK (Ibaraki, Japan) for the cryo-EM data collection.
Funding
This work was supported by the Platform Project for Supporting Drug Discovery and Life Science Research (Basis for Supporting Innovative Drug Discovery and Life Science Research (BINDS)) from Japan Agency for Medical Research and Development (AMED) under Grant Number JP22ama121001.
Conflict of Interest
The authors declare no conflict of interest.
Supplementary Materials
This article contains supplementary materials.
References
- 1) El Sahly H. M., Baden L. R., Essink B., et al., N. Engl. J. Med., 385, 1774–1785 (2021).
- 2) Thomas S. J., Moreira E. D. Jr., Kitchin N., et al., N. Engl. J. Med., 385, 1761–1773 (2021).
- 3) Fang E., Liu X., Li M., Zhang Z., Song L., Zhu B., Wu X., Liu J., Zhao D., Li Y., Signal Transduct. Target. Ther., 7, 94 (2022).
- 4) Cullis P. R., Hope M. J., Mol. Ther., 25, 1467–1475 (2017).
- 5) Hou X., Zaks T., Langer R., Dong Y., Nat. Rev. Mater., 6, 1078–1094 (2021).
- 6) Tenchov R., Bird R., Curtze A. E., Zhou Q., ACS Nano, 15, 16982–17015 (2021).
- 7) Suzuki Y., Ishihara H., Drug Metab. Pharmacokinet., 41, 100424 (2021).
- 8) Sato Y., Chem. Pharm. Bull., 69, 1141–1159 (2021).
- 9) Hassett K. J., Benenato K. E., Jacquinet E., Lee A., Woods A., Yuzhakov O., Himansu S., Deterling J., Geilich B. M., Ketova T., Mihai C., Lynn A., Mcfadyen I., Moore M. J., Senn J. J., Stanton M. G., Almarsson Ö., Ciaramella G., Brito L. A., Mol. Ther. Nucleic Acids, 15, 1–11 (2019).
- 10) Kauffman K. J., Dorkin J. R., Yang J. H., Heartlein M. W., Derosa F., Mir F. F., Fenton O. S., Anderson D. G., Nano Lett., 15, 7300–7306 (2015).
- 11) Nakamura T., Kawai M., Sato Y., Maeki M., Tokeshi M., Harashima H., Mol. Pharm., 17, 944–953 (2020).
- 12) Cui L., Hunter M. R., Sonzini S., Pereira S., Romanelli S. M., Liu K., Li W., Liang L., Yang B., Mahmoudi N., Desai A. S., Small, 18, 2105832 (2022).
- 13) Hassett K. J., Higgins J., Woods A., Levy B., Xia Y., Hsiao C. J., Acosta E., Almarsson Ö., Moore M. J., Brito L. A., J. Control. Release, 335, 237–246 (2021).
- 14) “FDA—Liposome Drug Products; Chemistry, Manufacturing, and Controls; Human Pharmacokinetics and Bioavailability; Labeling Documentation. Guidance for Industry; April 2018 Pharmaceutical Quality/CMC.” U.S. Department of Health and Human Services Food and Drug Administration Center for Drug Evaluation and Research (CDER), 2018.
- 15) Shepherd S. J., Issadore D., Mitchell M. J., Biomaterials, 274, 120826 (2021).
- 16) Maeki M., Uno S., Niwa A., Okada Y., Tokeshi M., J. Control. Release, 344, 80–96 (2022).
- 17) Okuda K., Sato Y., Iwakawa K., Sasaki K., Okabe N., Maeki M., Tokeshi M., Harashima H., J. Control. Release, 348, 648–659 (2022).
- 18) Ly H. H., Daniel S., Soriano S. K. V., Kis Z., Blakney A. K., Mol. Pharm., 19, 1892–1905 (2022).
- 19) Terada T., Kulkarni J. A., Huynh A., Chen S., Van Der Meel R., Tam Y. Y. C., Cullis P. R., Langmuir, 37, 1120–1128 (2021).
- 20) Kimura N., Maeki M., Sato Y., Ishida A., Tani H., Harashima H., Tokeshi M., ACS Appl. Mater. Interfaces, 12, 34011–34020 (2020).
- 21) Nag K., Sarker M. E. H., Kumar S., Khan H., Chakraborty S., Islam M. J., Baray J. C., Khan M. R., Mahmud A., Barman U., Bhuiya E. H., Mohiuddin M., Sultana N., Sci. Rep., 12, 9394 (2022).
- 22) Suzuki Y., Miyazaki T., Muto H., Kubara K., Mukai Y., Watari R., Sato S., Kondo K., Tsukumo S., Yasutomo K., Ito M., Tsukahara K., Mol. Ther. Nucleic Acids, 30, 226–240 (2022).
- 23) Yamazaki K., Kubara K., Ishii S., Kondo K., Suzuki Y., Miyazaki T., Mitsuhashi K., Ito M., Tsukahara K., Mol. Ther. Nucleic Acids, 33, 210–226 (2023).
- 24) Vamathevan J., Clark D., Czodrowski P., Dunham I., Ferran E., Lee G., Li B., Madabhushi A., Shah P., Spitzer M., Zhao S., Nat. Rev. Drug Discov., 18, 463–477 (2019).
- 25) Patel L., Shukla T., Huang X., Ussery D. W., Wang S., Molecules, 25, 5277 (2020).
- 26) Sano S., Kadowaki T., Tsuda K., Kimura S., J. Pharm. Innov., 15, 333–343 (2020).
- 27) Wang W., Feng S., Ye Z., Gao H., Lin J., Ouyang D., Acta Pharm. Sin. B, 12, 2950–2962 (2022).
- 28) Maharjan R., Hada S., Lee J. E., Han H. K., Kim K. H., Seo H. J., Foged C., Jeong S. H., Int. J. Pharm., 640, 123012 (2023).
- 29) Suzuki Y., Hyodo K., Tanaka Y., Ishihara H., J. Control. Release, 220 (Pt A), 44–50 (2015).
- 30) Chen T., Guestrin C., “XGBoost: A Scalable Tree Boosting System.” Proceedings of the 22nd ACM SIGKDD International Conference on Knowledge Discovery and Data Mining, San Francisco, California, U.S.A., 2016.
- 31) Wu J., Kong L., Yi M., Chen Q., Cheng Z., Zuo H., Yang Y., Comput. Intell. Neurosci., 2022, 4987639 (2022).
- 32) Chang S. N., Hsiao Y. L., Lin C. C., Sun C. H., Chen P. S., Wu M. Y., Chen S. H., Chiang H. Y., Hsiao C. T., King E. K., Chang C. M., Kuo C. C., Sci. Rep., 12, 11929 (2022).
- 33) Shields B. J., Stevens J., Li J., Parasram M., Damani F., Alvarado J. I. M., Janey J. M., Adams R. P., Doyle A. G., Nature (London), 590, 89–96 (2021).
- 34) Narayanan H., Dingfelder F., Condado Morales I., Patel B., Heding K. E., Bjelke J. R., Egebjerg T., Butté A., Sokolov M., Lorenzen N., Arosio P., Mol. Pharm., 18, 3843–3853 (2021).
- 35) Bellamy H., Rehim A. A., Orhobor O. I., King R., J. Chem. Inf. Model., 62, 3970–3981 (2022).
- 36) R Core Team. “R: A language and environment for statistical computing, 2017,” R Foundation for Statistical Computing, Vienna, Austria.: ‹https://www.R-project.org/›, cited 1 October, 2023.
- 37) Chen T., He T., Benesty M., Khotilovich V., Tang Y., Cho H., Chen K., Mitchell R., Cano I., Zhou T., Li M., Xie J., Lin M., Geng Y., Li Y., Yuan J., “xgboost: Extreme Gradient Boosting. R package version 1.7.3.1, 2023.”: ‹https://github.com/dmlc/xgboost›, cited 1 October, 2023
- 38) Yan Y., “rBayesianOptimization: Bayesian Optimization of Hyperparameters. R package version 1.2.0, 2021.”: ‹https://CRAN.R-project.org/package=rBayesianOptimization›, cited 1 October, 2023.
- 39) Toppozini L., Armstrong C. L., Barrett M. A., Zheng S., Luo L., Nanda H., Sakai V. G., Rheinstädter M. C., Soft Matter, 8, 11839–11849 (2012).
- 40) Kulkarni J. A., Witzigmann D., Leung J., Van Der Meel R., Zaifman J., Darjuan M. M., Grisch-Chan H. M., Thöny B., Tam Y. Y. C., Cullis P. R., Nanoscale, 11, 9023–9031 (2019).
- 41) Osouli-Bostanabad K., Puliga S., Serrano D. R., Bucchi A., Halbert G., Lalatsa A., Pharmaceutics, 14, 1940 (2022).
- 42) Lou G., Anderluzzi G., Woods S., Roberts C. W., Perrie Y., Eur. J. Pharm. Biopharm., 143, 51–60 (2019).
- 43) Sato Y., Hatakeyama H., Hyodo M., Harashima H., Mol. Ther., 24, 788–795 (2016).
- 44) Khalil I. A., Younis M. A., Kimura S., Harashima H., Biol. Pharm. Bull., 43, 584–595 (2020).
- 45) Kastner E., Kaur R., Lowry D., Moghaddam B., Wilkinson A., Perrie Y., Int. J. Pharm., 477, 361–368 (2014).
- 46) Belliveau N. M., Huft J., Lin P. J. C., Chen S., Leung A. K. K., Leaver T. J., Wild A. W., Lee J. B., Taylor R. J., Tam Y. K., Hansen C. L., Cullis P. R., Mol. Ther. Nucleic Acids, 1, e37 (2012).
- 47) Kondo M., Wathsala H. D. P., Salem M. S. H., Ishikawa K., Hara S., Takaai T., Washio T., Sasai H., Takizawa S., Commun. Chem., 5, 148 (2022).
- 48) Tavares Luiz M., Santos Rosa Viegas J., Palma Abriata J., Viegas F., Testa Moura De Carvalho Vicentini F., Lopes Badra Bentley M. V., Chorilli M., Maldonado Marchetti J., Tapia-Blácido D. R., Eur. J. Pharm. Biopharm., 165, 127–148 (2021).
- 49) Zhang L., Mao S., Asian J. Pharm. Sci., 12, 1–8 (2017).
- 50) Filipe V., Hawe A., Jiskoot W., Pharm. Res., 27, 796–810 (2010).
- 51) Hald Albertsen C., Kulkarni J. A., Witzigmann D., Lind M., Petersson K., Simonsen J. B., Adv. Drug Deliv. Rev., 188, 114416 (2022).
- 52) Leung A. K. K., Tam Y. Y. C., Chen S., Hafez I. M., Cullis P. R., J. Phys. Chem. B, 119, 8698–8706 (2015).
- 53) Cheng M. H. Y., Leung J., Zhang Y., Strong C., Basha G., Momeni A., Chen Y., Jan E., Abdolahzadeh A., Wang X., Kulkarni J. A., Witzigmann D., Cullis P. R., Adv. Mater., 35, 2303370 (2023).
- 54) Kuboi Y., Suzuki Y., Motoi S., Matsui C., Toritsuka N., Nakatani T., Tahara K., Takahashi Y., Ida Y., Tomimatsu A., Soejima M., Imai T., Mol. Ther. Nucleic Acids, 31, 339–351 (2023).
- 55) Suzuki Y., Hyodo K., Suzuki T., Tanaka Y., Kikuchi H., Ishihara H., Int. J. Pharm., 519, 34–43 (2017).
- 56) Yanez Arteta M., Kjellman T., Bartesaghi S., Wallin S., Wu X., Kvist A. J., Dabkowska A., Székely N., Radulescu A., Bergenholtz J., Lindfors L., Proc. Natl. Acad. Sci. U.S.A., 115, E3351–E3360 (2018).
- 57) Tong X., Raffaele J., Feller K., Dornadula G., Devlin J., Boyd D., Loughney J. W., Shanter J., Rustandi R. R., Vaccines (Basel), 12, 169 (2024).