Abstract
Recently, we reported that linagliptin had equivalent efficacy to voglibose in reducing postprandial blood glucose levels in drug-naïve patients with type 2 diabetes (L-STEP Study). As a sub-study of the L-STEP Study we examined the effect of linagliptin on postprandial lipids profile. Between October 2012 and April 2014, the study enrolled patients with type 2 diabetes mellitus who had inadequate glycemic control. Patients were randomly assigned to either the linagliptin group (5 mg once daily, n = 85) or the voglibose group (0.2 mg/meal thrice daily, n = 71). Meal tolerance tests were performed at baseline (week 0) and endpoint (week 12). The increments in 4-h postprandial triglyceride, remnant lipoprotein cholesterol (RLP-C), and apolipoprotein B48 (ApoB48) from baseline to endpoint in the linagliptin group were lower (p < 0.001, p = 0.025 and p < 0.001). 4-h postprandial ApoB48 at endpoint was lower in the linagliptin group (p = 0.007), and positive correlation was detected between change of ApoB48 and changes in both triglyceride (r = 0.67, p < 0.001) and RLP-C (r = 0.73, p < 0.001) at 4 h. This study revealed that in drug-naïve Japanese patients with relatively mild type 2 diabetes mellitus, linagliptin improves not only postprandial blood glucose level but also levels of lipids such as TG and RLP-C by reducing the ApoB48 level compared with voglibose.
THE PREVALENCE of type 2 diabetes mellitus (T2DM) is increasing in both Western and Asian countries. One of the major problems associated with T2DM is increased risk of cardiovascular disease. Dyslipidemia accompanying a relative decrease in insulin action plays an important role in the progression of atherosclerosis in patients with T2DM. While previous studies showed that high levels of low-density lipoprotein (LDL) cholesterol, low levels of high-density lipoprotein (HDL) cholesterol, and high levels of triglyceride (TG) were associated with increased cardiovascular events in patients with T2DM [1, 2], many studies revealed that postprandial dyslipidemia was an also independent risk factor for cardiovascular diseases such as coronary artery disease [3], carotid atherosclerosis [4], sudden death [5], and stroke [6]. Indeed, in our previous study, we found that decreased endothelial function in patients with T2DM during meal load was strongly correlated with postprandial TG levels, but not postprandial glucose levels [7].
Apolipoprotein B48 (ApoB48) is one of several intestinally derived lipoproteins. Previous studies reported that ApoB48 levels were correlated with carotid intima-media thickness, even when TG levels were within the normal range (100–150 mg/dL) [8], as well as with prevalence of coronary artery stenosis [9]. These correlation allow for assessment of the arteriosclerotic risk posed by the chylomicron remnant that cannot be detected by conventional TG determination.
Previous studies demonstrated that glucagon-like peptide-1 (GLP-1) [10], GLP-1 analogues [11], and dipeptidyl peptidase-4 (DPP-4) inhibitors, the last of which enhance the action of GLP-1 [12-14], reduces levels of postprandial triglyceride and ApoB48 after fat-rich meals. Regarding the underlying mechanism, a GLP-1 receptor agonist, exenatide, and a DPP-4 inhibitor, sitagliptin, were shown to directly suppress the production of intestinal lipoprotein particle production in healthy volunteers [15, 16]. However, the effect of DPP-4 inhibitors on lipid levels after a relatively standard meal in patients with T2DM is not yet clear. Indeed, Okada et al. found no significant effect of sitagliptin on lipid levels after a meal whose ratio of that carbohydrate, protein, and fat was similar to that of a standard diet [17].
DPP-4 inhibitors are currently the most frequently used oral anti-diabetic drugs in Japan, and also the drugs most commonly selected as a first-line therapy [18]. We recently conducted a multicenter, randomized, parallel-group study to compare the effects of linagliptin, a once-daily DPP4 inhibitor, and voglibose, an α-glucosidase inhibitor (α-GI) (L-STEP Study), since α-GI were used for many years as the first-line drug therapy in Japan. In the L-STEP Study, we found that linagliptin monotherapy resulted in a significant reduction of HbA1c and fasting glucose levels compared with voglibose therapy, but 2-h postprandial glucose levels were equivalent [19]. Here, we compared the effects of the DPP4 inhibitor linagliptin and α-GI voglibose on lipid metabolism during a regular meal loading test, as well as the drug’ effects over a 12-week period. This study was originally planned as a sub-study of the L-STEP Study.
Subjects and Methods
Participants
The inclusion criteria of this study were previously described [19]. Recruitment for the trial began on October 12, 2012, and ended on April 16, 2014. Eligible participants for the trial are patients aged ≥20 years with T2DM who visited the outpatient clinics of the 44 institutions listed in the Supplementary Table S1. Enrolled patients were inadequate glycemic control (HbA1c 6.2–9.4% in patients previously untreated with oral anti-diabetic drugs [OADs] irrespective of sex). The local institutional review boards and independent ethics committees approved the trial protocol. The trial is to be conducted in full compliance with the articles of the Declaration of Helsinki and according to the Ethical Guidelines for Medical and Health Research Involving Human Subjects established by the Ministry of Health, Labour, and Welfare and the Ministry of Education, Culture, Sports, Science, and Technology in Japan. The L-STEP main study was registered by the UMIN (ID: UMIN 000008591). All subjects recruited in the L-STEP main study were asked to participate in the L-STEP sub-study I.
Supplementary Table S1
List of 44 medical institutions participating in the study
| List of 44 enrolled sites. |
| Chimori Clinic |
| Fukushima Medical University |
| Hirose Clinic |
| Hotaruno Central Clinic |
| Irako Clinic |
| Ishii Hospital |
| Japanese Red Cross Medical Center |
| Juntendo Tokyo Koto Geriatric Medical Center |
| Juntendo University |
| Kaijou Bill Clinic |
| Kashiwa Municipal Hospital |
| Keiai-kai Seibu Hospital |
| Kenkoubunkakai Azusawa Hospital |
| Kochi University |
| Matsubara Clinic |
| Medical Corporation Taneda Clinic |
| Medical Corporation Kyoujinkai Komatsu Hospital |
| Misaki Naika Clinic |
| Nishihara Clinic |
| Nishimura Clinic |
| Otoshi Medical Clinic |
| Oyama East Clinic |
| Saitama Medical University Hospital |
| Sakakibara Kouseikai Shinjuku Mitsui Building Clinic |
| Seino Internal Medicine Clinic |
| Sekiminato Kinenkai Green Clinic |
| Sennan Nishide Hospital |
| Shimizu Clinic |
| Shiraiwa Medical Clinic |
| Sugawara Clinic |
| Takahashi Kiyohito Clinic |
| Takayama Hospital |
| Takekawa Clinic |
| Tanaka Clinic |
| Tenri Hospital |
| Toho University Omori Medical Center |
| Tokyo Metropolitan Tama Medical Center |
| Toyonaka-Wakabakai Hospital |
| University of Occupational and Environmental Health |
| Wakamatsu Hospital of the University of Occupational and Environmental Health |
| Wakayama Rosai Hospital |
| Yaeikai Yayoi Medical Clinic |
| Yokohama Ryokuen Okanoue Clinic |
| Yokohama Sakae Kyosai Hospital |
Eligible and consenting participants were randomized (1:1), in a double-blind manner to either receive linagliptin (5 mg once daily) or voglibose (0.2 mg/meal thrice daily), using the web-based minimization dynamic allocation method balancing for HbA1c and body mass index (BMI) at baseline. Fasting blood samples were collected at baseline and 12 weeks, cookie tolerance tests were performed at baseline and 12 weeks of treatment. Cookie for test contained a total of 592 kcal, 75 g carbohydrate (flour, starch, and maltose), 28.5 g fat (butter), and 8 g protein (Saraya Corp., Osaka, Japan) [20, 21]. Blood samples were collected during the fasting state and 1, 2, and 4 h after the load. In all patients, meal test was performed under stable conditions.
Study outcomes
The primary endpoint of this study were change in the ApoB48 levels at 0, 1, 2, and 4 h after the load at 12 weeks of treatment and changes over time in each of the above values. These were measured at baseline and after the 12 weeks of treatment. Key secondary endpoints include the serum glucose, remnant lipoprotein cholesterol (RLP-C), TG, glucagon, insulin, proinsulin, and the proinsulin-to-insulin ratio at 0, 1, 2, 4 h during the meal tolerance test and changes over time in each of the above values, with compared between the two groups.
Laboratory tests
Measurement of lipid profiles and other markers was outsourced to SRL, Inc. (Tokyo, Japan). Insulin was measured by a chemiluminescent enzyme immunoassay with Lumipulse Presto Insulin (Fuji Rebio, Tokyo, Japan), proinsulin was measured by an RIA2 antibody with a human proinsulin RIA kit (Millipore, St. Charles, MO, USA), ApoB48 was measured by the CLIA assay (Fujirebio, Tokyo, Japan), and glucagon was assayed by a radioimmunoassay kit (Cat. #GL-32K, Millipore, St. Charles, MO, USA; or Glucagon RIA kit, Euro-Diagnostica AB, Malmö, Sweden). All samples were stored at –80°C until measurement.
Statistical analysis
Data were expressed as mean ± standard deviation (SD). Efficacy was analyzed using an analysis set (Fig. 1). Comparisons between two groups were assessed using Student’s t-test or the Wilcoxon rank-sum test for continuous variables and Fisher’s exact test for categorical variables. Changes from baseline to 12 weeks were assessed using the one-sample t-test or Wilcoxon signed-rank test within two groups. In addition, the change in blood glucose level from baseline to 12 weeks was analyzed using the mixed effects model for repeated measures, including treatment group, time after the load (0, 1, 2, and 4 h) as factors, interactions between the treatment group and time, and baseline glucose levels as a covariate; an unstructured covariance structure was used to model the covariance for within-subject variability. The correlation between two parameters was assessed using Spearmans’ correlation coefficient. The level of significance was set as p < 0.05. All analyses were performed using SAS software version 9.4 (SAS Institute, Cary, NC).

Results
Baseline characteristics
Fig. 1 shows the study flowchart. The L-STEP main study was randomly assigned to either the linagliptin group (n = 192) or the voglibose group (n = 190) and a total of 161 patients agreed to participate in the L-STEP sub-study I; 86 in the linagliptin group and 75 in the voglibose group. Five patients were excluded from the analysis set, and the remaining 156 patients were included in the analysis (85 in the linagliptin group and 71 in the voglibose group). Two subjects with adverse events, including one patient with cancer, were withdrawn from the linagliptin group, and one subject was withdrawn from the voglibose group.
The baseline data of the subjects in this sub-study were well balanced (Table 1). Of the 85 participants in linagliptin group, 43 were males and 42 were females. Of the 71 participants in voglibose group, 33 were males and 38 were females. The mean participant ages were 60.8 ± 11.9 years (linagliptin group) and 61.1 ± 11.8 years (voglibose group), the mean BMIs were 25.0 ± 5.3 kg/m2 (linagliptin group) and 25.8 ± 4.6 kg/m2 (voglibose group), and the mean HbA1c levels were 7.0 ± 0.7 % (linagliptin group), and 6.9 ± 0.6 % (voglibose group).
Table 1
Clinical data for each variable at baseline and at 12 weeks after treatment
| Variable |
Baseline |
Week 12 |
Change from baseline |
p value (intragroup) |
| Body mass index (kg/m2) |
|
|
|
|
| Linagliptin |
25.0 ± 5.3 |
25.0 ± 5.6 |
–0.1 ± 0.9 |
0.42 |
| Voglibose |
25.8 ± 4.6 |
25.4 ± 4.4 |
–0.4 ± 0.8 |
<0.001 |
| p-value (intergroup) |
0.34 |
0.62 |
0.008 |
|
| HbA1c (%) |
|
|
|
|
| Linagliptin |
7.0 ± 0.7 |
6.5 ± 0.5 |
–0.5 ± 0.5 |
<0.001 |
| Voglibose |
6.9 ± 0.6 |
6.7 ± 0.8 |
–0.2 ± 0.5 |
0.009 |
| p-value (intergroup) |
0.60 |
0.034 |
<0.001 |
|
| SBP (mmHG) |
|
|
|
|
| Linagliptin |
131.9 ± 18.5 |
130.1 ± 18.9 |
–1.6 ± 15.9 |
0.36 |
| Voglibose |
131.1 ± 17.4 |
130.3 ± 17.6 |
–1.3 ± 15.9 |
0.52 |
| p-value (intergroup) |
0.79 |
0.96 |
0.89 |
|
| DBP (mmHG) |
|
|
|
|
| Linagliputin |
78.6 ± 11.6 |
78.5 ± 12.5 |
0.3 ± 10.9 |
0.82 |
| Voglibose |
79.7 ± 11.6 |
78.0 ± 11.8 |
–1.9 ± 10.0 |
0.12 |
| p-value (intergroup) |
0.56 |
0.80 |
0.20 |
|
| LDL-C (mmol/L) |
|
|
|
|
| Linagliptin |
2.9 ± 0.8 |
2.9 ± 0.8 |
0.0004 ± 0.62229 |
1 |
| Voglibose |
2.9 ± 0.8 |
2.9 ± 0.9 |
–0.0009 ± 0.6990 |
0.99 |
| p-value (intergroup) |
0.87 |
0.89 |
0.99 |
|
| HDL-C (mmol/L) |
|
|
|
|
| Linagliptin |
1.6 ± 0.4 |
1.5 ± 0.4 |
–0.031 ± 0.191 |
0.15 |
| Voglibose |
1.6 ± 0.5 |
1.5 ± 0.5 |
–0.050 ± 0.206 |
0.047 |
| p-value (intergroup) |
0.73 |
0.97 |
0.56 |
|
Data are expressed as mean ± SD.
“Changes from baseline” are shown as the changes in actual values between baseline and week 12.
At week 12, subjects in the voglibose group exhibited significant decreases in BMI from baseline (–0.4 ± 0.8 kg/m2, p < 0.001), while these parameters were unchanged in the linagliptin group (–0.1 ± 0.9 kg/m2, p = 0.42) (Table 1). The mean decrease in BMI was significantly greater in the voglibose group versus the linagliptin group (p = 0.008; Table 1).
Voglibose treatment was associated with a significant decrease in HDL-C levels from baseline (–0.050 ± 0.206 mmol/mol, p = 0.0047). However, changes in HDL-C levels did not differ significantly between the two groups (Table 1). Systolic blood pressure (SBP), diastolic blood pressure (DBP), and LDL-C levels were comparable between the two groups both at baseline and the week 12.
Primary endpoint
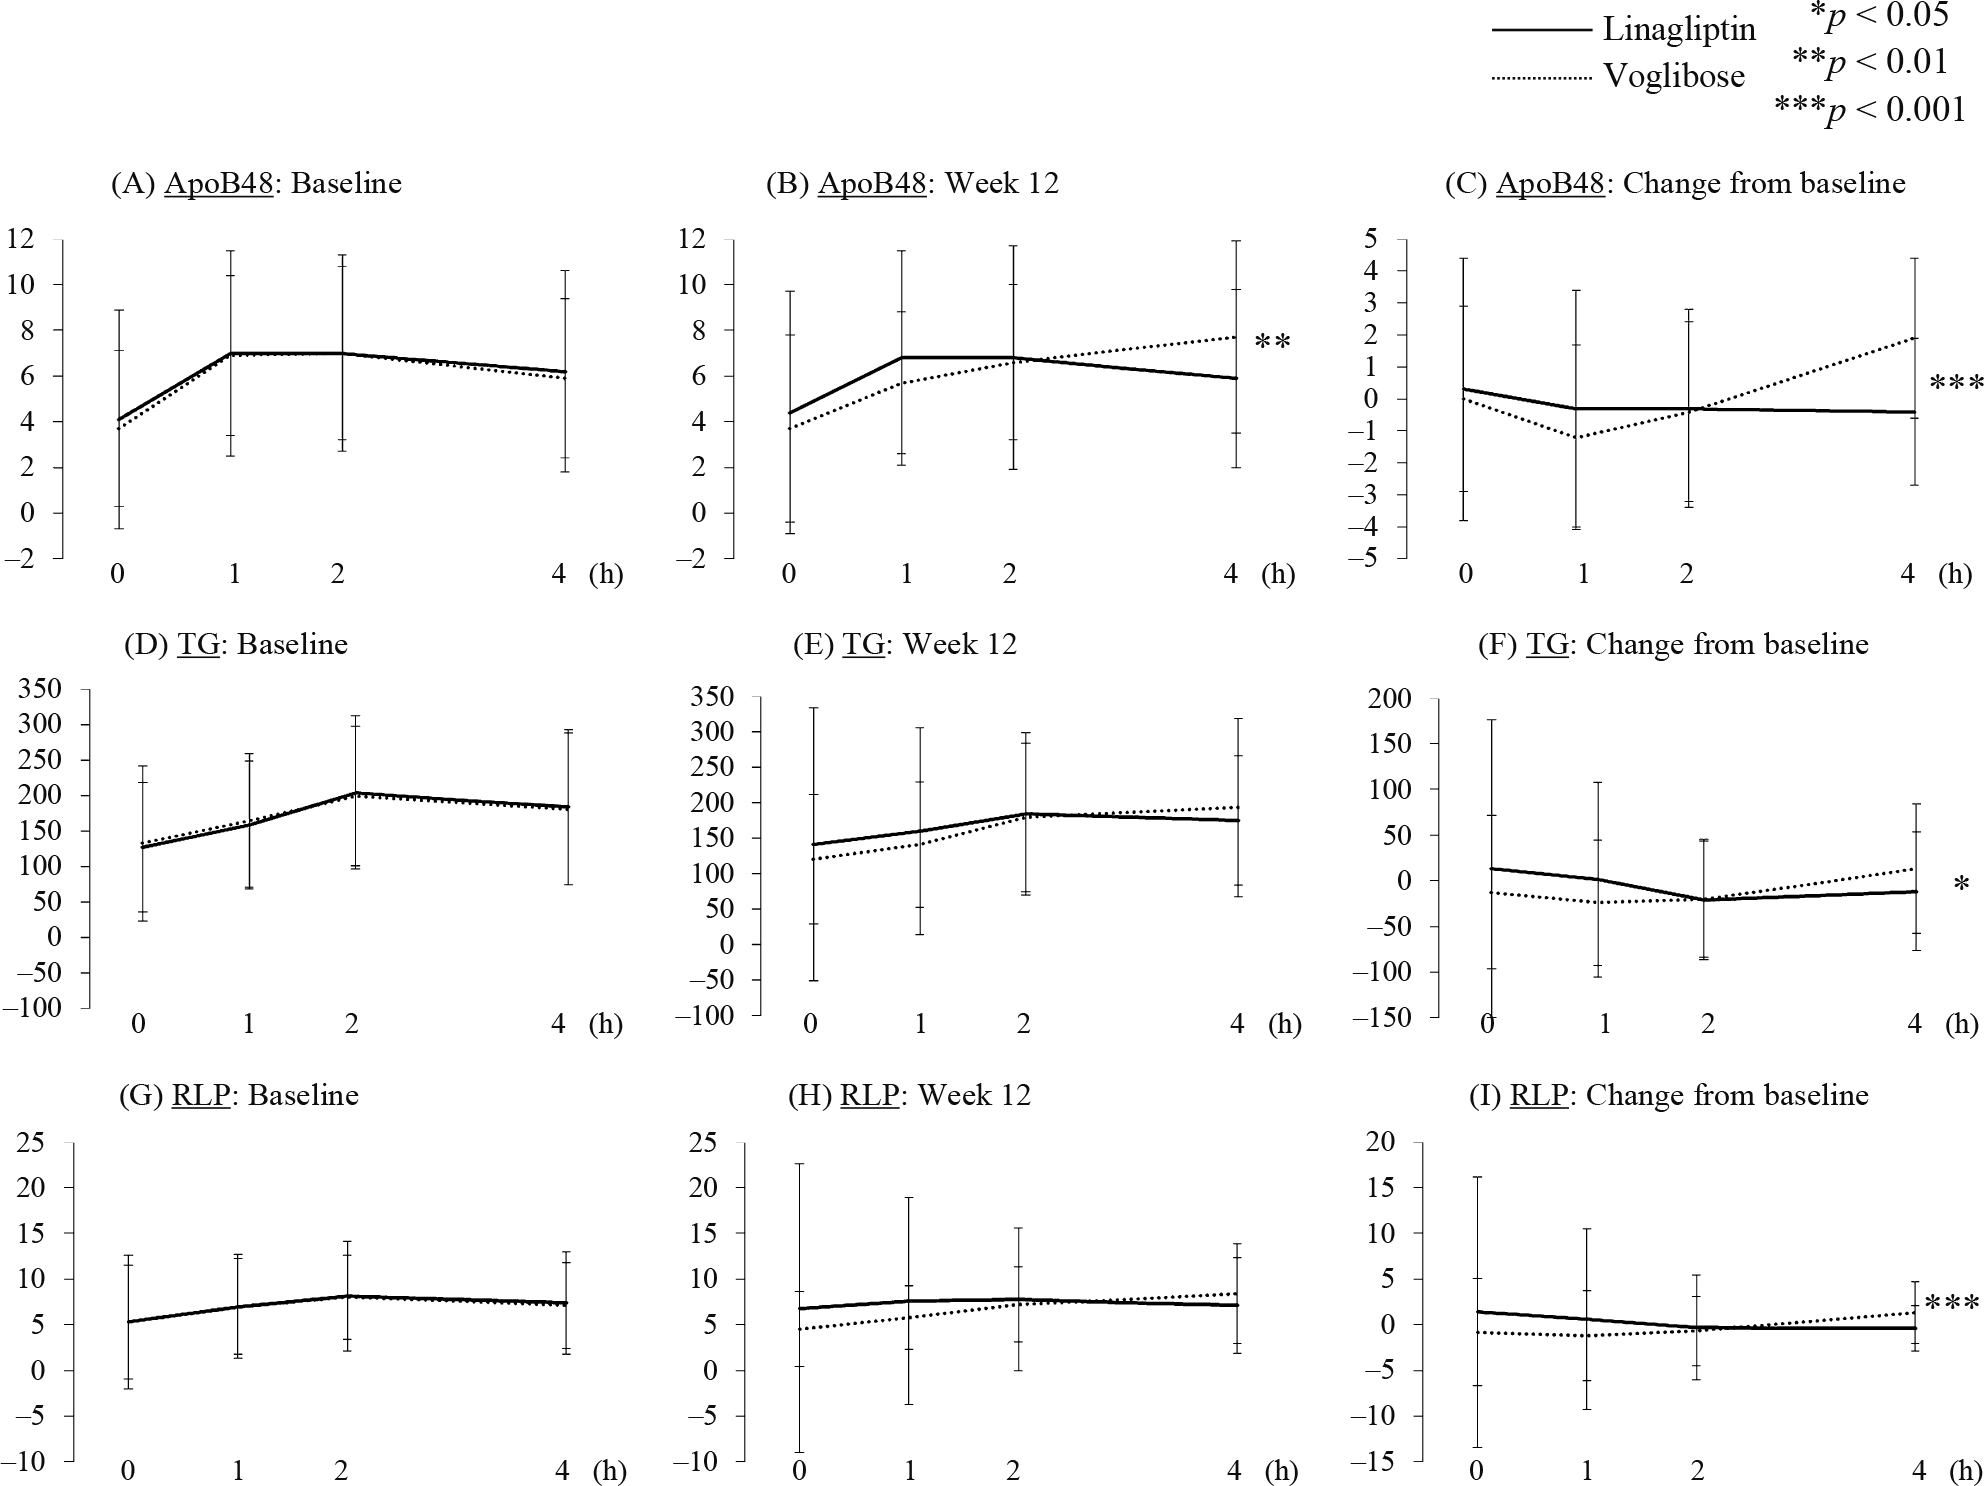
No significant between-group differences in fasting, 1-h, or 2-h postprandial ApoB48 levels were detected. However, the 1-h postprandial ApoB-48 level at 12 weeks was significantly decreased compared with baseline only in the voglibose group. The 4-h postprandial ApoB48 level at 12 weeks was significantly increased only in the voglibose group, resulting in a significant difference between the voglibose and linagliptin groups.
Parameters related to lipid metabolism
As shown in Fig. 2, 1-h and 2-h postprandial TG levels were reduced by voglibose treatment while the 2-h postprandial TG level was reduced by linagliptin treatment (Supplementary Table S2). A between-group difference in postprandial TG levels from baseline to week 12 was observed only at 4 h, at which time the TG level was decreased in the linagliptin group but increased in the voglibose group. Regarding RLP cholesterol (RLP-C), in the voglibose group only the 1-h postprandial level was significantly decreased while the 4-h postprandial level was significantly increased. The change in the 4-h postprandial RLP-C level from baseline to week 12 was significantly different between the two groups. These data showed that linagliptin treatment ameliorated 4-h postprandial lipid parameters compared with voglibose treatment. Thus, we sought to identify which factors correlated with the change in ApoB48 level at 4 h in the linagliptin group. A significant positive correlation was detected between change in ApoB48 level at 4 h and changes in both TG (r = 0.67, p < 0.001) and RLP-C (r = 0.73, p < 0.001) levels at 4 h. In addition, weak positive correlations were detected between change in ApoB48 level at 4 h and changes in blood glucose and proinsulin levels at 4 h.
Supplementary Table S2
Comparison of delta of each lipid parameters during meal tolerance test at baseline and 12 weeks in each group
|
h |
Linagliptin |
Voglibose |
p value
(intergroup for change) |
| week 0 |
week 12 |
change |
week 0 |
week 12 |
change |
Delta TG
(mg/dL) |
1 |
31.6 ± 33.2 |
18.9 ± 55.0 |
–12.4 ± 65.4 |
32.1 ± 40.6 |
20.8 ± 23.2 |
–11.5 ± 29.5 |
0.91 |
| 2 |
76.6 ± 56.0 |
42.4 ± 106.1 |
–34.1 ± 130.6 |
66.9 ± 59.6 |
59.1 ± 46.0 |
–7.5 ± 55.7 |
0.12 |
| 4 |
57.3 ± 69.4 |
33.9 ± 167.9 |
–24.9 ± 190.0 |
48.7 ± 82.6 |
73.3 ± 54.3 |
25.8 ± 80.6 |
0.040 |
Delta ApoB48
(μg/mL) |
1 |
2.9 ± 1.8 |
2.4 ± 1.7 |
–0.6 ± 1.5 |
3.2 ± 1.7 |
2.0 ± 2.9 |
–1.2 ± 2.7 |
0.07 |
| 2 |
2.9 ± 2.4 |
2.4 ± 1.7 |
–0.5 ± 2.1 |
3.3 ± 1.8 |
2.9 ± 2.8 |
–0.4 ± 2.9 |
0.70 |
| 4 |
2.1 ± 3.1 |
1.5 ± 2.8 |
–0.7 ± 3.7 |
2.2 ± 2.1 |
4.0 ± 2.7 |
1.8 ± 3.1 |
<0.001 |
Delta RLP-C
(mg/dL) |
1 |
1.7 ± 2.4 |
0.8 ± 4.9 |
–0.9 ± 5.2 |
1.7 ± 2.1 |
1.3 ± 1.7 |
–0.4 ± 1.8 |
0.48 |
| 2 |
2.7 ± 2.9 |
1.0 ± 8.8 |
–1.7 ± 9.7 |
2.7 ± 3.3 |
2.7 ± 2.4 |
–0.0 ± 3.4 |
0.14 |
| 4 |
2.1 ± 4.1 |
0.3 ± 13.6 |
–1.8 ± 14.9 |
1.8 ± 5.2 |
3.9 ± 3.2 |
2.1 ± 5.5 |
0.037 |
Data are expressed as mean ± standard deviation.
p values represent the differences between the linagliptin and voglibose groups by the mixed effects model for repeated measures.
As shown in Table 2, linagliptin but not voglibose significantly reduced the fasting blood glucose level by week 12. Similarly, the change in HbA1c level from baseline to week 12 was greater in the linagliptin group than in the voglibose group, although treatment with both linagliptin and voglibose significantly reduced HbA1c levels (Table 1). On the other hand, while 1-h and 2-h postprandial blood glucose levels were significantly reduced both by linagliptin and voglibose, the change in the 1-h glucose level was greater in the voglibose group, and only linagliptin showed a significant reduction in the 4-h glucose level (Table 2).
Table 2
Comparison of changes in various parameters during meal tolerance test at baseline and 12 weeks in each group
|
h |
Linagliptin |
Voglibose |
p value (intergroup for change) |
| week 0 |
week 12 |
change |
week 0 |
week 12 |
change |
| Blood Glucose (mmol/mol) |
0 |
7.4 ± 1.5 |
6.9 ± 1.1 |
–0.52 ± 1.05*** |
7.4 ± 1.3 |
7.3 ± 1.6 |
–0.09 ± 0.89 |
0.008 |
| 1 |
13.3 ± 2.8 |
11.4 ± 2.2 |
–1.93 ± 2.00*** |
13.0 ± 2.5 |
10.3 ± 2.4 |
–2.64 ± 1.61*** |
0.019 |
| 2 |
12.9 ± 3.7 |
11.0 ± 2.4 |
–1.96 ± 2.71 *** |
12.3 ± 3.5 |
10.4 ± 2.8 |
–1.97 ± 2.22*** |
0.98 |
| 4 |
9.0 ± 3.2 |
7.8 ± 1.9 |
–1.25 ± 2.35*** |
8.5 ± 2.9 |
9.0 ± 2.7 |
0.45 ± 1.90 |
<0.001 |
| Insulin (µIU/mL) |
0 |
60.7 ± 45.1 |
64.1 ± 51.1 |
2.5 ± 33.4 |
66.6 ± 61.0 |
68.0 ± 65.1 |
0.7 ± 31.6 |
0.73 |
| 1 |
291.8 ± 218.2 |
298.0 ± 192.3 |
2.7 ± 127.7 |
346.8 ± 292.6 |
237.8 ± 213.0*** |
–112.0 ± 155.4** |
<0.001 |
| 2 |
340.8 ± 246.2 |
347.2 ± 216.8 |
2.3 ± 151.8 |
366.4 ± 338.3 |
266.1 ± 206.5*** |
–103.7 ± 208.9** |
<0.001 |
| 4 |
146.6 ± 98.1 |
172.6 ± 146.7* |
25.4 ± 108.8* |
180.9 ± 162.0 |
182.7 ± 139.7 |
–0.3 ± 117.3 |
0.16 |
| Proinsulin (pmol/L) |
0 |
22.1 ± 14.6 |
20.7 ± 21.2 |
–1.7 ± 16.3 |
26.1 ± 23.1 |
22.0 ± 22.5** |
–4.3 ± 11.1 |
0.27 |
| 1 |
51.2 ± 30.5 |
48.4 ± 29.2 |
–3.4 ± 22.9 |
61.1 ± 47.4 |
46.7 ± 38.8*** |
–14.8 ± 22.9 |
0.003 |
| 2 |
81.7 ± 43.3 |
77.6 ± 40.1 |
–4.7 ± 27.9 |
91.0 ± 64.7 |
69.7 ± 44.4*** |
–21.7 ± 35.2 |
0.001 |
| 4 |
61.9 ± 34.1 |
62.9 ± 35.6 |
1.5 ± 23.7 |
71.2 ± 50.5 |
68.0 ± 44.5 |
–3.8 ± 29.5 |
0.23 |
Proinsulin-to-
insulin ratio |
0 |
0.44 ± 0.25 |
0.35 ± 0.18*** |
–0.09 ± 0.18 |
0.43 ± 0.21 |
0.37 ± 0.23* |
–0.05 ± 0.16 |
0.18 |
| 1 |
0.25 ± 0.34 |
0.20 ± 0.15 |
–0.05 ± 0.33 |
0.21 ± 0.10 |
0.26 ± 0.32 |
0.06 ± 0.31 |
0.042 |
| 2 |
0.31 ± 0.21 |
0.27 ± 0.15** |
–0.04 ± 0.14 |
0.30 ± 0.13 |
0.55 ± 1.92 |
0.25 ± 1.93 |
0.17 |
| 4 |
0.50 ± 0.21 |
0.48 ± 0.27 |
–0.02 ± 0.21 |
0.50 ± 0.24 |
0.47 ± 0.24 |
–0.03 ± 0.21 |
0.69 |
| C-peptide (ng/mL) |
0 |
0.70 ± 0.31 |
0.72 ± 0.32 |
0.01 ± 0.21 |
0.73 ± 0.36 |
0.72 ± 0.37 |
–0.02 ± 0.17 |
0.36 |
| 1 |
1.81 ± 0.73 |
1.91 ± 0.66 |
0.09 ± 0.45 |
1.92 ± 0.87 |
1.61 ± 0.76*** |
–0.32 ± 0.45 |
<0.001 |
| 2 |
2.54 ± 0.88 |
2.63 ± 0.79 |
0.08 ± 0.47 |
2.56 ± 1.06 |
2.09 ± 0.83*** |
–0.48 ± 0.61 |
<0.001 |
| 4 |
1.80 ± 0.68 |
1.93 ± 0.77* |
0.13 ± 0.49 |
1.86 ± 0.87 |
1.86 ± 0.76 |
–0.02 ± 0.51 |
0.082 |
| glucagon (pg/mL) |
0 |
83.1 ± 31.2 |
89.8 ± 28.3** |
6.0 ± 20.4 |
84.5 ± 29.8 |
94.0 ± 31.9** |
9.1 ± 23.8 |
0.39 |
| 1 |
87.4 ± 32.9 |
88.0 ± 28.0 |
0.2 ± 20.0 |
89.0 ± 29.9 |
100.8 ± 29.0*** |
11.4 ± 23.9 |
0.002 |
| 2 |
78.5 ± 33.1 |
80.8 ± 28.4 |
1.8 ± 22.1 |
78.4 ± 26.1 |
96.3 ± 27.7*** |
17.7 ± 22.8 |
<0.001 |
| 4 |
71.7 ± 30.4 |
76.6 ± 28.8 |
4.3 ± 20.2 |
74.3 ± 23.5 |
91.5 ± 25.8*** |
16.8 ± 20.9 |
<0.001 |
Data are expressed as mean ± standard deviation.
p values represent the differences between the linagliptin and voglibose groups by the mixed effects model for repeated measures, and between week 0 and week 12 by the one-sample t-test. *p < 0.05, ** p < 0.01, *** p < 0.001
The 1-h and 2-h postprandial insulin levels were reduced after voglibose treatment, and the reduction in the voglibose group was greater than that in the linagliptin group, despite no significant between-group difference at baseline. On the other hand, the 4-h postprandial insulin level was augmented after linagliptin treatment, while no change in the 4-h postprandial insulin level was observed in the voglibose group (Table 2). A significant decrease in the 1-h postprandial proinsulin-to-insulin ratio was observed in the linagliptin group compared with the voglibose group. The 1-h, 2-h, and 4-h postprandial glucagon levels were increased after voglibose treatment, and changes after treatment in the voglibose group were significantly greater than in the linagliptin group.
Discussion
This study analyzed a large number of randomly allocated, drug-naïve Japanese patients with type 2 diabetes mellitus, and reveal that administration of both linagliptin and voglibose significantly improved postprandial blood glucose levels. In this setting, linagliptin showed superiority in postprandial lipid parameters such as ApoB48, TG, and RLP-C levels compared with voglibose. In fact, as the difference in lipid profile between the groups was only seen at 4 h during the meal tolerance test, it is not clear these finding on CV outcome. However, previous studies that examined the relationship between non-fasting TG levels and the onset of atherosclerotic disease demonstrated significant correlations between TG levels and risks of cardiovascular disease, sudden death [5], and stroke [6]; indicating that postprandial hyperlipidemia plays a role in the development of atherosclerotic diseases. Furthermore, we previously reported that high-fat diet loading reduced vascular endothelial function in patients with type 2 diabetes, suggesting that the existence of postprandial hyperlipidemia may facilitate the progression of endothelial dysfunction [22]. Also we showed in patients with type 2 diabetes that the diet loading test resulted in a significant decrease in vascular endothelial function, which correlated with TG AUC [7]. In healthy adult volunteers, a cookie load decreased FMD in a manner that correlated significantly with variations in TG and apoB-48 [21]. Thus, many clinical studies suggested the relation between change of lipid profile after meal load and vascular endothelial dysfunction. We suggest that improving dyslipidemia after meals may lead to clinical outcomes. Also as shown in Table 3, the correlation between change in 4-h post-loading ApoB48 level and changes in 4-h post-loading TG and RLP-C levels suggest that linagliptin improves TG and RLP-C levels by reducing ApoB48 levels. Although other papers reported DPP-4 inhibitor reduced levels of postprandial triglyceride and ApoB48 after load [12-14], the current study clearly demonstrates, for the first time, a correlation between post-meal-load-testing changes in TG and RLP-C levels and in ApoB48 levels following administration of a DPP-4 inhibitor in comparison with an α-GI.
Table 3
Correlation analysis for predicting change in ApoB48 at 4 h
| Variable |
Spearman’s correlation coefficient |
| r |
p value |
| change in insulin at 4 h |
0.13 |
0.12 |
| change in C-peptide at 4 h |
0.09 |
0.28 |
| change in TG at 4 h |
0.67 |
<0.001 |
| change in RLP-C at 4 h |
0.73 |
<0.001 |
| change in PG at 4 h |
0.19 |
0.019 |
| change in proinsulin at 4 h |
0.20 |
0.011 |
| change in glucagon at 4 h |
0.10 |
0.23 |
| change in proinsulin-to-insulin ratio of at 4 h |
–0.04 |
0.61 |
Previous studies showed that exenatide and sitagliptin directly suppressed the production of intestinal lipoprotein particle production in healthy volunteers after fat-rich diet [15, 16]. On the other hand, Okada et al. found that sitagliptin did not alter lipid levels after a meal whose ratio of carbohydrate, protein, and fat was similar to that of a standard diet [17]. Similarly, the present study showed no significant effect of linagliptin on lipid levels after a regular meal. On the other hand, voglibose increased the 4-h post-loading level of ApoB48. During the meal tolerance test in this study, the time at which plasma glucose level peaked was delayed from 1 h to 2 h after voglibose administration but not after linagliptin administration. Voglibose induces a lower degree of carbohydrate absorption in the glucose-dependent insulinotropic polypeptide (GIP)-secreting upper portion of the intestine, and a higher degree of carbohydrate absorption in the GLP-1-secreting lower portion of the intestine, than linagliptin. Indeed, Narita et al. [23] reported that an α-GI significantly increased the responses of active GLP-1 and decreased the responses of total GIP after ingestion of a mixed meal in patients with T2DM. GIP has been shown to promote clearance of chylomicron-associated TG from blood in dogs [24] and to lower plasma TG responses to intraduodenal fat in rats [25]. Moreover, Kim et al. [26] reported that GIP in the presence of insulin increased the levels of lipoprotein lipase (LPL) enzyme activity and TG accumulation in differentiated 3T3-L1 adipocytes. LPL is the key enzyme that hydrolyzes TG in TG-rich lipoprotein such as chylomicrons and very low-density lipoprotein (VLDL), thereby regulating the uptake of free fatty acid by peripheral tissues, especially adipose tissue, skeletal muscle, and cardiac muscle [27]. ApoB lipoproteins with LPL have significantly faster rates of clearance than those without LPL [28]. These findings suggest that voglibose might increase postprandial ApoB48 and RLP-C levels by decreasing the postprandial GIP response.
In the meal loading test in this study, the 4-h postprandial blood glucose level was reduced more in the linagliptin group than it was in the voglibose group. Although no significant difference was detected between the two groups in 4-h postprandial levels of insulin or C-peptide at 12 weeks, 4-h postprandial glucagon secretion was significantly suppressed in the linagliptin group compared with the voglibose group at 12 weeks. This indicates that glucagon suppression by linagliptin could, at least in part, be responsible for the reduced blood glucose level at 4 h following the meal.
This study has at least one major limitation. In this study, the 4-h postprandial ApoB48, TG, RLP-C, and glucagon levels at 12 weeks were significantly decreased in patients of the linagliptin group, compared with those of the voglibose group. However, these parameters actually did not decrease in patients of the linagliptin group. Increases in these parameters in the voglibose group might have led to a significant difference between the two groups.
In conclusion, we revealed for the first time that in drug-naïve Japanese patients with type 2 diabetes mellitus, linagliptin was superior to voglibose not only in terms of reducing 4-h postprandial blood glucose, FPG and HbA1c levels, but also in improving lipid metabolism parameters such as ApoB48, TG and RLP-C.
Acknowledgements
The authors wish to thank the study investigators (Supplementary Table S1) for their contributions to this study. This study was financially supported by Nippon Boehringer Ingelheim Co., Ltd. and Eli Lilly and Company.
Disclosure
Y. O. has received lecture fee MSD, Eli Lilly, Novo Nordisk, Kissei, Tanabe Mitsubishi, and Ono. H. W. has received honoraria for scientific lectures from MSD, Eli Lilly, Takeda, Novartis, Dainippon Sumitomo, Sanofi and Daiichi Sankyo and research funds from MSD, Eli Lilly, Takeda, Kowa, Mochida, Sanwakagaku, Novo Nordisk, Kissei, Novartis, Boehringer Ingelheim, AstraZeneca, Astellas, Tanabe Mitsubishi, Dainippon Sumitomo, Abbott, Sanofi Aventis, Pfizer, and Daiichi Sankyo. I. I. has received research support from Novo Nordisk, Astellas, Ono, MSD, and Takeda. Y. F. has received grant support from Takeda, MSD, and Nippon Eli Lilly. Y. F. has also acted as spokesperson for Novartis Pharma, Nippon Eli Lilly, MSD, and Sanofi Aventis. H. S. has received research support from Boehringer, Eli Lilly, and Astellas. T. S. has received lecture fees form Sanofi and Takeda and research support from Novo Nordisk, Sanofi, Takeda, AstraZeneca, Astellas, Boehringer Ingelheim, and Tanabe Mitsubishi. M. G. has received manuscript fee from Kowa.
References
- 1 Turner RC, Millns H, Neil HA, Stratton IM, Manley SE, et al. (1998) Risk factors for coronary artery disease in non-insulin dependent diabetes mellitus: United Kingdom Prospective Diabetes Study (UKPDS: 23). BMJ 316: 823–828.
- 2 Sone H, Tanaka S, Tanaka S, Iimuro S, Oida K, et al. (2011) Serum level of triglycerides is a potent risk factor comparable to LDL cholesterol for coronary heart disease in Japanese patients with type 2 diabetes: subanalysis of the Japan Diabetes Complications Study (JDCS). J Clin Endocrinol Metab 96: 3448–3456.
- 3 Patsch JR, Miesenbock G, Hopferwieser T, Muhlberger V, Knapp E, et al. (1992) Relation of triglyceride metabolism and coronary artery disease. Studies in the postprandial state. Arterioscler Thromb 12: 1336–1345.
- 4 Ryu JE, Howard G, Craven TE, Bond MG, Hagaman AP, et al. (1992) Postprandial triglyceridemia and carotid atherosclerosis in middle-aged subjects. Stroke 23: 823–828.
- 5 Iso H, Naito Y, Sato S, Kitamura A, Okamura T, et al. (2001) Serum triglycerides and risk of coronary heart disease among Japanese men and women. Am J Epidemiol 153: 490–499.
- 6 Freiberg JJ, Tybjaerg-Hansen A, Jensen JS, Nordestgaard BG (2008) Nonfasting triglycerides and risk of ischemic stroke in the general population. JAMA 300: 2142–2152.
- 7 Torimoto K, Okada Y, Mori H, Otsuka T, Kawaguchi M, et al. (2015) Effects of exenatide on postprandial vascular endothelial dysfunction in type 2 diabetes mellitus. Cardiovasc Diabetol 14: 25.
- 8 Nakatani K, Sugimoto T, Masuda D, Okano R, Oya T, et al. (2011) Serum apolipoprotein B-48 levels are correlated with carotid intima-media thickness in subjects with normal serum triglyceride levels. Atherosclerosis 218: 226–232.
- 9 Masuda D, Sakai N, Sugimoto T, Kitazume-Taneike R, Yamashita T, et al. (2011) Fasting serum apolipoprotein B-48 can be a marker of postprandial hyperlipidemia. J Atheroscler Thromb 18: 1062–1070.
- 10 Meier JJ, Gethmann A, Gotze O, Gallwitz B, Holst JJ, et al. (2006) Glucagon-like peptide 1 abolishes the postprandial rise in triglyceride concentrations and lowers levels of non-esterified fatty acids in humans. Diabetologia 49: 452–458.
- 11 Hermansen K, Baekdal TA, During M, Pietraszek A, Mortensen LS, et al. (2013) Liraglutide suppresses postprandial triglyceride and apolipoprotein B48 elevations after a fat-rich meal in patients with type 2 diabetes: a randomized, double-blind, placebo-controlled, cross-over trial. Diabetes Obes Metab 15: 1040–1048.
- 12 Matikainen N, Manttari S, Schweizer A, Ulvestad A, Mills D, et al. (2006) Vildagliptin therapy reduces postprandial intestinal triglyceride-rich lipoprotein particles in patients with type 2 diabetes. Diabetologia 49: 2049–2057.
- 13 Tremblay AJ, Lamarche B, Deacon CF, Weisnagel SJ, Couture P (2011) Effect of sitagliptin therapy on postprandial lipoprotein levels in patients with type 2 diabetes. Diabetes Obes Metab 13: 366–373.
- 14 Kojima Y, Kaga H, Hayashi S, Kitazawa T, Iimura Y, et al. (2013) Comparison between sitagliptin and nateglinide on postprandial lipid levels: the STANDARD study. World J Diabetes 4: 8–13.
- 15 Xiao C, Bandsma RH, Dash S, Szeto L, Lewis GF (2012) Exenatide, a glucagon-like peptide-1 receptor agonist, acutely inhibits intestinal lipoprotein production in healthy humans. Arterioscler Thromb Vasc Biol 32: 1513–1519.
- 16 Xiao C, Dash S, Morgantini C, Patterson BW, Lewis GF (2014) Sitagliptin, a DPP-4 inhibitor, acutely inhibits intestinal lipoprotein particle secretion in healthy humans. Diabetes 63: 2394–2401.
- 17 Okada K, Yagyu H, Kotani K, Yamazaki H, Ozaki K, et al. (2013) Effects of miglitol versus sitagliptin on postprandial glucose and lipoprotein metabolism in patients with type 2 diabetes mellitus. Endocr J 60: 913–922.
- 18 Seino Y, Kuwata H, Yabe D (2016) Incretin-based drugs for type 2 diabetes: focus on East Asian perspectives. J Diabetes Investig 7 Suppl 1: 102–109.
- 19 Fujitani Y, Fujimoto S, Takahashi K, Satoh H, Hirose T, et al. (2016) Effects of linagliptin monotherapy compared with voglibose on postprandial blood glucose responses in Japanese patients with type 2 diabetes: Linagliptin Study of Effects on Postprandial blood glucose (L-STEP). Diabetes Res Clin Pract 121: 146–156.
- 20 Harano Y, Miyawaki T, Nabiki J, Shibachi M, Adachi T, et al. (2006) Development of cookie test for the simultaneous determination of glucose intolerance, hyperinsulinemia, insulin resistance and postprandial dyslipidemia. Endocr J 53: 173–180.
- 21 Yunoki K, Nakamura K, Miyoshi T, Enko K, Kohno K, et al. (2011) Ezetimibe improves postprandial hyperlipemia and its induced endothelial dysfunction. Atherosclerosis 217: 486–491.
- 22 Kurozumi A, Okada Y, Mori H, Kobayashi T, Masuda D, et al. (2016) Detrimental effects of high-fat diet loading on vascular endothelial function and therapeutic efficacy of ezetimibe and statins in patients with type 2 diabetes. Endocr J 63: 431–440.
- 23 Narita T, Yokoyama H, Yamashita R, Sato T, Hosoba M, et al. (2012) Comparisons of the effects of 12-week administration of miglitol and voglibose on the responses of plasma incretins after a mixed meal in Japanese type 2 diabetic patients. Diabetes Obes Metab 14: 283–287.
- 24 Pederson RA, Schubert HE, Brown JC (1975) Gastric inhibitory polypeptide. Its physiologic release and insulinotropic action in the dog. Diabetes 24: 1050–1056.
- 25 Wasada T, McCorkle K, Harris V, Kawai K, Howard B, et al. (1981) Effect of gastric inhibitory polypeptide on plasma levels of chylomicron triglycerides in dogs. J Clin Invest 68: 1106–1107.
- 26 Kim SJ, Nian C, McIntosh CH (2007) Activation of lipoprotein lipase by glucose-dependent insulinotropic polypeptide in adipocytes. A role for a protein kinase B, LKB1, and AMP-activated protein kinase cascade. J Biol Chem 282: 8557–8567.
- 27 Goldberg IJ (1996) Lipoprotein lipase and lipolysis: central roles in lipoprotein metabolism and atherogenesis. J Lipid Res 37: 693–707.
- 28 Zheng C, Murdoch SJ, Brunzell JD, Sacks FM (2006) Lipoprotein lipase bound to apolipoprotein B lipoproteins accelerates clearance of postprandial lipoproteins in humans. Arterioscler Thromb Vasc Biol 26: 891–896.
