Abstract
Xanthine oxidoreductase (XOR), an enzyme of uric acid formation from hypoxanthine and xanthine, is recognized as a source of oxidative stress. Plasma activity of XOR has been reported to be a biomarker of metabolic disorders associated with obesity, liver dysfunction, insulin resistance, hyperuricemia and adipokines. We investigated longitudinal change in plasma XOR activity, which was determined by using mass spectrometry and liquid chromatography to detect [13C2, 15N2]-uric acid using [13C2, 15N2]-xanthine as a substrate, in 511 subjects (male/female: 244/267) of the Tanno-Sobetsu Study in the years 2016 and 2017. Plasma XOR activity in a basal state was significantly higher in men than in women, but no significant sex difference was observed in annual change in plasma XOR activity. Annual change in plasma activity of XOR was positively correlated with changes in each parameter, including body weight (r = 0.203, p < 0.001), body mass index, diastolic blood pressure, aspartate transaminase (AST) (r = 0.772, p < 0.001), alanine transaminase (r = 0.647, p < 0.001), γ-glutamyl transpeptidase, total cholesterol, triglycerides, uric acid, fasting glucose and HbA1c. Multivariate regression analysis demonstrated that change in AST and that in body weight were independent predictors of change in plasma XOR activity after adjustment of age, sex and changes in each variable with a significant correlation without multicollinearity. In conclusion, annual change in plasma XOR activity is independently associated with changes in liver enzymes and body weight in a general population. Improvement of liver function and reduction of body weight would decrease plasma XOR activity and its related oxidative stress as a therapeutic strategy.
IN THE PURINE METABOLISM PATHWAY, an enzyme, xanthine oxidoreductase (XOR), catalyzes the oxidation of hypoxanthine to xanthine and the subsequent oxidation of xanthine to uric acid [1]. XOR is translated as xanthine dehydrogenase (XDH) and reduces NAD+ to NADH. XDH can post-translationally convert to xanthine oxidase (XO), producing superoxide and hydrogen peroxide by consuming oxygen. The total activity of XDH and XO is indicated as XOR activity [2]. Activation of XOR can increase reactive oxygen species, leading to a cause of oxidative stress-mediated tissue injury [3]. However, since plasma XOR activity is extremely low in humans compared to animals [4], it has been hard to accurately determine the activity in humans.
An accurate assay for plasma activity of XOR in humans has recently been established using triple quadrupole mass spectrometry and liquid chromatography to detect the formation of [13C2, 15N2]-uric acid from [13C2, 15N2]-xanthine as a substrate [5]. Using this method, we and others have recently demonstrated that plasma XOR activity is a new biomarker of metabolic disorders associated with obesity, insulin resistance, liver dysfunction, hyperuricemia and adipokines [6-9]. In addition, it has been reported that habitual exercise can decrease plasma XOR activity [10]. However, little is known about predictors for change in plasma XOR activity in a longitudinal course. In the present study, we investigated the annual change in plasma activity of XOR in a general population.
Materials and Methods
Study population
In the Tanno-Sobetsu Study, a population-based prospective cohort study, a total of 627 Japanese subjects (male/female: 292/335) of Sobetsu Town who underwent annual health checkups in 2016. In this population, plasma activity of XOR was investigated in our previous study [7]. Among them, 511 subjects (male/female: 244/267) who underwent annual health checkups again in 2017 were enrolled in this study. This study was done with the approval of the Ethical Committee of Sapporo Medical University under the principles of the Declaration of Helsinki. Written informed consent was obtained from all of the study participants.
Medical checkups, including laboratory measurements, blood pressure and body mass index (BMI) calculation, were carried out as previously described [7]. Estimated glomerular filtration rate (eGFR) was determined by an equation for Japanese people. Homeostasis model assessment of insulin resistance (HOMA-IR) was calculated as insulin (μU/mL) × glucose (mg/dL)/405. Hemoglobin A1c (HbA1c) was expressed in National Glycohemoglobin Standardization Program (NGSP) scale.
Hypertension was defined as systolic blood pressure ≥140 mmHg, diastolic blood pressure ≥90 mmHg or use of antihypertensive drugs. Diabetes mellitus was defined as a combination of fasting glucose ≥126 mg/dL and HbA1c ≥6.5% or use of antidiabetic drugs. Dyslipidemia was defined as HDL cholesterol <40 mg/dL, triglycerides ≥150 mg/dL, LDL cholesterol ≥140 mg/dL or use of antidyslipidemic drugs. Hyperuricemia was defined as uric acid >7 mg/dL or use of antihyperuricemic drugs.
Plasma XOR activity
Activity of XOR in plasma was measured by using triple quadrupole mass spectrometry and liquid chromatography to detect the formation of [13C2, 15N2]-uric acid from [13C2, 15N2]-xanthine as a substrate as previously reported [5, 7]. The lower limit of detection of plasma XOR activity was 6.67 pmol/h/mL plasma, and inter- and intra-assay coefficients of variation in plasma XOR activity were 9.1 % and 6.5%, respectively [5].
Statistical analysis
Numeric parameters are expressed as medians (interquartile ranges) for skewed variables or means ± SD or means ± SEM for normal distributions. Annual change (Δ) in each parameter was calculated as each parameter in 2017 minus that in 2016. The normality of distribution in each variable was tested using the Shapiro-Wilk W test. For regression analyses, non-normally distributed variables were logarithmically transformed. Intergroup differences in percentages of demographic parameters were examined by the chi-square test. Comparison between two groups was performed using the Mann-Whitney U test for nonparametric variables and Student’s t test for parametric variables. One-way analysis of variance and the Tukey-Kramer post hoc test were used for detecting significant differences in data between multiple groups. The correlation between two parameters was evaluated using Pearson’s correlation coefficient. Multivariate regression analysis was carried out to determine independent determinants of annual change in plasma activity of XOR using age, sex and the changes in each variable with a significant correlation as independent predictors without multicollinearity, showing the percentage of variance in the object parameters explained by predictors (R2), unstandardized regression coefficient, standard error (SE) of regression coefficient, the t-ratio determined as the ratio of regression coefficient and SE, and the standardized regression coefficient (β). P-values <0.05 were considered statistically significant. JMP for Macintosh (SAS Institute, Cary, NC) was used for statistical analyses.
Results
Basal characteristics of the study subjects
Characteristics of the 511 recruited subjects (male/female: 244/267, mean age: 66 ± 14 years) in a basal state are shown in Table 1. Hypertension, diabetes mellitus, dyslipidemia and hyperuricemia were found in 300, 56, 281, and 62 subjects, respectively. Males had significantly larger body weight and BMI, significantly higher frequencies of current smoking and drinking habits, higher levels of γ-glutamyl transpeptidase (γGTP), alanine aminotransferase (ALT), aspartate transaminase (AST), blood urea nitrogen (BUN), eGFR, creatinine, fasting glucose, triglycerides, uric acid, and plasma activity of XOR and lower levels of total cholesterol, LDL cholesterol and HDL cholesterol than did females. There was no significant sex difference in age, waist circumference, pulse rate, blood pressure, insulin, HOMA-IR or HbA1c.
Table 1
Basal characteristics of the subjects
|
Total (n = 511) |
Male (n = 244) |
Female (n = 267) |
p |
| Age (years) |
66 ± 14 |
65 ± 14 |
67 ± 14 |
0.253 |
| Body weight (kg) |
59.1 ± 12.0 |
65.8 ± 11.2 |
53.1 ± 9.2 |
<0.001 |
| Body mass index (kg/m2) |
23.5 ± 3.8 |
24.0 ± 3.5 |
23.0 ± 3.9 |
0.006 |
| Waist circumference (cm) |
85.7 ± 10.9 |
86.7 ± 10.4 |
84.9 ± 11.3 |
0.064 |
| Systolic blood pressure (mmHg) |
135 ± 21 |
135 ± 19 |
135 ± 22 |
0.924 |
| Diastolic blood pressure (mmHg) |
76 ± 11 |
77 ± 10 |
75 ± 12 |
0.078 |
| Pulse rate (beats/min) |
70 ± 11 |
69 ± 12 |
71 ± 11 |
0.141 |
| Smoking habit (None/Past/Current) |
319/113/79 |
91/99/54 |
228/14/25 |
<0.001 |
| Alcohol drinking habit |
216 (42.3) |
146 (59.8) |
70 (26.2) |
<0.001 |
| Medications |
|
|
|
|
| Antihypertensive drugs |
195 (38.2) |
90 (36.9) |
105 (39.3) |
0.571 |
| Antidiabetic drugs |
49 (9.6) |
33 (13.5) |
16 (6.0) |
0.284 |
| Antidyslipidemic drugs |
116 (22.7) |
46 (18.9) |
70 (26.2) |
0.047 |
| Antihyperuricemic drugs |
7 (1.4) |
6 (2.5) |
1 (0.4) |
0.079 |
| Biochemical data |
|
|
|
|
| AST (IU/L) |
23 (20–27) |
24 (20–28) |
22 (19–26) |
0.001 |
| ALT (IU/L) |
18 (14–24) |
22 (16–27) |
16 (14–21) |
<0.001 |
| γGTP (IU/L) |
21 (16–33) |
28 (20–40) |
18 (14–25) |
<0.001 |
| Blood urea nitrogen (mg/dL) |
16 ± 5 |
17 ± 5 |
15 ± 4 |
<0.001 |
| Creatinine (mg/dL) |
0.8 (0.7–0.9) |
0.9 (0.8–1.0) |
0.7 (0.6–0.8) |
<0.001 |
| eGFR (mL/min/1.73 m2) |
66 ± 14 |
68 ± 15 |
65 ± 13 |
0.012 |
| Uric acid (mg/dL) |
5.4 ± 1.3 |
6.0 ± 1.2 |
4.8 ± 1.1 |
<0.001 |
| Total cholesterol (mg/dL) |
209 ± 36 |
199 ± 34 |
218 ± 37 |
<0.001 |
| LDL cholesterol (mg/dL) |
124 ± 31 |
117 ± 29 |
130 ± 32 |
<0.001 |
| HDL cholesterol (mg/dL) |
63 ± 18 |
57 ± 15 |
68 ± 19 |
<0.001 |
| Triglycerides (mg/dL) |
91 (66–123) |
94 (68–144) |
86 (65–114) |
0.013 |
| Fasting glucose (mg/dL) |
94 (87–104) |
95 (89–108) |
92 (85–99) |
<0.001 |
| Insulin (μU/mL) |
1.2 (0.6–2.3) |
1.3 (0.5–2.4) |
1.1 (0.6–2.1) |
0.404 |
| HOMA-IR |
0.28 (0.13–0.55) |
0.31 (0.13–0.60) |
0.25 (0.13–0.50) |
0.184 |
| HbA1c (%) |
5.5 (5.3–5.8) |
5.5 (5.3–5.9) |
5.5 (5.3–5.7) |
0.500 |
| XOR (pmol/h/mL plasma) |
36 (22–66) |
43 (24–85) |
33 (21–52) |
<0.001 |
Variables are expressed as number (%), means ± SD or medians (interquartile ranges).
AST, Aspartate transaminase; ALT, Alanine transaminase; eGFR, estimated glomerular filtration rate; γGTP, γ-glutamyl transpeptidase; HOMA-IR, homeostasis model assessment of insulin resistance; XOR, xanthine oxidoreductase.
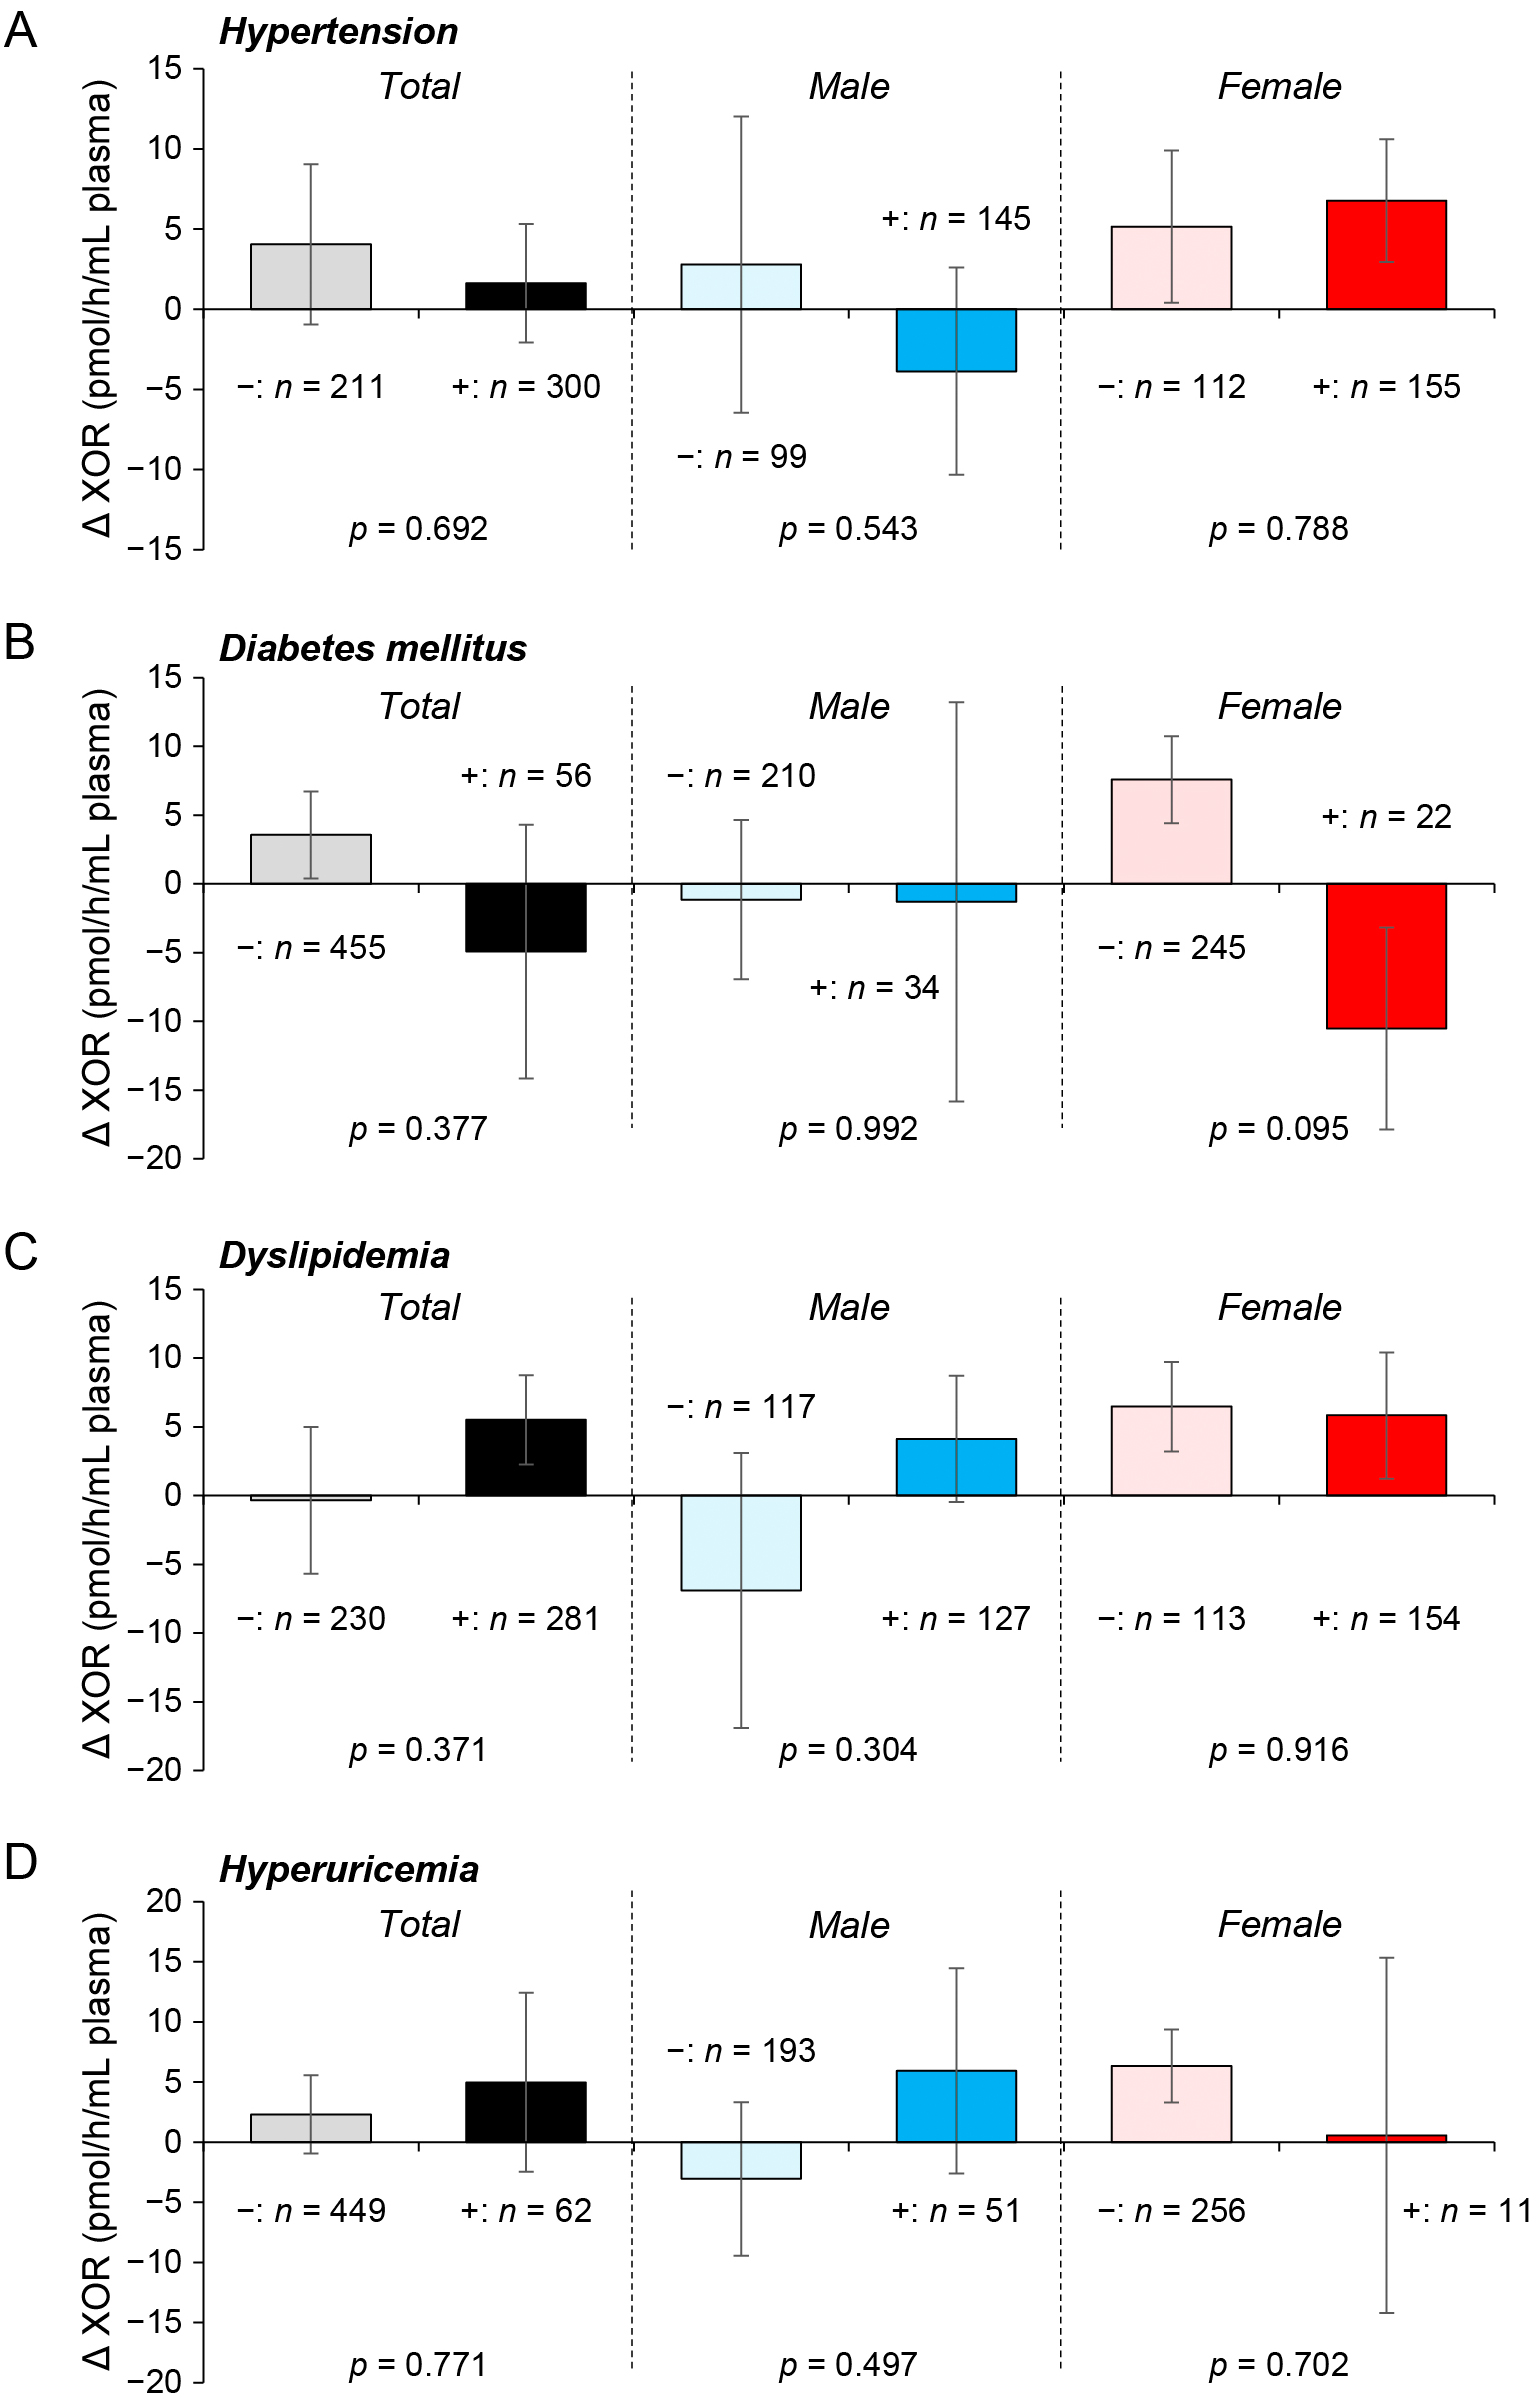
There was no significant sex difference in the annual change of each parameter except LDL cholesterol (Table 2). No significant difference was observed between annual changes in plasma activities of XOR in participants with and those without habits of smoking (Fig. 1A) and alcohol drinking (Fig. 1B) or those in subjects with and those without each disease, including hypertension (Fig. 2A), diabetes mellitus (Fig. 2B), dyslipidemia (Fig. 2C) and hyperuricemia (Fig. 2D).
Table 2
Annual change of parameters
|
Total (n = 511) |
Male (n = 244) |
Female (n = 267) |
p |
| Δ Body weight (kg) |
–0.1 ± 2.1 |
–0.1 ± 4.4 |
–0.2 ± 1.9 |
0.881 |
| Δ Body mass index (kg/m2) |
–0.1 ± 0.9 |
–0.1 ± 0.9 |
–0.1 ± 0.8 |
0.658 |
| Δ Waist circumference (cm) |
–0.6 ± 5.0 |
–0.3 ± 4.4 |
–0.9 ± 5.5 |
0.171 |
| Δ Systolic blood pressure (mmHg) |
3 ± 15 |
2 ± 15 |
3 ± 15 |
0.847 |
| Δ Diastolic blood pressure (mmHg) |
1 ± 8 |
1 ± 8 |
1 ± 8 |
0.598 |
| Δ AST (IU/L) |
0.8 ± 6.4 |
0.3 ± 8.0 |
1.2 ± 4.6 |
0.119 |
| Δ ALT (IU/L) |
0.5 ± 9.0 |
0.1 ± 11.2 |
0.8 ± 6.2 |
0.319 |
| Δ γGTP (IU/L) |
1.2 ± 13.0 |
1.7 ± 15.1 |
0.7 ± 10.8 |
0.393 |
| Δ Blood urea nitrogen (mg/dL) |
–0.4 ± 3.5 |
–0.4 ± 3.7 |
–0.4 ± 3.2 |
0.960 |
| Δ Creatinine (mg/dL) |
–0.001 ± 0.092 |
0.001 ± 0.120 |
–0.003 ± 0.056 |
0.650 |
| Δ eGFR (mL/min/1.73 m2) |
–0.02 ± 5.75 |
0.06 ± 6.15 |
–0.10 ± 5.35 |
0.747 |
| Δ Uric acid (mg/dL) |
–0.03 ± 0.74 |
–0.04 ± 0.87 |
–0.02 ±0.59 |
0.699 |
| Δ Total cholesterol (mg/dL) |
–2 ± 23 |
–0.2 ± 21 |
–4 ± 25 |
0.077 |
| Δ LDL cholesterol (mg/dL) |
–5 ± 22 |
–2 ± 19 |
–7 ± 24 |
0.025 |
| Δ HDL cholesterol (mg/dL) |
3 ± 8 |
3 ± 7 |
2 ± 8 |
0.352 |
| Δ Triglycerides (mg/dL) |
–2 ± 80 |
–3 ± 104 |
1 ± 48 |
0.723 |
| Δ Fasting glucose (mg/dL) |
1 ± 12 |
1 ± 12 |
1 ± 11 |
0.610 |
| Δ Insulin (μU/mL) |
4 ± 5 |
5 ± 6 |
4 ± 4 |
0.215 |
| Δ HOMA-IR |
–0.02 ± 0.43 |
–0.04 ± 0.47 |
–0.01 ± 0.40 |
0.461 |
| Δ HbA1c (%) |
0.05 ± 0.23 |
0.06 ± 0.29 |
0.05 ± 0.16 |
0.502 |
| Δ XOR (pmol/h/mL plasma) |
2.6 ± 67.7 |
–1.2 ± 83.6 |
6.1 ± 48.7 |
0.226 |
Variables are means ± SD.
Δ, annual change calculated as parameter in 2017 minus that in 2016.
AST, Aspartate transaminase; ALT, Alanine transaminase; eGFR, estimated glomerular filtration rate; γGTP, γ-glutamyl transpeptidase; HOMA-IR, homeostasis model assessment of insulin resistance; XOR, xanthine oxidoreductase.

As shown in Table 3, annual change in plasma activity of XOR was positively correlated with annual change in each parameter, including body weight (Fig. 3A), BMI, diastolic blood pressure, AST (Fig. 3B), ALT (Fig. 3C), γGTP, uric acid (Fig. 3D), triglycerides (Fig. 3E), total cholesterol, fasting glucose and HbA1c (Fig. 3F). Similar correlations between the parameters except changes in diastolic blood pressure, uric acid, total cholesterol, fasting glucose and HbA1c were observed when sex was separately analyzed (Table 3).
Table 3
Correlation analysis for Δ XOR
|
Total (n = 511) |
Male (n = 244) |
Female (n = 267) |
| r |
p |
r |
p |
r |
p |
| Age at baseline |
–0.076 |
0.085 |
–0.141 |
0.027 |
0.018 |
0.776 |
| Δ Body weight |
0.203 |
<0.001 |
0.233 |
<0.001 |
0.149 |
0.015 |
| Δ Body mass index |
0.192 |
<0.001 |
0.231 |
<0.001 |
0.146 |
0.017 |
| Δ Waist circumference |
0.079 |
0.075 |
0.150 |
0.019 |
0.009 |
0.890 |
| Δ Systolic blood pressure |
0.021 |
0.642 |
0.001 |
0.985 |
0.051 |
0.403 |
| Δ Diastolic blood pressure |
0.109 |
0.014 |
0.179 |
0.005 |
0.010 |
0.875 |
| Δ AST |
0.772 |
<0.001 |
0.815 |
<0.001 |
0.654 |
<0.001 |
| Δ ALT |
0.647 |
<0.001 |
0.654 |
<0.001 |
0.652 |
<0.001 |
| Δ γGTP |
0.282 |
<0.001 |
0.293 |
<0.001 |
0.271 |
<0.001 |
| Δ Blood urea nitrogen |
0.011 |
0.808 |
0.031 |
0.634 |
–0.025 |
0.689 |
| Δ Creatinine |
–0.059 |
0.181 |
–0.058 |
0.366 |
–0.060 |
0.330 |
| Δ eGFR |
0.082 |
0.065 |
0.084 |
0.189 |
0.084 |
0.172 |
| Δ Uric acid |
0.091 |
0.041 |
0.088 |
0.171 |
0.095 |
0.123 |
| Δ Total cholesterol |
0.100 |
0.023 |
0.155 |
0.016 |
0.050 |
0.414 |
| Δ LDL cholesterol |
–0.001 |
0.983 |
0.003 |
0.962 |
0.007 |
0.911 |
| Δ HDL cholesterol |
–0.048 |
0.277 |
–0.024 |
0.710 |
–0.084 |
0.171 |
| Δ Triglycerides |
0.210 |
<0.001 |
0.214 |
0.001 |
0.198 |
0.001 |
| Δ Fasting glucose |
0.119 |
0.007 |
0.129 |
0.045 |
0.116 |
0.059 |
| Δ Insulin |
0.033 |
0.571 |
0.038 |
0.646 |
0.037 |
0.641 |
| Δ HOMA-IR |
0.057 |
0.323 |
0.064 |
0.440 |
0.037 |
0.645 |
| Δ HbA1c |
0.120 |
0.007 |
0.135 |
0.035 |
0.083 |
0.174 |
Δ, annual change calculated as parameter in 2017 minus that in 2016.
AST, aspartate transaminase; ALT, alanine transaminase; eGFR, estimated glomerular filtration rate; γGTP, γ-glutamyl transpeptidase; HOMA-IR, homeostasis model assessment of insulin resistance; XOR, xanthine oxidoreductase.
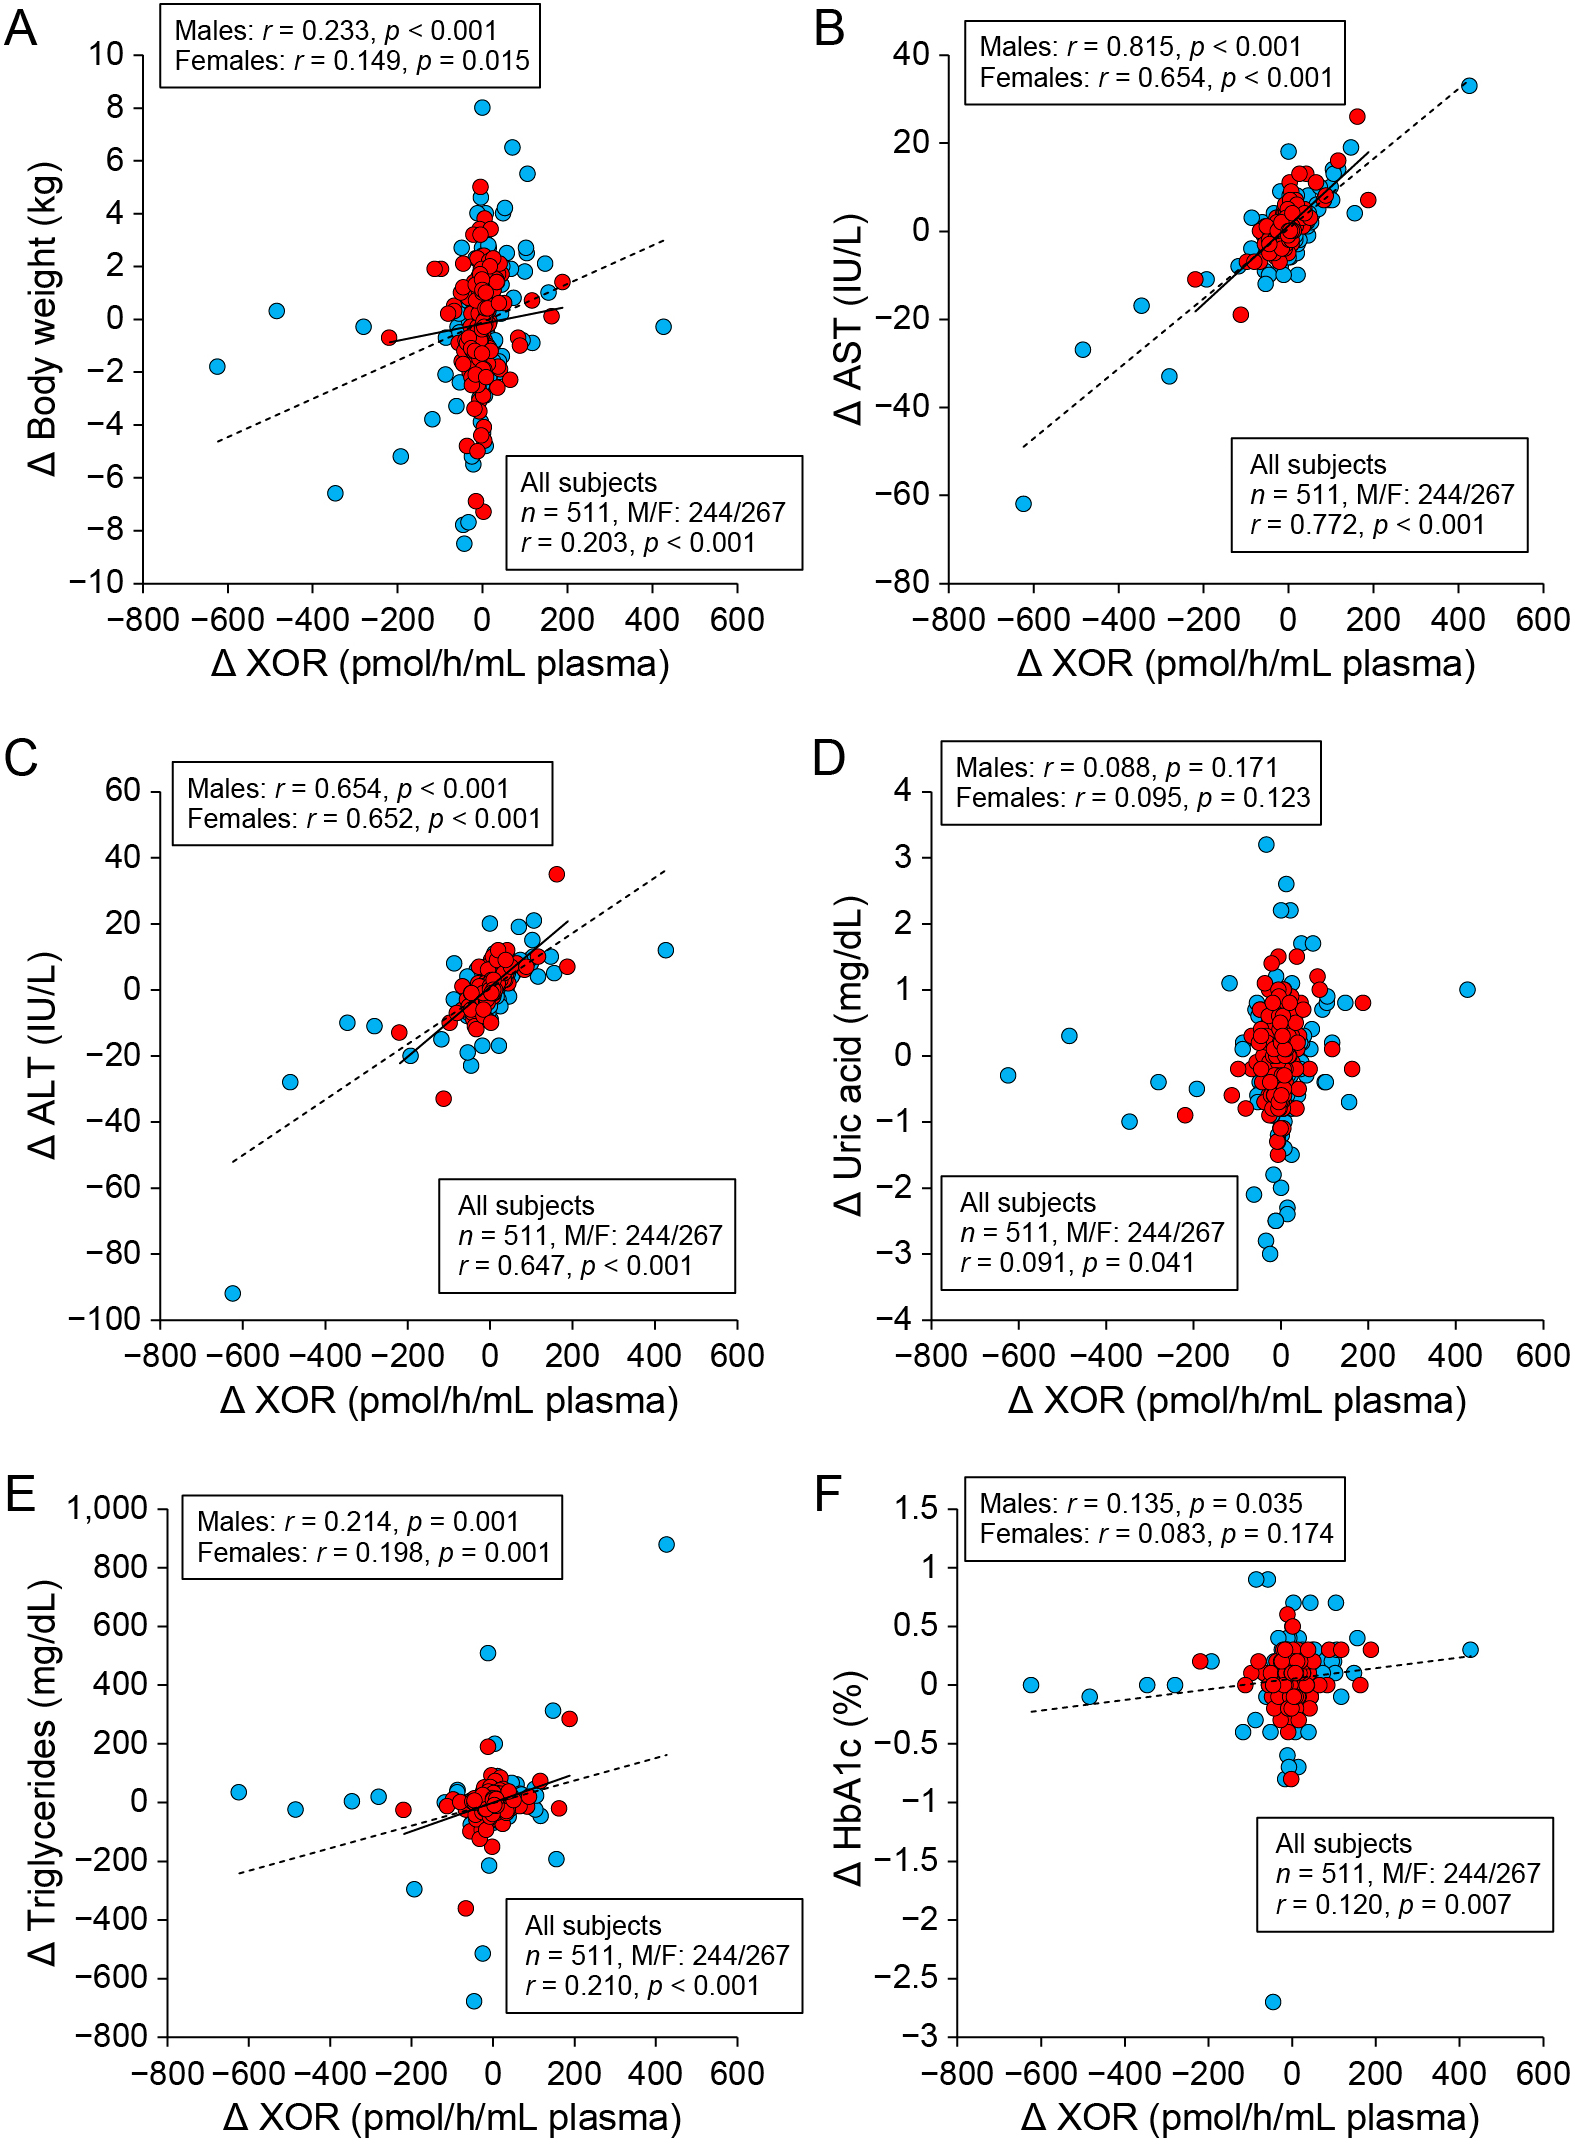
After consideration of multicollinearity of possible independent predictors, multivariate regression analysis for annual change in plasma XOR activity using age, sex and annual change in each parameter, including body weight, diastolic blood pressure, AST, uric acid, triglycerides and HbA1c, as possible determinants showed that annual change in body weight (β = 0.090, p = 0.002) and that in AST (β = 0.747, p < 0.001) were independently associated with annual change in plasma activity of XOR (R2 = 0.611) (Table 4).
Table 4
Multivariate regression analysis for Δ XOR
|
Regression coefficient |
SE |
Standardized regression coefficient (β) |
t |
p |
| Age |
–0.037 |
0.138 |
–0.008 |
–0.27 |
0.788 |
| Sex (Male) |
–0.251 |
3.789 |
0.002 |
0.07 |
0.947 |
| Δ Body weight |
2.844 |
0.928 |
0.090 |
3.06 |
0.002 |
| Δ Diastolic blood pressure |
0.103 |
0.239 |
0.012 |
0.43 |
0.667 |
| Δ AST |
7.842 |
0.302 |
0.747 |
25.94 |
<0.001 |
| Δ Uric acid |
4.181 |
2.570 |
0.045 |
1.63 |
0.104 |
| Δ Triglycerides |
0.042 |
0.025 |
0.049 |
1.64 |
0.102 |
| Δ HbA1c |
0.213 |
8.854 |
0.001 |
0.02 |
0.981 |
R2 = 0.611
Δ, annual change calculated as parameter in 2017 minus that in 2016.
AST, aspartate transaminase; XOR, xanthine oxidoreductase.
Discussion
The present study demonstrated for the first time that annual change in plasma activity of XOR is independently associated with change in AST, a liver enzyme, (β = 0.747, p < 0.001) and that in body weight (β = 0.090, p = 0.002) in a general population. XOR is highly expressed as the XDH form in the liver and converts to the XO form after leaking into the blood [2, 11]. XO is shed by the liver in the absence of cell damage and is leaked into plasma [3]. Therefore, XOR released from the liver mainly may contribute to the main source of the activity. In fact, we previously showed strong correlations of plasma XOR activity with liver enzymes, including AST (r = 0.586), ALT (r = 0.694) and γGTP (r = 0.432), in subjects of a general Japanese population (n = 627) [7]. Modulation of liver dysfunction may strongly regulate plasma XOR activity, leading to fluctuation of XOR-related oxidative stress.
It has been reported that XOR is abundantly expressed in fat tissue of rodent models, and uric acid formation can be enhanced in obesity-mediated insulin resistance [12]. In our previous study (n = 627), plasma activity of XOR was positively and independently correlated with BMI [7]. However, it has recently been reported that hypoxanthine, but not uric acid, is secreted from human adipose tissue, especially under a hypoxia condition [13]. Furthermore, XOR activity in human adipose tissue was much lower than that in mouse adipose tissue and that in the mouse liver [13]. These findings suggest that human adipose tissue can be a source of hypoxanthine as a substrate of XOR, but not a source of XOR itself, in the purine metabolism pathway. Change in body weight may be indirectly associated with change in plasma XOR activity through modulation of hypoxanthine secretion from adipose tissue as a substrate of XOR.
Other than liver dysfunction and obesity, plasma activity of XOR is associated with a habit of smoking and the presence of lifestyle-related diseases, including hyperuricemia, hypertension, dyslipidemia and diabetes mellitus [6-9]. However, in the present study, no significant difference was observed between annual changes in plasma XOR activities in participants with and those without a habit of smoking (Fig. 1A) or in subjects with and those without each disease, including hypertension, diabetes mellitus, dyslipidemia and hyperuricemia (Fig. 2A–D). Interventional studies of drugs for lifestyle diseases or secession of smoking using a large number of patients are needed to clarify what underlies the relationship between change in plasma activity of XOR and modulations of diseases and habits.
Previous studies showed that lowering uric acid level improved cardiovascular outcomes [14-17]. However, lowering uric acid level does not always decrease cardiovascular events [18-20] or renal dysfunction [21]. On the other hand, it has recently been shown that activation of XOR in plasma and/or tissue is associated with incidences of cardiovascular events, heart failure and kidney dysfunction [3, 22, 23]. Inhibition of XOR activity by XOR inhibitors in animal models reduced superoxide-induced tissue injury and improved cardiovascular and renal outcomes [24, 25]. Furthermore, treatment with high-dose allopurinol was reported to improve function of endothelial cells by lowering oxidative stress in vasculature but not by reducing uric acid level in humans [26]. We previously demonstrated that some hyperuricemic patients with an XOR inhibitor still had high plasma XOR activities independently of uric acid levels, indicating a resistant to an XOR inhibitor [7]. Those subjects were being treated for diabetes mellitus and/or had obesity and liver dysfunction. Additionally, plasma XOR activities have been reported to be unexpectedly high in some female subjects with less than 4.0 mg/dL of uric acid, who had insulin resistance and/or liver dysfunction [27]. These findings indicate the possible significance of lowering plasma activity of XOR but not only lowering uric acid level. Rather than reducing uric acid level, inhibiting plasma XOR activity could be a novel therapeutic strategy for cardiovascular and metabolic diseases. It is possible that modulations of liver function and body weight contribute to the prognosis of XOR-mediated cardiovascular and metabolic diseases.
This study has several limitations. First, it is unclear whether the results are similar to other ethnicities, since only Japanese subjects were recruited. Second, change in regular exercise and that in the number of cigarettes, which may affect plasma XOR activity, were not checked in this study. Lastly, values of plasma XOR activity measured in this study are not directly comparable to those measured using different methods due to lack of standardization of measurement of XOR activity.
In conclusion, annual change in plasma activity of XOR is independently associated with change in a liver enzyme and that in body weight in a general population. Improvement of liver function and reduction of body weight would decrease plasma XOR activity and its related oxidative stress as a therapeutic strategy.
Acknowledgements
Masato Furuhashi has been supported by a grant from Japan Society for the Promotion of Science (JSPS).
References
- 1 Nishino T, Okamoto K (2015) Mechanistic insights into xanthine oxidoreductase from development studies of candidate drugs to treat hyperuricemia and gout. J Biol Inorg Chem 20: 195–207.
- 2 Amaya Y, Yamazaki K, Sato M, Noda K, Nishino T, et al. (1990) Proteolytic conversion of xanthine dehydrogenase from the NAD-dependent type to the O2-dependent type. Amino acid sequence of rat liver xanthine dehydrogenase and identification of the cleavage sites of the enzyme protein during irreversible conversion by trypsin. J Biol Chem 265: 14170–14175.
- 3 Battelli MG, Bolognesi A, Polito L (2014) Pathophysiology of circulating xanthine oxidoreductase: new emerging roles for a multi-tasking enzyme. Biochim Biophys Acta 1842: 1502–1517.
- 4 Parks DA, Granger DN (1986) Xanthine oxidase: biochemistry, distribution and physiology. Acta Physiol Scand Suppl 548: 87–99.
- 5 Murase T, Nampei M, Oka M, Miyachi A, Nakamura T (2016) A highly sensitive assay of human plasma xanthine oxidoreductase activity using stable isotope-labeled xanthine and LC/TQMS. J Chromatogr B Analyt Technol Biomed Life Sci 1039: 51–58.
- 6 Washio KW, Kusunoki Y, Murase T, Nakamura T, Osugi K, et al. (2017) Xanthine oxidoreductase activity is correlated with insulin resistance and subclinical inflammation in young humans. Metabolism 70: 51–56.
- 7 Furuhashi M, Matsumoto M, Tanaka M, Moniwa N, Murase T, et al. (2018) Plasma xanthine oxidoreductase activity as a novel biomarker of metabolic disorders in a general population. Circ J 82: 1892–1899.
- 8 Furuhashi M, Matsumoto M, Murase T, Nakamura T, Higashiura Y, et al. (2018) Independent links between plasma xanthine oxidoreductase activity and levels of adipokines. J Diabetes Investig (in press).
- 9 Sunagawa S, Shirakura T, Hokama N, Kozuka C, Yonamine M, et al. (2019) Activity of xanthine oxidase in plasma correlates with indices of insulin resistance and liver dysfunction in patients with type 2 diabetes mellitus and metabolic syndrome: a pilot exploratory study. J Diabetes Investig 10: 94–103.
- 10 Kosaki K, Kamijo-Ikemori A, Sugaya T, Tanahashi K, Akazawa N, et al. (2018) Habitual exercise decreases plasma xanthine oxidoreductase activity in middle-aged and older women. J Clin Biochem Nutr 62: 247–253.
- 11 Battelli MG, Abbondanza A, Stirpe F (1992) Effects of hypoxia and ethanol on xanthine oxidase of isolated rat hepatocytes: conversion from D to O form and leakage from cells. Chem Biol Interact 83: 73–84.
- 12 Tsushima Y, Nishizawa H, Tochino Y, Nakatsuji H, Sekimoto R, et al. (2013) Uric acid secretion from adipose tissue and its increase in obesity. J Biol Chem 288: 27138–27149.
- 13 Nagao H, Nishizawa H, Tanaka Y, Fukata T, Mizushima T, et al. (2018) Hypoxanthine secretion from human adipose tissue and its increase in hypoxia. Obesity (Silver Spring) 26: 1168–1178.
- 14 Hare JM, Mangal B, Brown J, Fisher C Jr, Freudenberger R, et al. (2008) Impact of oxypurinol in patients with symptomatic heart failure. Results of the OPT-CHF study. J Am Coll Cardiol 51: 2301–2309.
- 15 Goicoechea M, de Vinuesa SG, Verdalles U, Ruiz-Caro C, Ampuero J, et al. (2010) Effect of allopurinol in chronic kidney disease progression and cardiovascular risk. Clin J Am Soc Nephrol 5: 1388–1393.
- 16 Wei L, Mackenzie IS, Chen Y, Struthers AD, MacDonald TM (2011) Impact of allopurinol use on urate concentration and cardiovascular outcome. Br J Clin Pharmacol 71: 600–607.
- 17 Goicoechea M, Garcia de Vinuesa S, Verdalles U, Verde E, Macias N, et al. (2015) Allopurinol and progression of CKD and cardiovascular events: long-term follow-up of a randomized clinical trial. Am J Kidney Dis 65: 543–549.
- 18 Nasr G, Maurice C (2010) Allopurinol and global left myocardial function in heart failure patients. J Cardiovasc Dis Res 1: 191–195.
- 19 Givertz MM, Anstrom KJ, Redfield MM, Deswal A, Haddad H, et al. (2015) Effects of xanthine oxidase inhibition in hyperuricemic heart failure patients: The Xanthine Oxidase Inhibition for Hyperuricemic Heart Failure Patients (EXACT-HF) Study. Circulation 131: 1763–1771.
- 20 Li X, Meng X, Timofeeva M, Tzoulaki I, Tsilidis KK, et al. (2017) Serum uric acid levels and multiple health outcomes: umbrella review of evidence from observational studies, randomised controlled trials, and Mendelian randomisation studies. BMJ 357: j2376.
- 21 Kimura K, Hosoya T, Uchida S, Inaba M, Makino H, et al. (2018) Febuxostat therapy for patients with stage 3 CKD and asymptomatic hyperuricemia: a randomized trial. Am J Kidney Dis 72: 798–810.
- 22 Otaki Y, Watanabe T, Kinoshita D, Yokoyama M, Takahashi T, et al. (2017) Association of plasma xanthine oxidoreductase activity with severity and clinical outcome in patients with chronic heart failure. Int J Cardiol 228: 151–157.
- 23 Gondouin B, Jourde-Chiche N, Sallee M, Dou L, Cerini C, et al. (2015) Plasma xanthine oxidase activity is predictive of cardiovascular disease in patients with chronic kidney disease, independently of uric acid levels. Nephron 131: 167–174.
- 24 Pacher P, Nivorozhkin A, Szabo C (2006) Therapeutic effects of xanthine oxidase inhibitors: renaissance half a century after the discovery of allopurinol. Pharmacol Rev 58: 87–114.
- 25 Nakamura T, Murase T, Nampei M, Morimoto N, Ashizawa N, et al. (2016) Effects of topiroxostat and febuxostat on urinary albumin excretion and plasma xanthine oxidoreductase activity in db/db mice. Eur J Pharmacol 780: 224–231.
- 26 George J, Carr E, Davies J, Belch JJ, Struthers A (2006) High-dose allopurinol improves endothelial function by profoundly reducing vascular oxidative stress and not by lowering uric acid. Circulation 114: 2508–2516.
- 27 Furuhashi M, Mori K, Tanaka M, Maeda T, Matsumoto M, et al. (2018) Unexpected high plasma xanthine oxidoreductase activity in female subjects with low levels of uric acid. Endocr J 65: 1083–1092.