ORIGINAL
An improved mouse model of Graves disease by once immunization with Ad-TSHR289
2019 年 66 巻 9 号 p. 827-835

詳細
2019 年 66 巻 9 号 p. 827-835
The novel Graves disease (GD) model was established in BALB/c mice with recombinant adenovirus expressing the full-length human TSHR (Ad-TSHR289) by three times immunizations for nearly three months. Reducing the frequency of immunizations may shorten the modeling time to improve the efficiency of the study. In this study, female BALB/c mice were immunized one time with an adenovirus expressing the autoantigen thyroid-stimulating hormone receptor (Ad-TSHR289). At the 3, 6, 12, 17 weeks after the immunization, mice were sacrificed. The blood was collected and thyroids were removed. T3, T4, TRAB and thyroid weight/body weight (TW/BW) were tested. Compared with the Normal control (NC) group, the incidence of hyperthyroidism at 3, 6, 12 and 17 weeks after immunization were about 66.67%, 100%, 100%, and 100%. Meanwhile, the incidences of goiter were nearly 50%, 83.33%, 100% and 100% at the same stages. Therefore, modeling rates of GD were about 50%, 83.33%, 100%, 100% at 3, 6, 12 and 17 weeks after immunization. T3 in serum continues to increase from 3 weeks to 17 weeks after immunization. Serum TRAb reached to peak at 6 weeks and remained from 12 weeks after immunization, while T4 and TW/BW had kept steady from 6 weeks. There are positive correlations between T3, T4 and TRAb, TRAb and TW/BW, as well as T3, T4 and TW/BW. GD model can be constructed by primary immunization with Ad-TSHR289, which could be detected at 3 weeks and at least until the 17 weeks after primary immunization. It would improve the efficiency of GD research.
GRAVES’ DISEASE (GD) is an autoimmune disease characterized by hyperthyroidism and goiter [1]. However, the pathogenesis of GD has not been fully revealed. A successful animal model would contribute to providing a useful tool to reveal the pathophysiology of the disease and develop a new therapy [2, 3]. While various approaches have been used to model human Graves’ disease, the novel GD model was established in BALB/c mice with recombinant adenovirus expressing the full-length human TSHR by three times immunizations in terms of reproducibility and disease incidence [4, 5]. It is generally believed that TSHR stimulating antibodies (TSAb) to stimulate the thyroidal epithelial cells to produce hormones through activation of cAMP signaling pathway [6].
In the recent two decades, some approaches for GD models with adenovirus have been demonstrated. Combining adenovirus with electroporation or Dentritic Cells (DCs) was more effective than before [7, 8]. What’s more, the rate of GD model could reach 70%–100% only using recombinant adenovirus expressing the full-length human TSHR [9, 10]. The GD model was also successfully tried by two-times immunizations [11]. However, animal models constructed by a single immunization was rarely reported. Would the incidence and duration decrease if we reduce the frequency of injection to shorten the time of GD model induced?
We have reported that the high incidence of hyperthyroidism by twice and three times immunizations before [10, 12]. In this study, we focus on reducing the time of GD model establishment by primary immunization and observe the incidence of hyperthyroidism and the changes of thyroids from the different times to determine the improved GD induced method.
Female BALB/c mice aged 6–8 weeks (weight 18–20 g) were purchased from Chinese Academy of Medical Sciences (Beijing, China) and housed in a specific pathogen-free environment in animal care facilities at Guang’anmen Hospital (Beijing, China). All experiments were conducted in accordance with the principles and procedures outlined in the Institutional Animal Care and Use Committee in Guang’anmen Hospital. They were randomly divided into two groups: n(GD) = 24, n(NC) = 24. The mice of GD group were injected with 2*109 particles of Ad-TSHR289 (construction of recombinant adenovirus by Donghua Fang Biological Co., Ltd. Beijing) per injection (in 100 μL PBS) only once according to the previous report [12]. The mice in control group were injected with 100 μL PBS (untreated). 6 mice in each group were sacrificed at the 3, 6, 12, 17 weeks after immunization (Fig. 1). The blood and thyroids were collected.
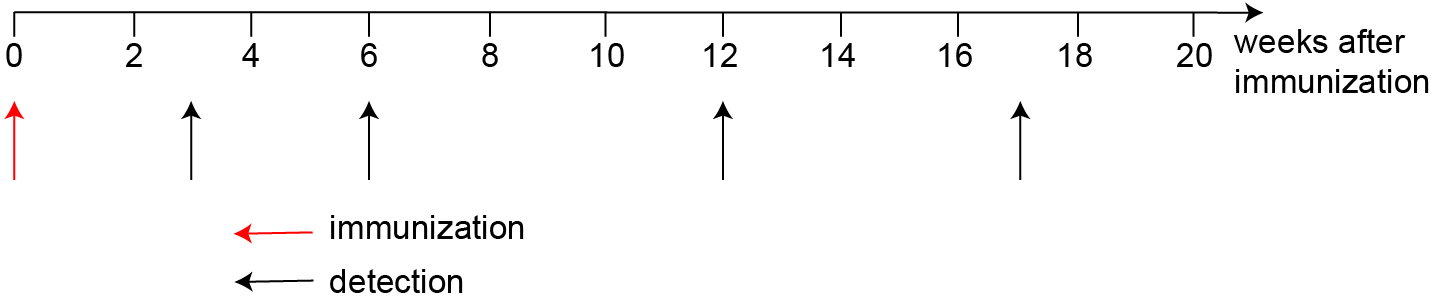
The time of immunization and detection. Thyroid functions and morphology were detected at 3, 6, 12, 17 weeks after primary immunization.
The level of serum T3 and T4 were measured using T3 and T4 kits (Siemens, Massachusetts, USA) by Immunoassay System (ADVIA centaur XP, Siemens, Dublin, Ireland) according to the instructions. The level of TRAb in serum was tested using the thyrotropin receptor antibody detection kit (Roche, Mannheim, Germany) by Modular Biochemical Immunoassay System (Cobas e 601, Roche, Mannheim, Germany).
Histological examination of the thyroid glandDissected thyroid glands were fixed. Microsurgical excision of the thyroid was performed, tissue fixed in buffered formalin and paraffin-embedded. Sections of 5 μm were then cut and stained using hematoxylin and eosin (H&E) thyroid glands. Sections were deparaffinized and stained in Weigert’s iron hematoxylin solution for 10 min.
Statistical analysisData were expressed as mean ± standard deviation (SD). Differences between the groups were analyzed by Student’s t-test for comparison. Multiple groups were performed with ANOVA followed by Fisher’s protected least-significant difference. Spearman analysis was used for intergroup comparisons. P values <0.05 represent significant differences. All statistical analyses were calculated using Graphpad Prism 7.0.
To determine the thyroid function and antibody of TSHR, we tested the total T3, T4 and TRAb in different times. At 3 weeks after immunization, mean ± SD of T3, T4, and TRAb in murine serum were 0.77 ± 0.05 ng/mL, 5.22 ± 0.71 ng/mL and 0.44 ± 0.35 U/L (TRAb less than 0.30 U/L calculated at 0.30 U/L) in the NC group. 4 of 6 mice serum T3 and 3 of 6 mice serum T4 in GD group were above the mean ± 3SD of NC group. All mice (6/6) in GD group were above the mean ± 3SD of NC group in TRAb assay. Thus, in all results, about 4 (66.67%) female BALB/c mice have been induced to develop hyperthyroidism (Fig. 2A).
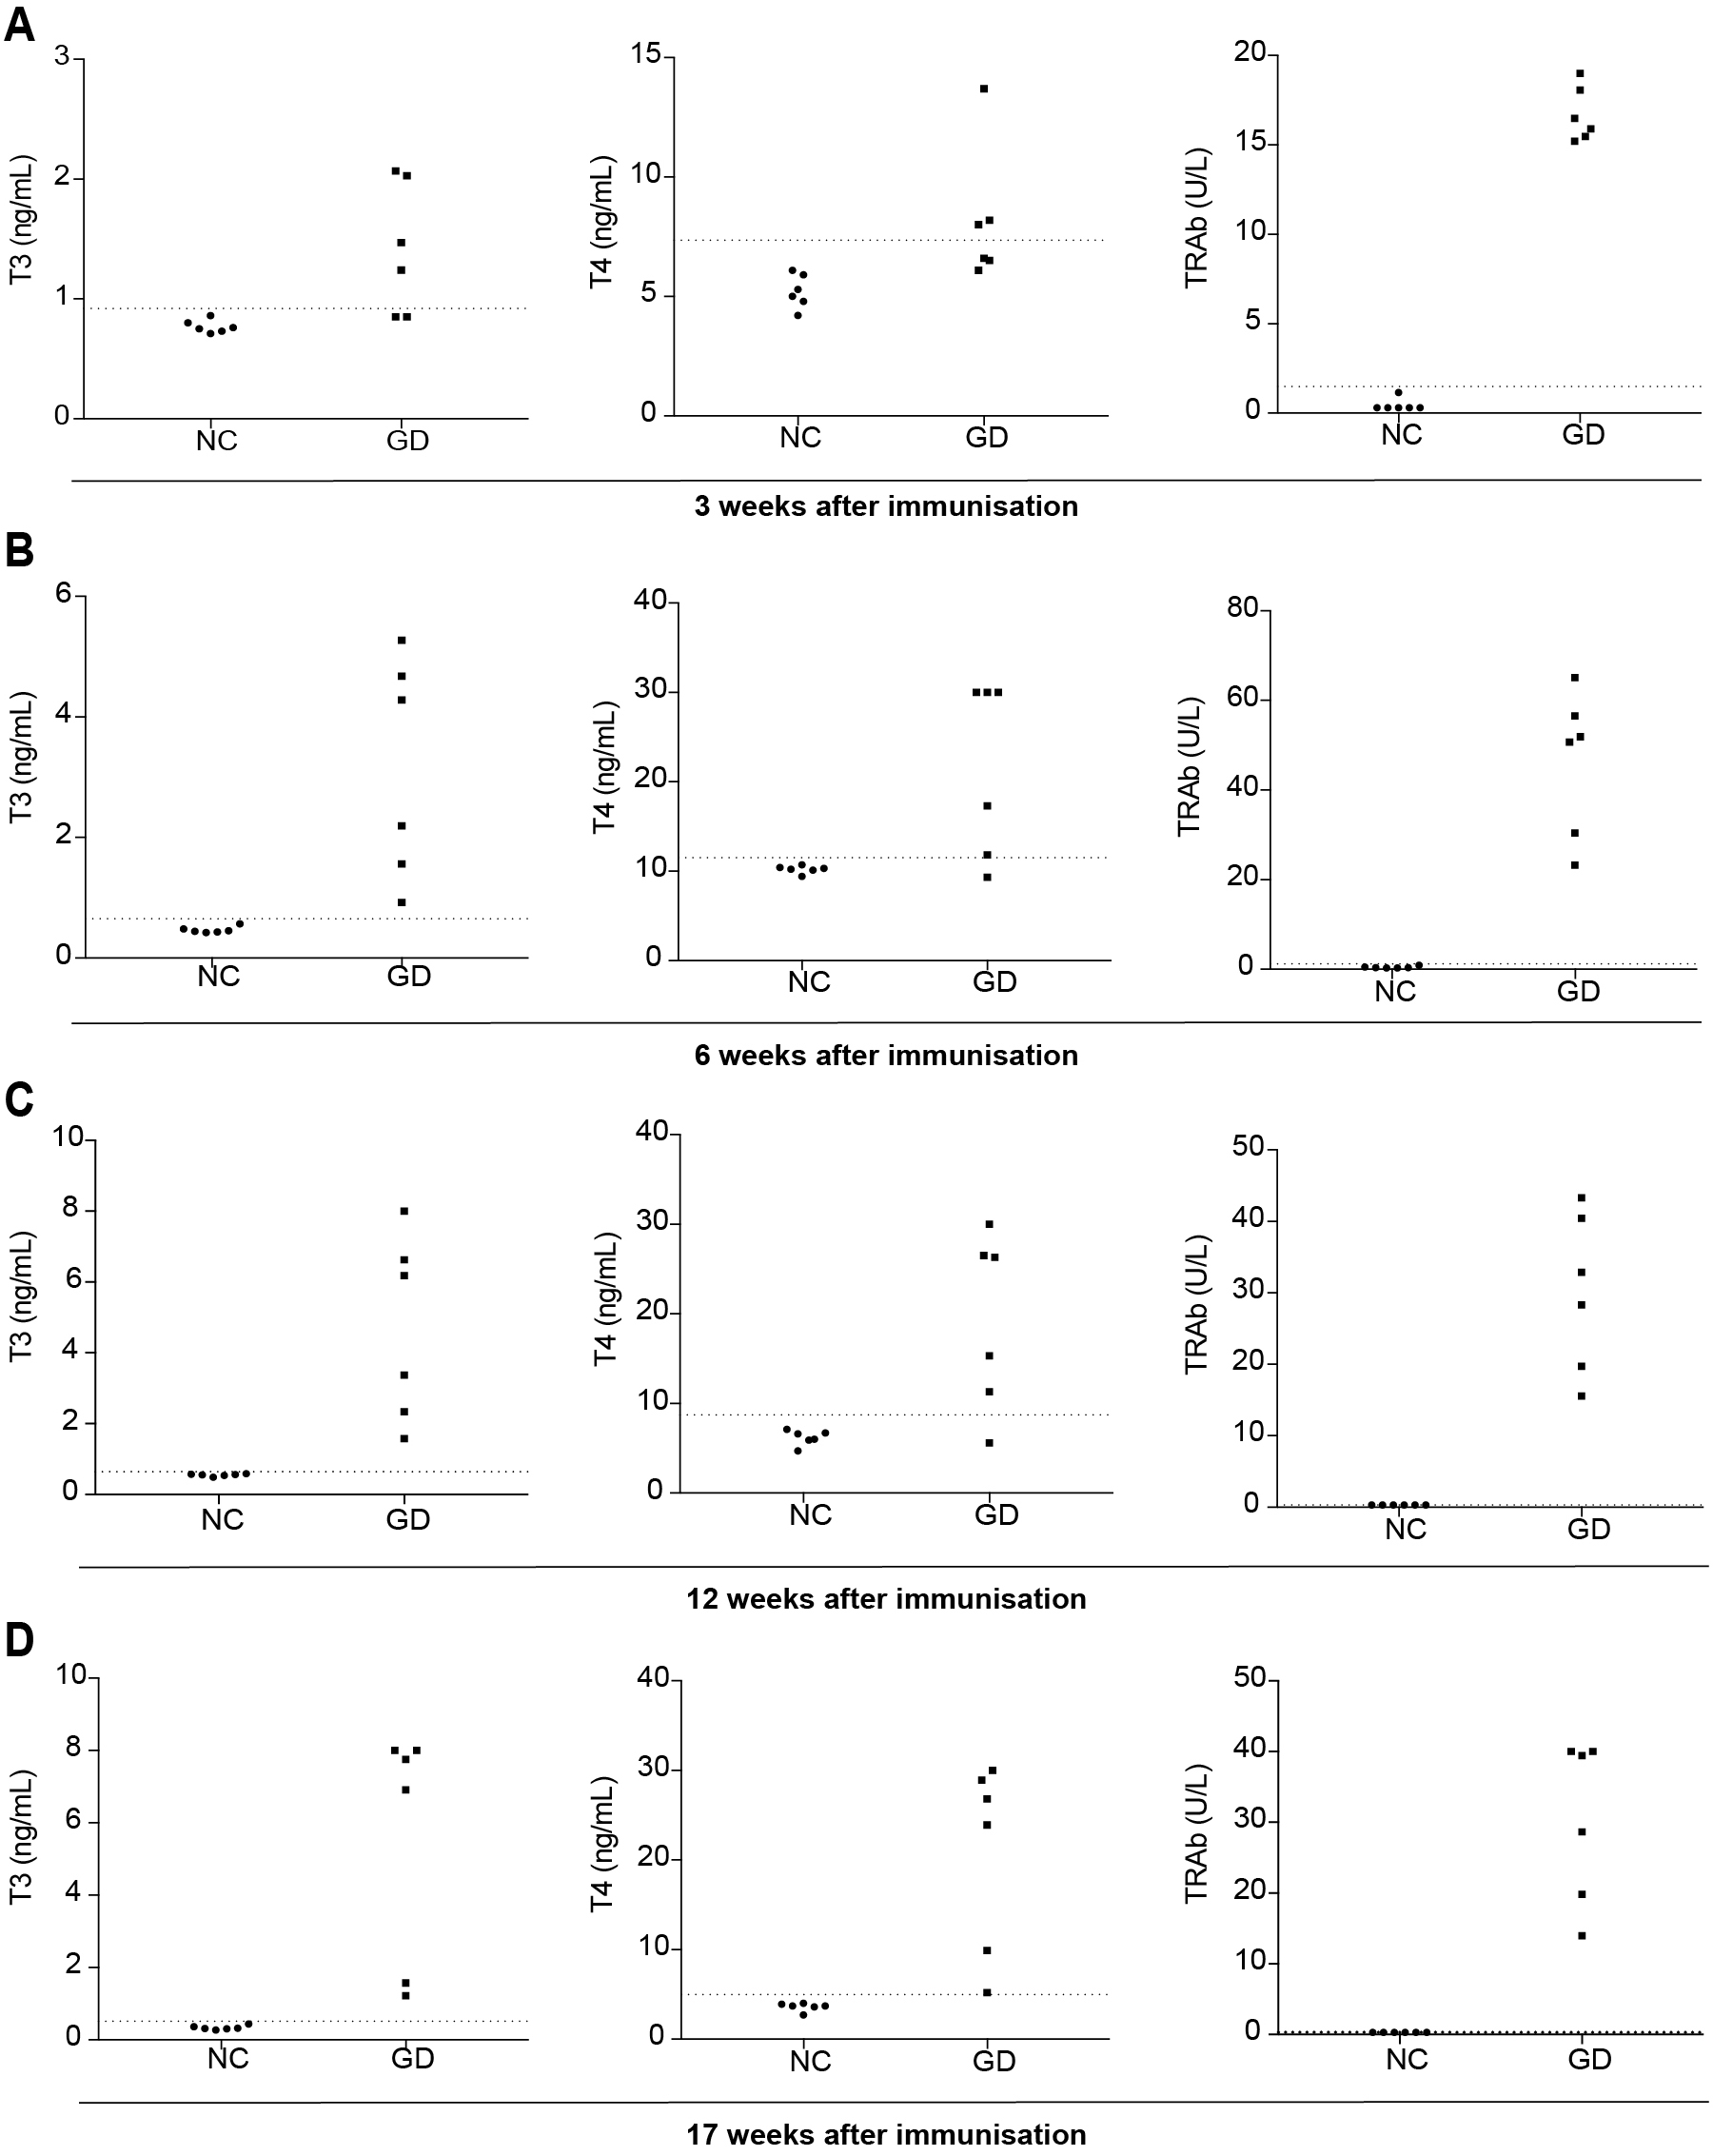
Serum T3, T4, and TRAb levels were measured at 3 (A), 6 (B), 12 (C), 17 (D) weeks after immunization. The area below the horizontal lines indicates the mean ± 3SD of T3, T4 and TRAb values for 6 mice in NC group.
At 6 weeks after immunization, mean ± SD of T3, T4 and TRAb in murine serum were 0.47 ± 0.06 ng/mL, 10.18 ± 0.44 ng/mL and 0.47 ± 0.24 U/L in the NC group. 6 of 6 mice serum T3 and 5 of 6 mice serum T4 in GD group were above the mean ± 3SD of NC group, with all mice (6/6) above the mean ± 3SD of NC group. Thus, in all results, about 6 (100%) female BALB/c mice have been induced to develop hyperthyroidism (Fig. 2B).
At 12 weeks after immunization, mean ± SD of T3, T4 and TRAb in murine serum were 0.55 ± 0.03 ng/mL, 6.17 ± 0.85 ng/mL and 0.30 ± 0.00 U/L in the NC group. 6 of 6 mice serum T3 and 5 of 6 mice serum T4 in GD group were above the mean ± 3SD of NC group, with all mice (6/6) above the mean ± 3SD of NC group. Thus, in all results, all (100%) female BALB/c mice have been induced to develop hyperthyroidism (Fig. 2C).
At 17 weeks after immunization, mean ± SD of T3, T4 and TRAb in murine serum were 0.33 ± 0.06 ng/mL, 3.60 ± 0.46 ng/mL and 0.30 ± 0.00 U/L in the NC group. All of mice serum T3, T4 and TRAb were above the mean ± 3SD of NC group. Thus, in all results, all (100%) female BALB/c mice have been induced to develop hyperthyroidism (Fig. 2D).
Thyroid histology in miceDifferences in the appearance of mice thyroid tissues in two groups were observed at different stages. Thyroid weight (TW) and body weight (BW), were measured and TW/BW was calculated. The thyroid tissues were stained by H&E.
At 3 weeks after immunization, there was no significant difference in thyroid tissue between the two groups from observing directly with a measuring scale. The TW/BW were 0.0002030 ± 0.0000394, and 0.0002577 ± 0.0000402 in NC and GD groups, respectively (p < 0.05) (Fig. 3A). Compared with NC group, thyroid tissues in GD group showed mild diffuse enlargement, proliferation of thyroidal follicular epithelial cells, accompanied by protuberance in follicular cavity and decrease of glia in follicular cavity (Fig. 4A).
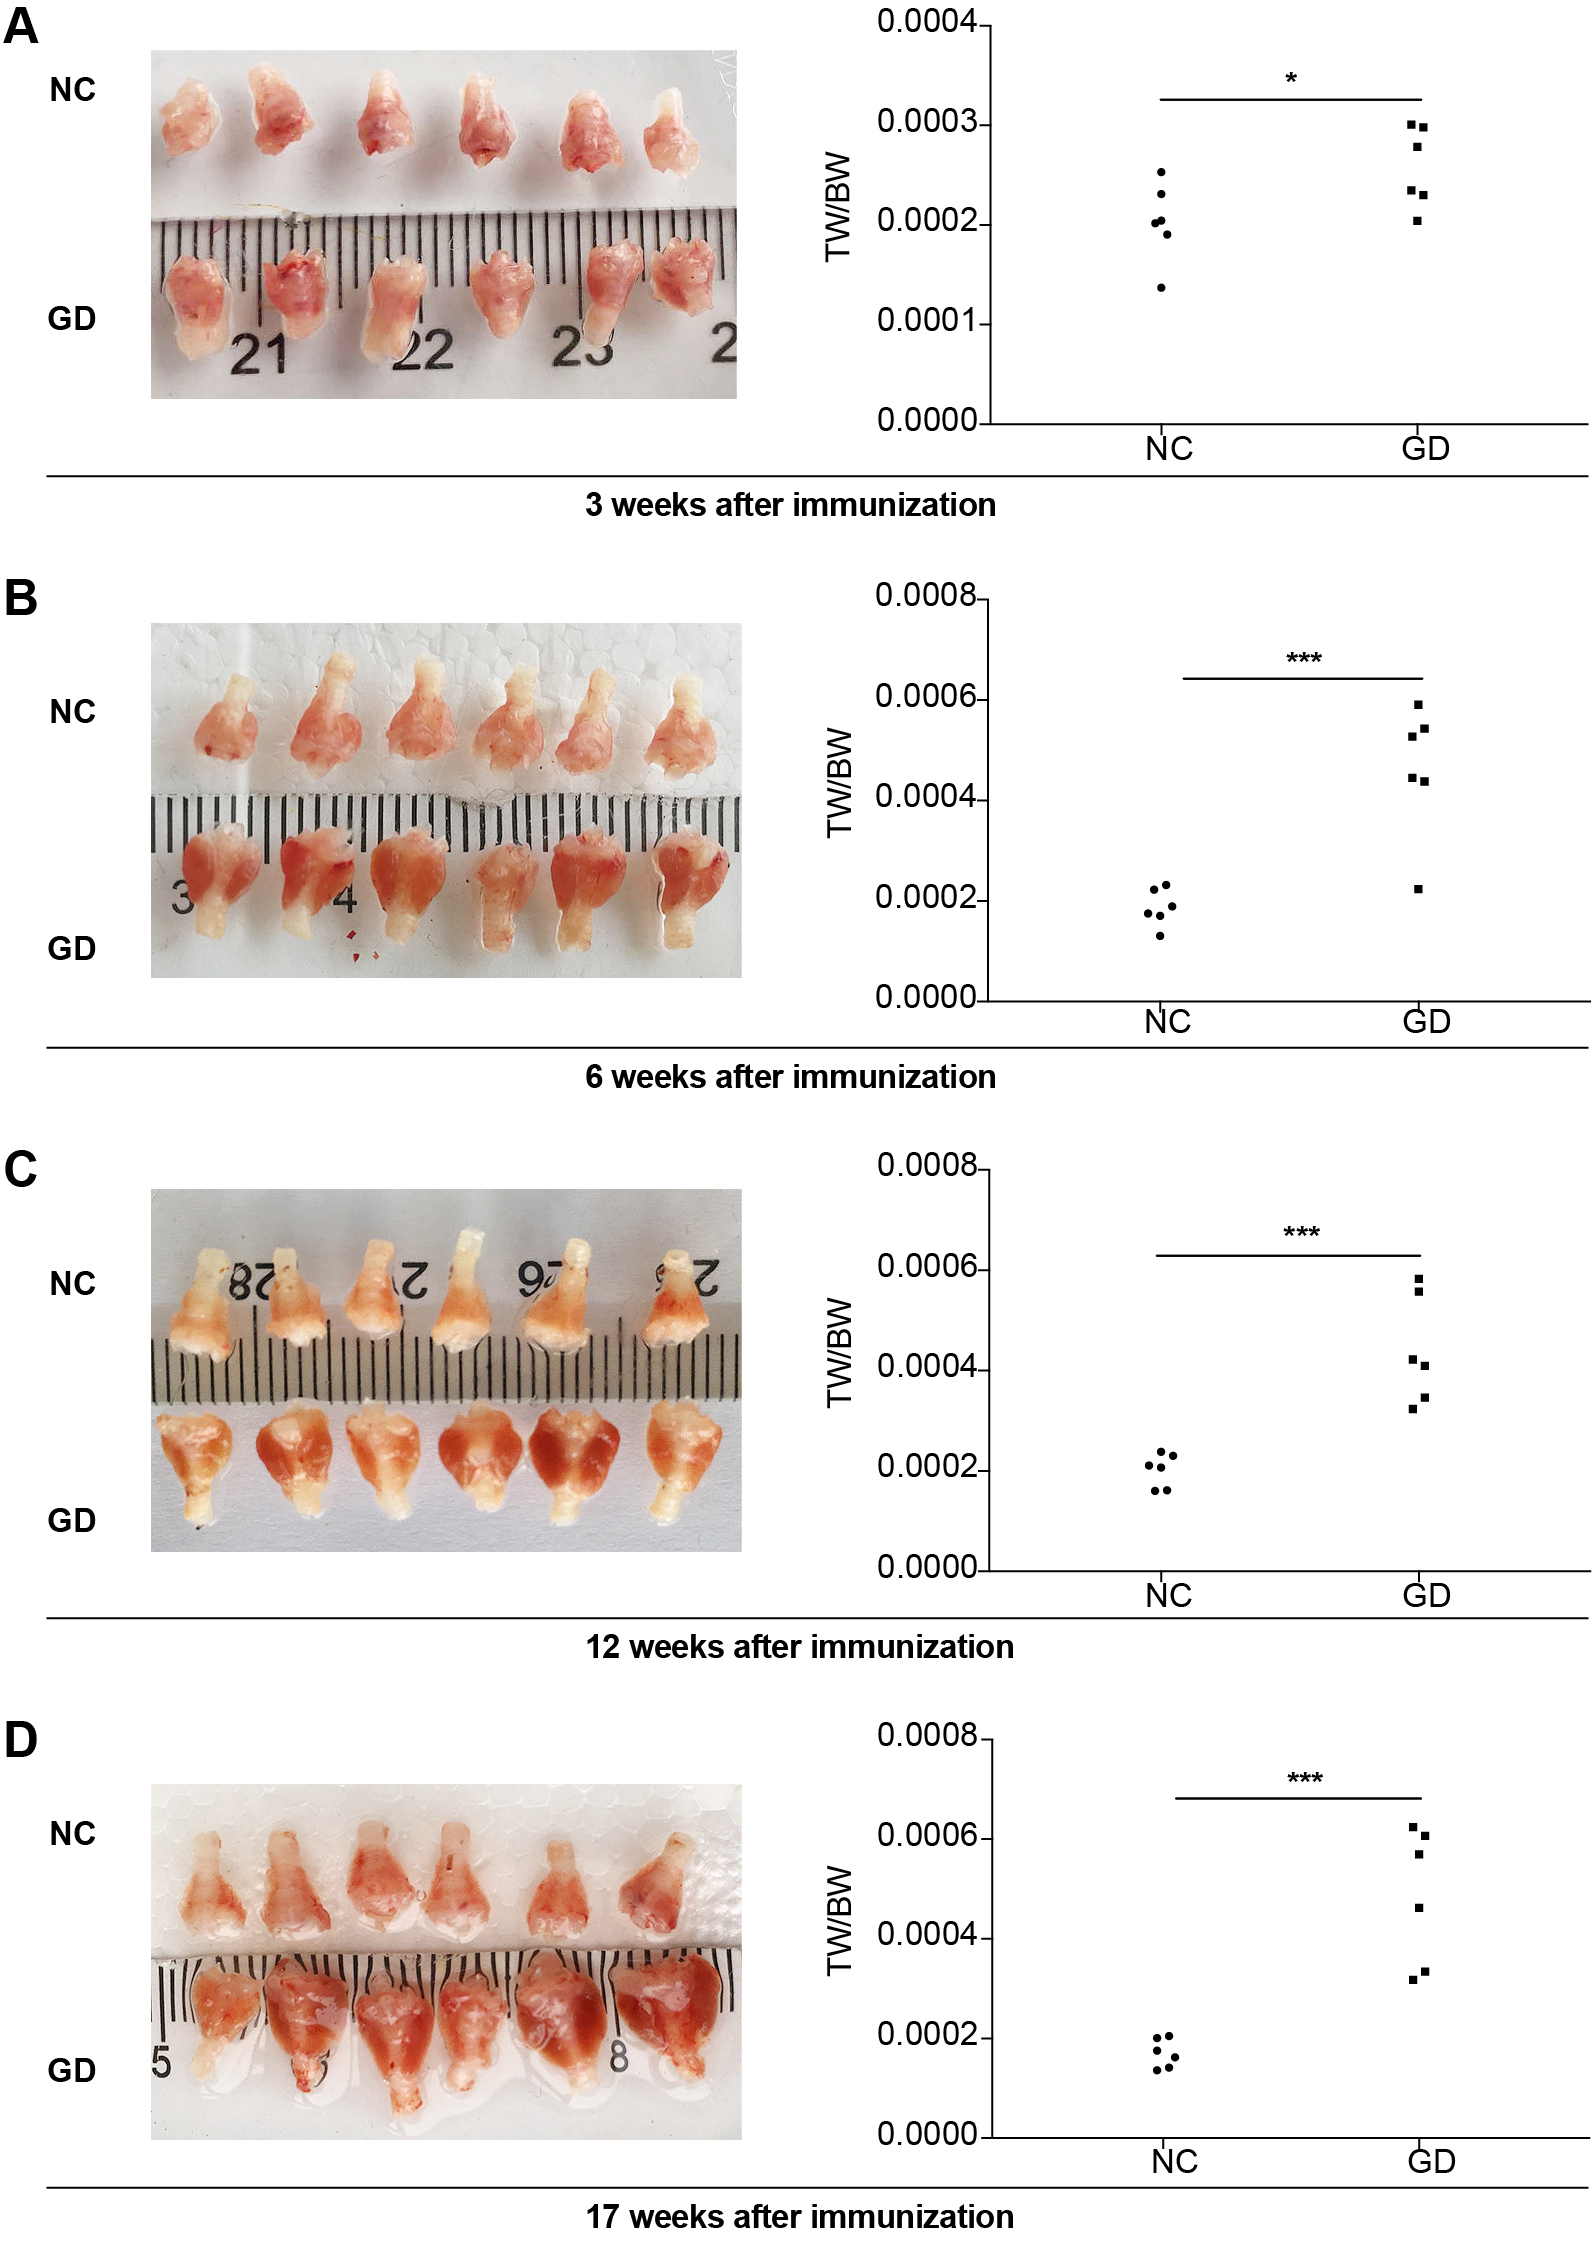
Images of thyroid and TW/BW of GD group and NC group in 3 (A), 6 (B), 12 (C) and 17 weeks (D) after immunization. (A) there was no significant difference in thyroid tissue between the two groups from observing directly with a measuring scale. The TW/BW were 0.0002030 ± 0.0000394, and 0.0002577 ± 0.0000402 in NC and GD groups, respectively (p < 0.05). (B) 5/6 thyroid tissues in GD group were darker and heavier than in NC group. The TW/BW was 0.0001871 ± 0.0000371 and 0.0004618 ± 0.0001304 in NC and GD groups, respectively (p < 0.001). (C) 6/6 thyroid tissues in GD group were darker and heavier than in NC group. The TW/BW was 0.0002015 ± 0.0000334 and 0.0004404 ± 0.0001076 in NC and GD groups (p < 0.001). (D) 6/6 thyroid tissues in GD group were darker and heavier than in NC group. The TW/BW was 0.0001703 ± 0.0000290 and 0.0004858 ± 0.0001360 in NC and GD groups (p < 0.001).

Histographs of thyroid observed by light microscope (Stained by H&E) (×200 magnification and ×400 magnification): (A) At 3 weeks after immunization: compared with NC group, thyroidal tissue in GD group showed mild diffuse enlargement, proliferation of thyroidal follicular epithelial cells, accompanied by protuberance in follicular cavity and decrease of glia in follicular cavity. At 6 (B), 12 (C), 17 (D) weeks after immunization: compared with NC group, the thyroid tissue of GD group was diffusely enlarged; the proliferation of thyroid follicular epithelial cells was significant, and there were obvious protuberances in follicular cavity.
At 6 weeks after immunization, 5/6 thyroid tissues in GD group were darker and heavier than in NC group. The TW/BW was 0.0001871 ± 0.0000371 and 0.0004618 ± 0.0001304 in NC and GD groups, respectively (p < 0.001) (Fig. 3B). Compared with NC group, the thyroid tissue of GD group was diffusely enlarged; the proliferation of thyroid follicular epithelial cells was significant, and there were obvious protuberances in follicular cavity (Fig. 4B).
At 12 weeks after immunization, 6/6 thyroid tissues in GD group were darker and heavier than in NC group. The TW/BW was 0.0002015 ± 0.0000334 and 0.0004404 ± 0.0001076 in NC and GD groups, respectively (p < 0.001) (Fig. 3C). Compared with NC group, the thyroid tissue of GD group was diffusely enlarged; the proliferation of thyroid follicular epithelial cells was significant, and there were obvious protuberances in follicular cavity (Fig. 4C).
At 17 weeks after immunization, 6/6 thyroid tissues in GD group were darker and heavier than in NC group. The TW/BW was 0.0001703 ± 0.0000290 and 0.0004858 ± 0.0001360 in NC and GD groups, respectively (p < 0.001) (Fig. 3D). Compared with NC group, the thyroid tissue of GD group was diffusely enlarged; the proliferation of thyroid follicular epithelial cells was significant, and there were obvious protuberances in follicular cavity (Fig. 4D).
Goiter is one of the characteristics of GD. It was found that the thyroid gland changed slightly at the 3 weeks after primary immunization, and the morphological changes of thyroid gland in GD group were obvious from the 6 weeks until the 17 weeks after immunization.
Trends of thyroid function and TW/BW in different periodsTo compare the changes of thyroid function and morphology from 3 weeks to 17 weeks after immunization, the trends of T3, T4, TRAb, and TW/BW were observed. The serum T3 level increased from 3 weeks to 17 weeks after immunization, but it did not increase significantly from 3 to 6 weeks, 6 to 12 weeks and 12 to 17 weeks after immunization (p > 0.05, res). There was a significant difference in serum between the 3 weeks and 12 weeks after immunization (p < 0.05) (Fig. 5A). The content of T4 in serum increased significantly from 3 weeks to 6 weeks after immunization (p < 0.05), but did not change significantly at the 6 weeks to 17 weeks after immunization (p > 0.05) (Fig. 5B). The changing trend of TRAb (Fig. 5C) in serum increased significantly from 3 weeks to 6 weeks after immunization (p < 0.001). It decreased significantly from 6 weeks to 12 weeks (p < 0.05). TW/BW (Fig. 5D) was consistent with T4. It was found that T3, T4, TRAb, and TW/BW remained at a high level at the 17 weeks after immunization.
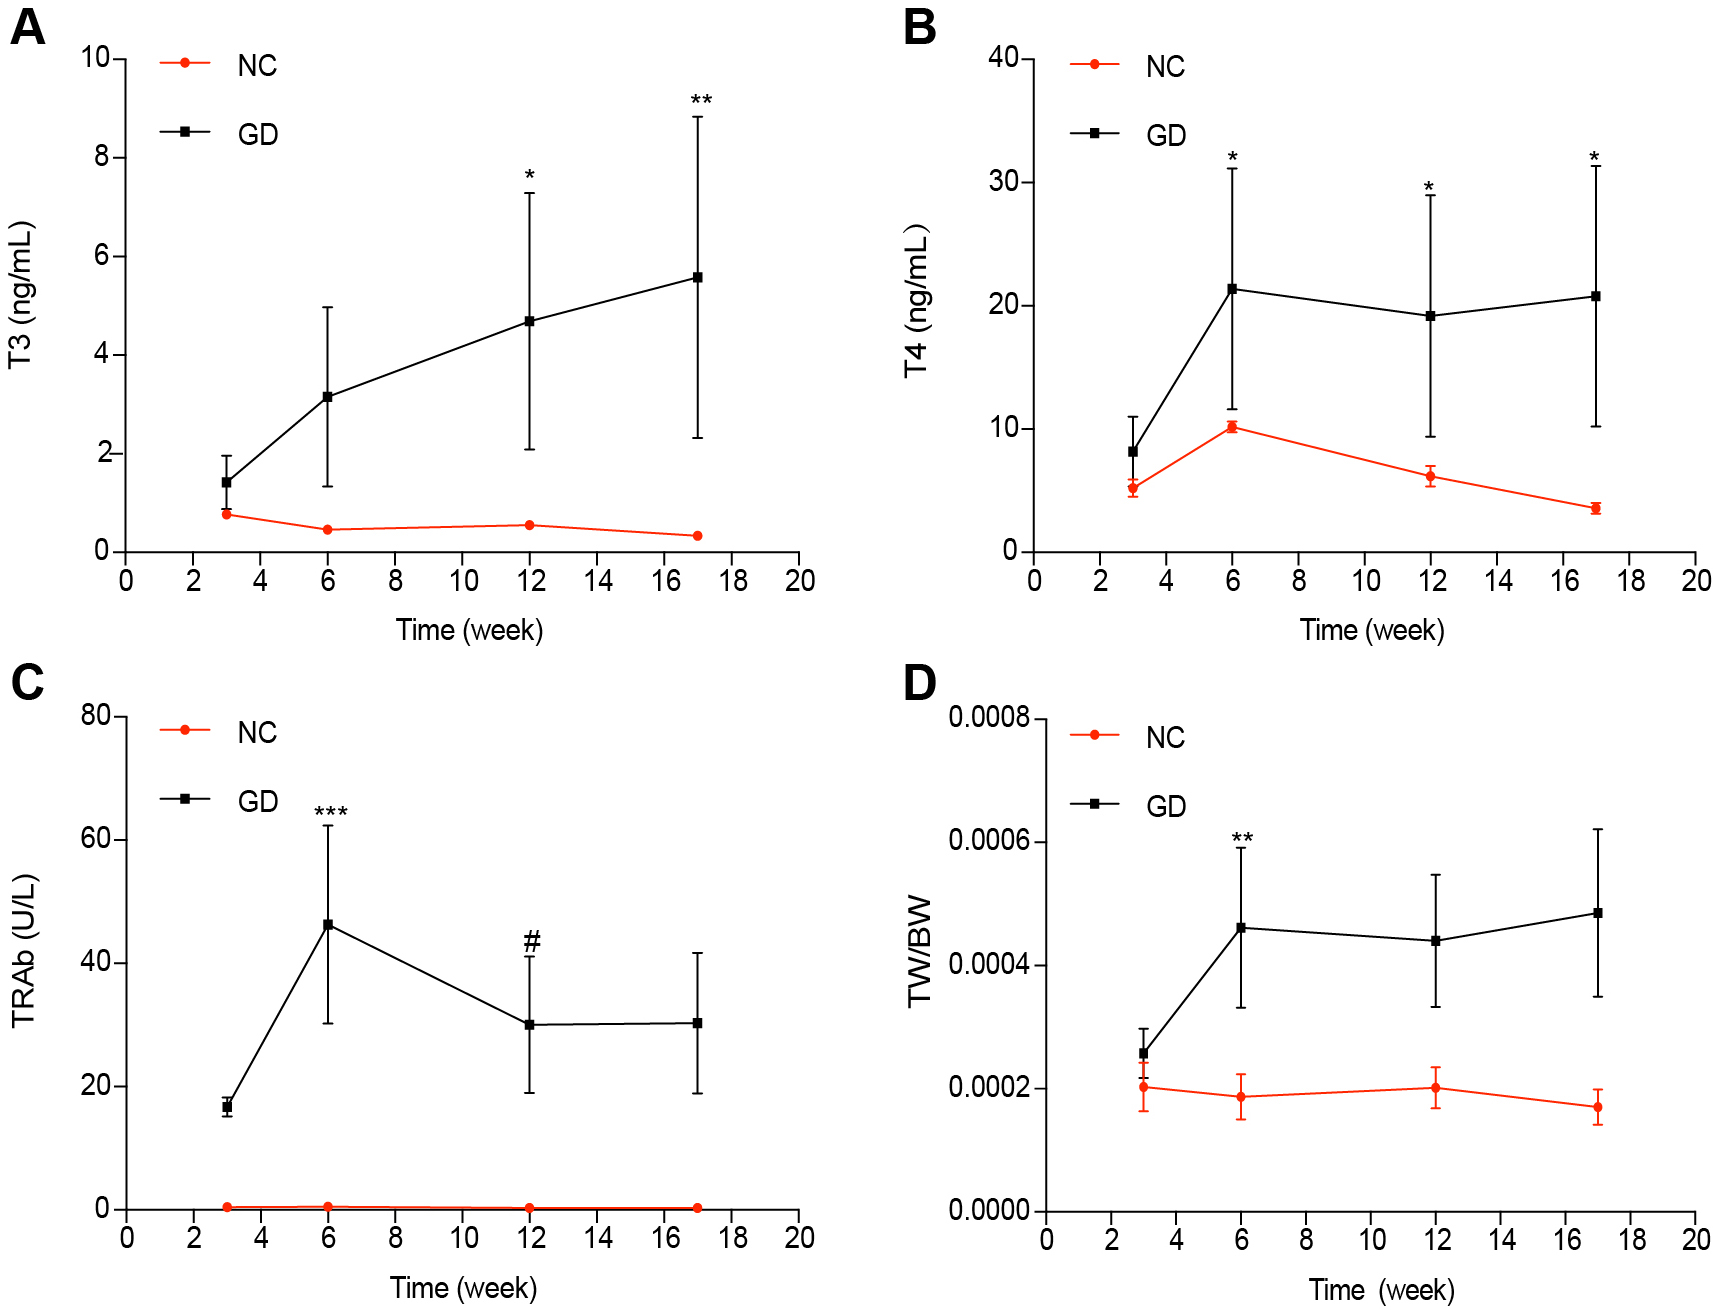
Changing trends of thyroid function and morphology from 3 weeks to 17 weeks after immunization. (A) Changing trend of T3: T3 increased from 3 weeks to 17 weeks after immunization, but did not increase significantly from 3 to 6 weeks, 6 to 12 weeks and 12 to 17 weeks after immunization (p > 0.05, res). There was a significant difference in serum between the 3 weeks and 12 weeks after immunization (p < 0.05). (B) Changing trend of T4: T4 increased significantly from 3 weeks to 6 weeks after immunization (p < 0.05), but did not change significantly at the 6 weeks to 17 weeks after immunization (p > 0.05). (C) changing trend of TRAb: it increased significantly from 3 weeks to 6 weeks after immunization (p < 0.001), and decreased significantly from 6 weeks to 12 weeks (p < 0.05) (D) changing trend of TW/BW: it was consistent with T4.
To observe the relationship between the indicators, we did a correlation analysis with each other. The results indicated that there is a significant positive correlation between T3, T4 and TRAb, respectively (Spearman r = 0.502, p = 0.012; Spearman r = 0.629, p = 0.001) (Fig. 6A). By comparing the findings of TRAb and TW/BW, there was a significant positive correlation between them (Spearman r = 0.676, p = 0.000) (Fig. 6B). The correlation analysis between the serum of T3 and T4 positively correlated with TW/BW respectively (Spearman r = 0.611, p = 0.002; Spearman r = 0.570, p = 0.004) (Fig. 6C).
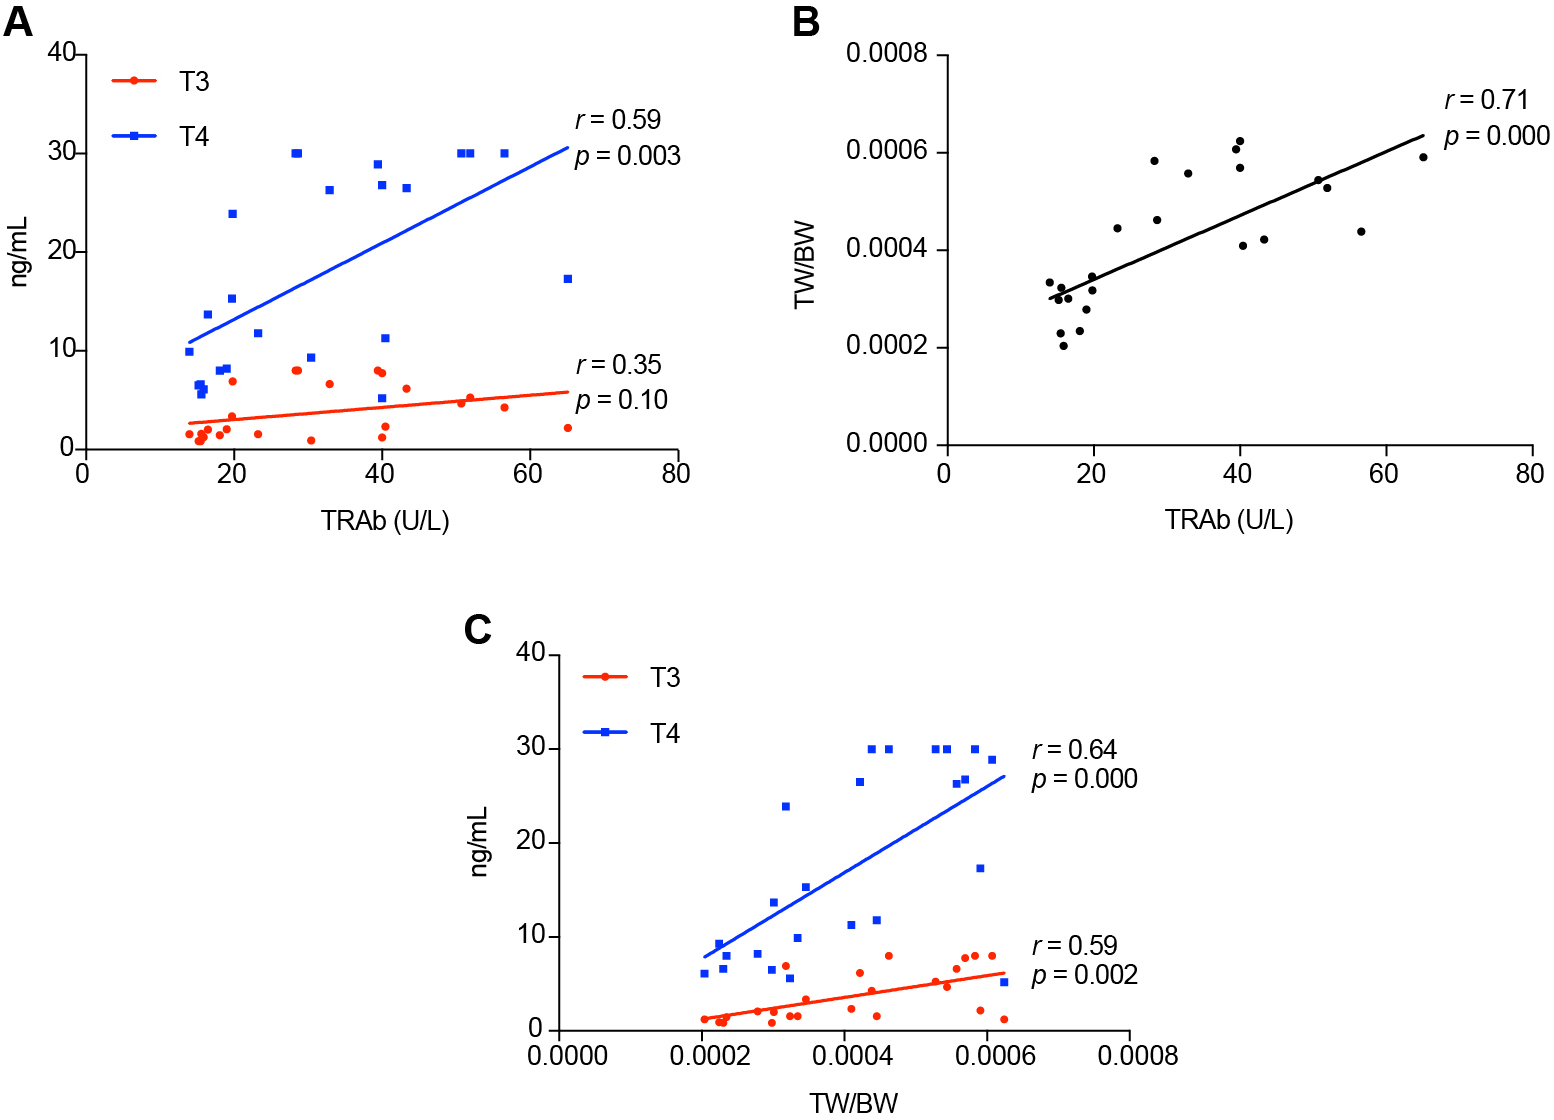
Correlation of serum of T3, T4, TRAb levels and TW/BW with each other. (A) Correlation of serum of T3, T4 with TRAb levels. T3 vs. TRAb: Spearman r = 0.502, p = 0.012; T4 vs. TRAb: Spearman r = 0.629, p = 0.001. (B) Correlation of serum of TRAb with TW/BW levels, Spearman r = 0.676, p = 0.000. (C) Correlation of serum of T3, T4 with TW/BW levels. T3 vs. TW/BW: Spearman r = 0.611, p = 0.002; T4 vs. TW/BW Spearman r = 0.570, p = 0.004.
In this study, our results showed that GD mouse model could be induced by only once immunization with Ad-TSHR289 at 3 weeks and maintained for at least 17 weeks, which would improve the efficiency of GD research than two or three injections [13, 14].
The incidence of the disease is an important sign to evaluate the successful of a model that thyroid alterations and hyperthyroidism were the key factors in the GD model [15]. In 2002, the incidence of GD in BALB/c mice was about 50–60% [8]. Some researchers improved the incidence of GD by combining Ad-TSHR289 immunization with other methods. DCs are importantly specialized in antigen presenting cells and play a key role in the primary immune response which were used in the construction of GD model [14]. DCs infected with AdTSHR289 immunized in BALB/c mice with a disease induction rate of about 70% [16]. The method of TSHR genetic immunization and vivo electroporation was also widely used [7, 8, 17]. A study recently reported that over 80% of immunization mice have developed to GD and the incidence of goiter was more than 90% with immunization and electroporation [18]. However, this approach may be at risk of causing death in mice after the last immunization [7, 15]. On the other hand, because of the optimization of injection dose and viral invasiveness, the incidence of GD has also improved greatly with Ad-TSHR289 immunization. Chen C-R et al. [11] successfully constructed GD model by 2-times immunization. Wu et al. [19] had reported the incidence of GD could reach 75% in the tenth week by 3 times injections. Our data showed that the incidence of hyperthyroidism at 3, 6, 12 and 17 weeks were about 66.67%, 100%, 100% and 100%. The serum of T3 was more significant than T4 at 3 weeks after immunization, which indicated the early stage of hyperthyroidism. Meanwhile, the incidences of goiter were nearly 50%, 83.33%, 100% and 100% at the same stages. Therefore, modeling rates of GD were about 50%, 83.33%, 100%, and 100% at 3, 6, 12, and 17 weeks after immunization, which is consistent with the results of our previous reports of two or three-times immunizations at 10 weeks after primary immunization [10, 12].
The maintenance time of the model is important evidence for evaluating the stability of the model. It was found that the content of TRAb was positively correlated with thyroid function and goiter in this study. Many reports have shown that multiple immunizations with Ad-TSHR289 may permit the sustained TRAb [3], which could be led to a generation of TSH-binding antibodies, which stimulated TSHR-dependent cAMP activity and induced thyroid hyperplasia and marked histological alterations. In the early time, Wu et al. have found the duration of the model with Ad-TSHR289 immunization by 3 times can be maintained 18 weeks [19]. Recently, a long term GD model was observed last for at least 9 months by using the novel protocol which 3- and 4-weekly for total of nine immunizations [2, 20]. However, our results have shown that the serum levels of TRAb and T3, T4 remained were still at a high level at 17 weeks after immunization, and there was no significant downward trend. Meanwhile, the goiter was mark enlarged in GD group. We considered that the GD mice model by once immunization can be maintained for more time than 17 weeks. TRAb began to decline after peaking at 6 weeks and remained stable from 12 weeks to 17 weeks after immunization, which indicated the exogenous antigens may not be the only source to maintain TRAb. In a previous study, we have found that low expressions of Foxp3 were existing in GD mice model [10]. Treg cells could suppress autoreactive T and B cells to maintain immune self-tolerance [21, 22]. GD is a group of T cells and B cells-mediated organ-specific autoimmune disorder, which results from the loss of immune tolerance [23]. As IgG, TRAb can be produced by B cells [24]. TRAb may also be from immune disorder in GD model by Ad-TSHR289 immunization [3].
From the results, we imply that it is a feasible way to construct GD model with Ad-TSHR289 immunization by a single immunization. What are the reasons for the feasibility of this method? The virus titer may also be involved with. Higher virus titer might lead to stronger immune response [20]. But the early report has found little relationship between the viral dose and the prevalence of GD model [13]. Low dose immunization with Ad-TSHR289 also could establish GD model with a high incidence of hyperthyroidism. The effective of adenovirus may be the critical factor. With the improvement of technology level, the activity of adenovirus is further improved, which could cause a stronger immune response.
The significance of our research includes the following points. Firstly, after immunization, our data showed that the modeling rate reached about 50% from 3 weeks and over 83.33% at 6 weeks, which could shorten the experimental period for about 1 month compared with two or three times immunization. Secondly, the data showed that thyroid function and goiter changed significantly from 3 weeks to 6 weeks. This period is suitable for intervention studies in the early stage of GD or in the period of mild goiter. Thirdly, at 17 weeks after immunization, the thyroid function and goiter in GD group were still significantly abnormal compared with NC group, which indicated that the model could be maintained for a longer time than 17 weeks after primary immunization. Meanwhile, T4, TRAb and TW/BW were barely changed from 12 to 17 weeks, which provides a stable state for intervention research.
It was found that high modulus can be obtained by a single immunization, but the sample size is relatively small and we only estimate the model by T4, TRAb and thyroid morphologic changes. In the future, we will try to increase the sample to calculate the model more precisely. Secondly, we have found that the model was in good condition in 17 weeks, but didn’t explore how long it would last. Moreover, accompanying common features of GD such as goiter, lymphocytic infiltration of the thyroid, orbital changes indicative of thyroid eye disease [25], we should monitor more corroborative evidence.
In summary, our study has shown that GD model can be constructed by only primary immunization with Ad-TSHR289, which could be detected at 3 weeks and at least until the 17 weeks after a single immunization. It would improve the efficiency of GD research.
We thank Basil Rapoport (University of California Los Angeles) for providing us with the plasmid of pSV2neoECE-TSHR289-6H-dhfr. This study was supported by the National Natural Science Foundation of China (Grant No. 81774293, 81373593).
Disclosure potential conflicts of interestNone of the authors has any potential conflicts of interest associated with this research.
Authors’ contributionsYang Tang, Xiaoyun Zhu, Hui Feng, Lili Zhu, Shouqiang Fu, Bingtan Kong were involved in the experiment, Yang Tang, Xiaoyun Zhu, Lili Zhu drafted the manuscript, Ximing Liu approved the final manuscript.