Abstract
Patients with primary aldosteronism (PA) are complicated by metabolic syndrome more frequently than those without PA. Hyperaldosteronism has been reported to be associated with a higher prevalence of non-alcoholic fatty liver disease (NAFLD). We aimed to clarify the risk factors for hepatic steatosis in the two subtypes of PA, comparing the status of hepatic steatosis in each of these subtypes. This was a retrospective observational study. We enrolled patients with an aldosterone producing adenoma (APA) (n = 33) or idiopathic hyperaldosteronism (IHA) (n = 56). Hepatic fat content was evaluated using the ratio of liver to spleen (L/S) X-ray attenuation on unenhanced computed tomography. L/S ratio <1.0 was utilized for assessing as hepatic steatosis. Age, sex distribution, visceral fat percentage (VF%), and visceral fat area (VFA) did not differ between patients with the two PA subtypes. The percentages of patients with L/S ratio <1.0 was not different between the two subtypes (APA: 21.2 % (7/33) vs. IHA: 19.6 % (11/56), p = 1.00). In both subtypes, the L/S ratio negatively correlated with VF% (APA: r = –0.66, p < 0.001; IHA: r = –0.66, p < 0.001) and with VFA (APA: r = –0.44, p < 0.01; IHA: r = –0.37, p < 0.01). The status of hepatic steatosis, evaluated using L/S ratio, did not differ between patients with APA or IHA. Hepatic steatosis was affected by the amount of visceral fat.
PRIMARY ALDOSTERONISM (PA) is the most common cause of secondary hypertension, accounting for 5%–10% of all cases [1, 2]. However, PA is complicated not only by hypertension, but also by the presence of insulin resistance and dyslipidemia, meaning that cardiovascular disease is more prevalent in individuals with PA than in those without [3, 4]. Aldosterone-induced mineralocorticoid receptor activation impairs insulin sensitivity in adipocytes and skeletal muscle by activating oxidative stress and inflammatory pathways [5, 6].
Non-alcoholic fatty liver disease (NAFLD) is the most common cause of chronic liver disease in the developed world [7]. NAFLD represents a spectrum from non-alcoholic fatty liver (NAFL), to non-alcoholic steatohepatitis (NASH), cirrhosis, end-stage liver failure and hepatocellular carcinoma. The development of NAFLD is closely related to that of metabolic syndrome. Visceral adipose tissue and insulin resistance have frequently been shown to be independent risk factors for NAFLD [8]. In individuals with insulin resistance, a failure of the insulin-induced suppression of hormone-sensitive lipase leads to higher plasma concentrations of free fatty acids and ultimately to more lipogenesis in the liver. Furthermore, both the excess of adipose tissue and hepatic steatosis lead to insulin resistance and consequent metabolic dysregulation [7].
Hyperaldosteronism has been reported to be associated with higher prevalences of NAFLD and metabolic syndrome [9, 10]. Fallo et al. showed ultrasonographic examination that the prevalence of NAFLD is significantly higher in patients with PA than in normotensive individuals, and that it was not different between patients with an aldosterone-secreting adenoma (APA) and those with idiopathic hyperaldosteronism (IHA) [11]. We aimed to clarify the risk factors with hepatic steatosis in the two subtypes of PA. We compared the status of hepatic steatosis in each of these subtypes, APA and IHA, in a larger number of individuals, evaluating the severity of hepatic steatosis by computed tomography (CT).
Materials and Methods
Patients
This was a retrospective observational study of patients diagnosed with PA between April 2007 and April 2017 at Sapporo City General Hospital. The present study was approved by the ethics committee of Sapporo City General Hospital (Approval number: R01-059-572) and was carried out according to the principles of the Declaration of Helsinki and its amendments. This study was performed using an opt-out methodology. The opt out option was presented on the website at Sapporo City General Hospital.
Screening for PA is performed using the ratio of the plasma aldosterone concentration (PAC) (pmol/L) to the plasma renin activity (PRA) (μg/L/h), the aldosterone/renin ratio (ARR). Values >555 pmol/L per μg/L/h (200 pg/mL per ng/mL/h) are considered suspicious, after a change from antihypertensive drugs to calcium channel blockers and/or α-blockers, as applicable. A diagnosis of PA is accepted when at least one positive result from confirmatory testing is obtained, including the captopril challenge test, upright-furosemide loading test, and saline loading test. We excluded patients with suspected autonomous cortisol secretion, defined by a serum cortisol concentration ≥49.7 nmol/L (1.8 μg/dL) after a 1-mg dexamethasone suppression test (DST) [12]. We also excluded patients who consumed excessive amounts of alcohol (≥20 g/day for women and ≥30 g/day for men), patients with a history or clinical evidence of hepatic disease, and those diagnosed with diabetes mellitus.
Adrenal venous sampling
Prior to and 30 min after adrenocorticotropic hormone (ACTH; bolus injection of 250 μg of cosyntropin) administration, blood samples were collected by simultaneous adrenal venous sampling (AVS) from both adrenal veins and from the inferior vena cava (IVC) at a point distal to the renal vein. Catheterization was judged to be successful if the selectivity index (SI: the ratio of the cortisol concentrations in serum from the adrenal veins and the IVC) was >5 or the serum cortisol concentration was >5,517 nmol/L (200 μg/dL) in the adrenal vein following ACTH administration in patients not sampled from the IVC [13]. Patients who underwent unsuccessful AVS were excluded.
Unilateral hyperaldosteronism was diagnosed if the lateralized index (LI: the ratio of aldosterone to cortisol concentration between the dominant and non-dominant adrenal glands) was >4 following ACTH administration and AVS [14-16]. Bilateral hyperaldosteronism was diagnosed if the LI was <2 following ACTH administration [17].
Subtype of primary aldosteronism
Patients with PA were allocated to two groups, an APA group and an IHA group, according to the AVS results. APA was diagnosed if both unilateral hyperaldosteronism was diagnosed using AVS and a pathologic finding of adrenocortical adenoma was made. IHA was diagnosed when bilateral hyperaldosteronism was diagnosed using AVS.
Evaluation of intra-abdominal fat volume using MDCT
Participants were examined in a supine position with both their arms stretched above their heads using a Toshiba Aquillio ONE CT scanner (Tokyo, Japan). We obtained a 64-slice multidetector computed tomography (MDCT) scan with a tube voltage of 120 kV, automatically controlled tube current, and pitch factor 0.828, starting at the upper edge of the liver and continuing to the pelvis. The tube current was automatically controlled with automatic exposure control. All patients underwent a thin-slice (2-mm thick) CT.
We evaluated the visceral fat percentage (VF%), visceral fat area (VFA), subcutaneous adipose area (SCFA), and waist circumference using Synapse Vincent ver. 4.4 (Tokyo, Japan). Adipose tissue was automatically identified by the software on the basis of attenuation, using a window of –50 to –270 Hounsfield units (HU). The intra-abdominal visceral fat volume was measured by drawing a line within the muscle wall surrounding the abdominal cavity, starting at the upper edge of the liver and continuing to the pelvis. VF% was calculated by dividing the intra-abdominal visceral fat volume by the total abdominal volume. The VFA, SCFA, and waist circumference were determined at the umbilical level.
Evaluation of hepatic fat content using unenhanced MDCT
Hepatic fat content was evaluated using the ratio of liver to spleen (L/S) x-ray attenuation on unenhanced CT. We measured attenuation at the left liver lobe, the right liver lobe, and at two positions in the spleen, using regions of interest (ROIs). The L/S ratio was calculated by taking a mean attenuation measurement in ROIs in both lobes of the liver and dividing it by the mean attenuation of the two spleen ROIs. L/S ratio <1.0 was utilized for assessing as hepatic steatosis [18-20].
Calculations
We compared the L/S ratio between the two subtypes of PA. We also compared the degrees of hepatic steatosis and fibrosis evaluated using the hepatic steatosis index (HSI) [21], fatty liver index (FLI) [22], NAFLD fibrosis score [23], and fibrosis-4 index (FIB4 index) [24] between the two subtypes of PA. We also compared the degree of insulin resistance using homeostasis model assessment insulin resistance (HOMA-R). HOMA-R was calculated using the formula: fasting plasma glucose concentration (mmol/L) × immunoreactive insulin (μIU/L)/22.5. In addition, we analyzed the correlation of L/S ratio with PAC, serum potassium concentration, HOMA-R, VF%, and VFA for each subtype of PA.
Assay methods
PAC was determined using a radioimmunoassay (SPAC-S Aldosterone Kits; Fuji Rebio, Co., LTD, Tokyo, Japan). The reference range for PAC in the supine position was 83–441 pmol/L (30–159 pg/mL), according to the manufacturer’s instructions. PRA was also measured using a radioimmunoassay, with the reference range in the supine position being 0.3–2.9 μg/L/h (0.3–2.9 ng/mL/h) (PRA radioimmunoassay Kits; Fuji Rebio, Co., LTD, Tokyo, Japan).
Statistical analyses
The data were analyzed and compared using Bell Curve for Excel (Social Survey Research Information Co., Ltd., Tokyo, Japan). Continuous variables are expressed as either mean ± standard deviation or median and interquartile range. Correlations were analyzed using Pearson’s correlation coefficient or Spearman’s rank correlation coefficient, as appropriate. In the multiple regression analysis, we analyzed the relationships between L/S ratio, as a response variable, and the explanatory variables that were significantly associated with L/S ratio in the univariate analyses. Continuous variables were analyzed using t-tests or Mann-Whitney U tests, as appropriate. Comparisons of the frequency between the two groups were made using either the χ2 test or the Fisher exact test, as appropriate. Statistical significance was accepted when p < 0.05.
Results
A flow chart summarizing the study was shown in Fig. 1. Two hundred and eighty-six patients were confirmed as having PA. Among those patients in whom AVS was successfully performed, we excluded those with ambiguous results (LI 2–4 following ACTH administration (n = 24)), patients who consumed excessive amounts of alcohol (n = 23), and patients diagnosed with diabetes mellitus (n = 28). Thirty-three patients were diagnosed with APA and 56 with IHA. Their baseline characteristics were summarized in Table 1. None of age, sex, body mass index, aspartate aminotransferase (AST), alanine aminotransferase (ALT), γ-glutamyl transpeptidase (γGTP), nor blood platelet count differed between patients with each subtype of PA. PAC was significantly higher in patients with APA than IHA (APA vs. IHA; 946 [633–1,556] pmol/L (341 [228–561] pg/mL) vs. 369 [324–481] pmol/L (133 [117–173] pg/mL); p < 0.001). The percentage of patients taking a potassium supplement was significantly higher for those with APA than for those with IHA. PRA and serum potassium concentration were significantly lower in patients with APA than in those with IHA.
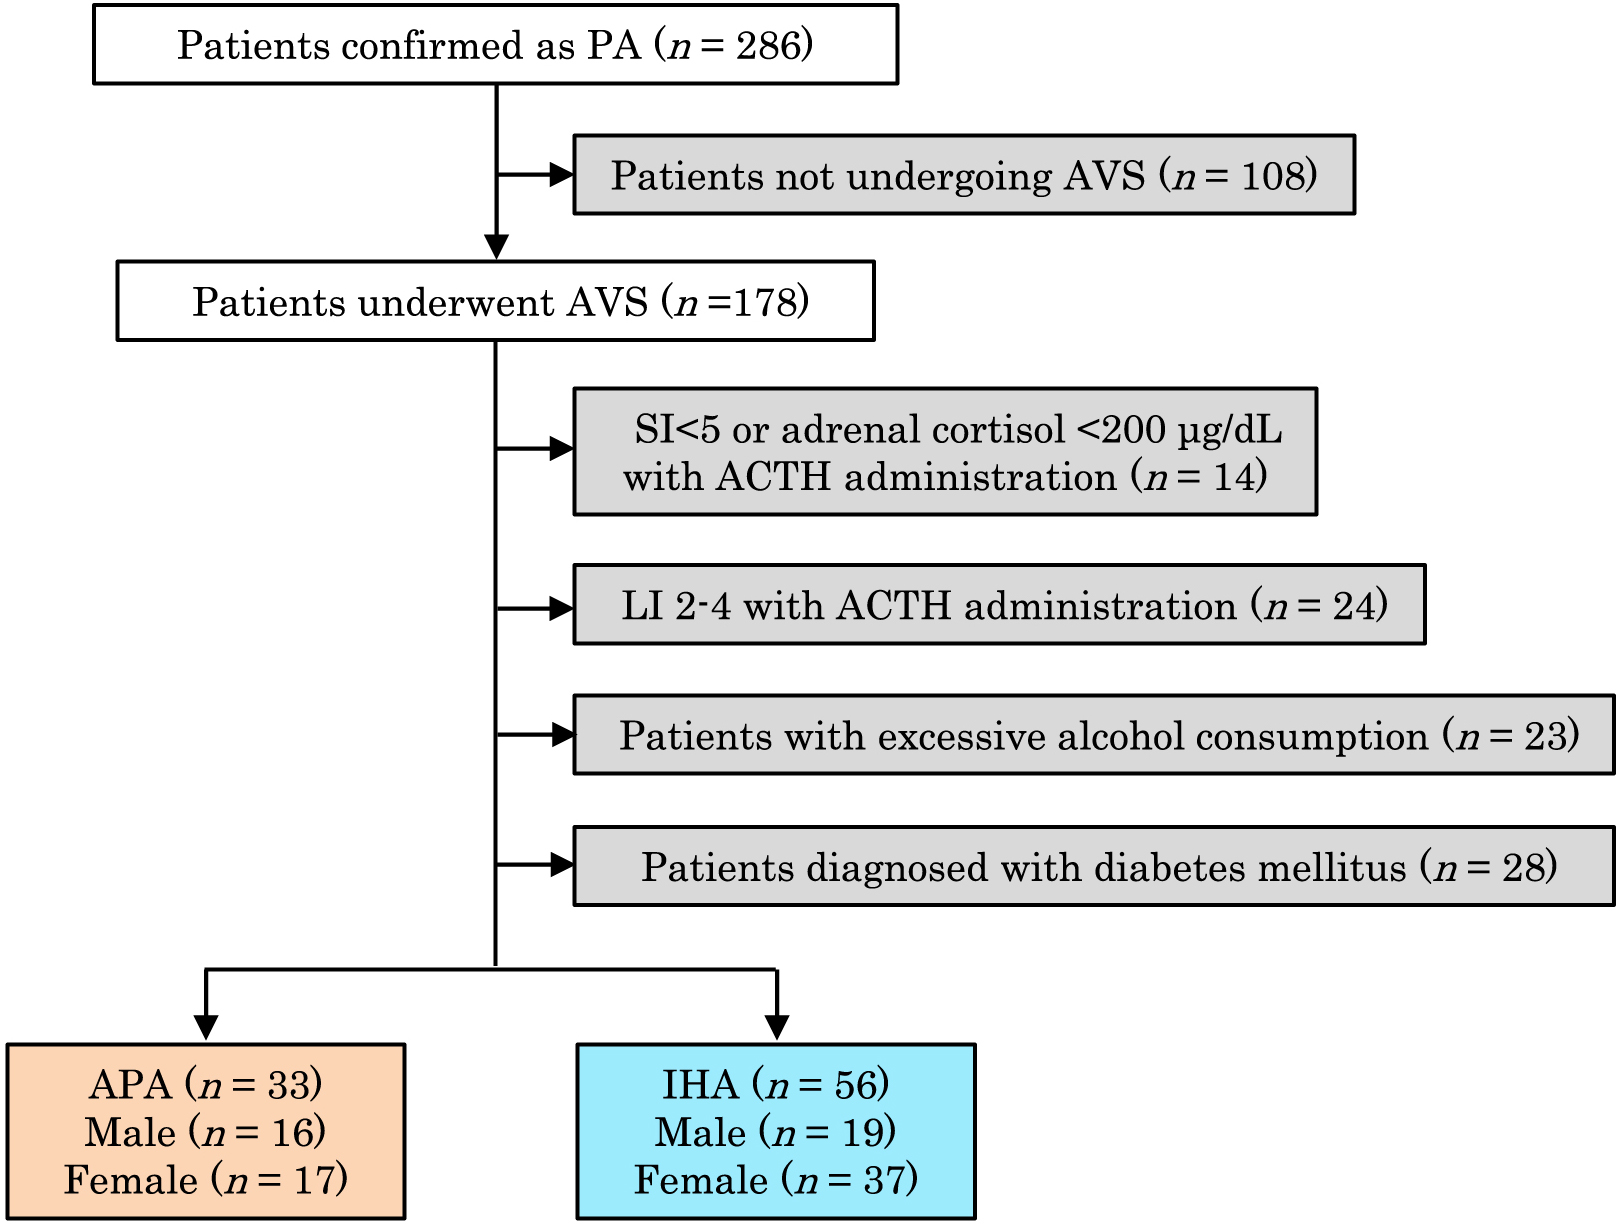
Table 1
Baseline characteristics of patients with APA or IHA
|
APA (n = 33) |
IHA (n = 56) |
p value |
| Age (years) |
48.9 ± 13.2 |
49.6 ± 11.2 |
0.78 |
| Sex (female) (%) |
17 (51.5%) |
37 (66.1%) |
0.26 |
| Body height (cm) |
162.4 ± 10.2 |
160.8 ± 8.4 |
0.42 |
| Body weight (kg) |
66.1 [53.5–75.3] |
63.1 [56.5–70.1] |
0.65 |
| BMI |
24.7 ± 4.3 |
24.5 ± 3.4 |
0.78 |
| Serum potassium level (mmol/L) |
3.1 [2.7–3.6] |
4.0 [3.8–4.1] |
<0.001 |
| Potassium supplement (%) |
20/33 (60.6%) |
2/56 (3.6%) |
<0.001 |
| PRA (μg/L/h) |
0.2 [0.1–0.3] |
0.3 [0.2–0.5] |
0.01 |
| PAC (pmol/L) |
945.9 [632.5–1,556.2] |
368.9 [324.0–480.7] |
<0.001 |
| ARR |
473.0 [296.9–749.1] |
113.0 [83.2–192.0] |
<0.001 |
| Serum cortisol after 1-mg DST (nmol/L) |
30.3 [8.3–38.6] |
19.3 [16.6–27.6] |
0.02 |
| AST (IU/L) |
20.0 [17.0–25.0] |
19.0 [15.8–22.0] |
0.66 |
| ALT (IU/L) |
17.0 [13.0–26.0] |
18.0 [14.0–27.0] |
0.83 |
| γGTP (IU/L) |
32.0 [17.0–45.0] |
24.5 [16.0–36.3] |
0.59 |
| Plt (103/μL) |
25.0 ± 5.9 |
24.6 ± 5.4 |
0.76 |
| Alb (g/L) |
42.2 ± 3.3 |
42.5 ± 3.1 |
0.73 |
| TG (mmol/L) |
1.27 ± 0.8 |
1.37 ± 0.74 |
0.57 |
| Total-chol (mmol/L) |
4.88 ± 0.59 |
5.19 ± 0.79 |
0.05 |
| HDL-chol (mmol/L) |
1.31 ± 0.32 |
1.42 ± 0.36 |
0.13 |
| LDL-chol (mmol/L) |
2.86 ± 0.55 |
3.03 ± 0.66 |
0.23 |
| Fasting glucose levels (mmol/L) |
5.28 ± 0.51 |
5.32 ± 0.43 |
0.72 |
| HbA1c (%) |
5.3 ± 0.5 |
5.5 ± 0.4 |
0.13 |
| Immunoreactive insulin (pmol/L) |
36.8 ± 22.2 |
49.3 ± 27.1 |
0.04 |
| HOMA-R |
1.3 ± 0.8 |
1.7 ± 1.0 |
0.07 |
Data are expressed as mean ± standard deviation, median [interquartile range], or number (percentage).
APA, aldosterone-producing adenoma; IHA, idiopathic hyperaldosteronism; BMI, body mass index; PRA, plasma renin activity; PAC, plasma aldosterone concentration; ARR, aldosterone/renin ratio; DST, dexamethasone suppression test; AST, aspartate aminotransferase; ALT, alanine aminotransferase; γGTP, γ-glutamyl transpeptidase; Plt, platelet; Alb, albumin; TG, triglyceride; Total-chol, total cholesterol; HDL-chol, high-density lipoprotein-cholesterol; LDL-chol, low-density lipoprotein-cholesterol; HOMA-R, homeostasis model assessment-insulin resistance.
With regard to the metabolic parameters, immunoreactive insulin was significantly higher in patients with IHA than in those with APA (p = 0.04). HOMA-R did not differ between the two subtypes of PA (Table 1). None of VF%, VFA, SCFA, and waist circumference differed between the two subtypes of PA (Table 2).
Table 2
Comparisons of adipose tissue parameters and waist circumference between APA and IHA
|
APA (n = 33) |
IHA (n = 56) |
p value |
| Visceral fat percentage (%) |
21.8 ± 11.7 |
25.6 ± 10.0 |
0.11 |
| Visceral fat area (cm2) |
82.9 ± 59.4 |
85.2 ± 51.7 |
0.85 |
| Subcutaneous fat area (cm2) |
136.5 ± 69.9 |
152.3 ± 62.1 |
0.27 |
| Waist circumference (cm) |
83.8 ± 11.6 |
83.8 ± 8.4 |
1.00 |
Data are expressed as mean ± standard deviation.
Visceral fat percentage was calculated by dividing intra-abdominal visceral fat volume by total abdominal volume. Visceral fat area, subcutaneous fat area, and waist circumference were determined at the umbilical level.
The percentages of patients with L/S ratio <1.0 was not different between the two subtypes (APA: 21.2% (7/33) vs. IHA: 19.6 % (11/56), p = 1.00). L/S ratio was similar in patients with the two subtypes of PA (APA vs. IHA; 1.1 ± 0.2 vs. 1.2 ± 0.2, p = 0.30). In addition, none of HSI, FLI, NAFLD fibrosis score, and FIB4 index differed between the two subtypes of PA (Table 3). Only in patients with IHA, L/S ratio negatively correlated with PAC (r = –0.31, p = 0.03). However, there was no correlation between L/S ratio and PAC in patients with APA (r = –0.09, p = 0.69). In both subtypes of PA, L/S ratio negatively correlated with VF% (APA: r = –0.66, p < 0.001; IHA: r = –0.66, p < 0.001) and VFA (APA: r = –0.44, p < 0.01; IHA: r = –0.37, p < 0.01). We then performed multivariate regression analysis to determine whether VF%, VFA, or PAC were significantly associated with L/S ratio in patients with IHA. Both VF% and VFA were significantly associated with L/S ratio (p < 0.01 and p = 0.02, respectively). However, PAC was not associated with L/S ratio (p = 0.12). Regarding the relationship between visceral fat and aldosterone concentration, both VF% and VFA positively correlated with PAC only in patients with IHA (p < 0.001 and p < 0.001, respectively). In addition, L/S ratio did not correlate with serum potassium concentration (APA: r = 0.35, p = 0.98; IHA: r = 0.41, p = 0.23) or HOMA-R in patients with either subtype of PA.
Table 3
Comparisons of hepatic steatosis and fibrosis evaluation scores between PA subtypes
|
APA (n = 33) |
IHA (n = 56) |
p value |
| HSI |
34.8 ± 3.8 |
34.2 ± 3.7 |
0.41 |
| FLI |
31.0 ± 29.6 |
29.5 ± 23.0 |
0.79 |
| NAFLD fibrosis score |
–2.4 ± 1.4 |
–2.5 ± 1.0 |
0.59 |
| FIB4 index |
1.0 ± 0.5 |
1.0 ± 0.5 |
0.98 |
Data are expressed as mean ± standard deviation.
HSI, hepatic steatosis index; FLI, fatty liver index; NAFLD fibrosis score, non-alcoholic fatty liver disease fibrosis score; FIB4 index, fibrosis-4 index.
Discussion
To the best of our knowledge, this is the first study to investigate the risk factors with hepatic steatosis in the two subtypes of PA, and to compare the status of hepatic steatosis between patients with the two subtypes of PA, using CT scan.
In the present study, the status of hepatic steatosis evaluated using L/S ratio on unenhanced CT did not differ between the two subtypes of PA. Furthermore, the evaluation scores for NAFLD, HSI, FLI, NAFLD fibrosis score, and FIB4 index were similar between the two subtypes. These results suggest that the status of hepatic steatosis does not differ between people with these two conditions. L/S ratio negatively correlated with VF% and VFA in both subtypes of PA, but negatively correlated with PAC only in patients with IHA. The multivariate regression analysis showed that VF% and VFA are significantly associated with L/S ratio in patients with IHA, whereas PAC is not. We have previously reported that PAC is positively correlated with VF% and VFA in patients with IHA, but not in APA [25]. This may be because the univariate analysis, which showed a negative correlation between L/S ratio and PAC in patients with IHA, is influenced by visceral fat volume as a confounding variable. However, we have shown that hepatic steatosis is affected by the amount of visceral fat in patients with either subtype of PA. It is supposed that aldosterone has a direct influence on visceral fat and indirect influence on L/S ratio through visceral fat in patients with IHA. Therefore the influence of aldosterone on hepatic steatosis is thought to be masked by the other possible factors of visceral fat, such as lifestyle or genetic factors.
Previous studies have shown that high visceral fat volume is associated with liver inflammation and fibrosis [8, 26]. Adipokines have been regarded as contributing to NAFLD through their pro-inflammatory activity [27]. Leptin, tumor necrosis factor-α, and interleukin-6 have been reported to be associated with the progression of hepatic steatosis [26-28], and serum adiponectin concentration has been shown to be associated with the prevention of hepatic steatosis [29]. Thus, an excess of visceral fat might lead to the progression of NAFLD in people with either subtype of PA.
A number of other factors have been suggested to influence the prevalence of NAFLD. Low serum potassium has been proposed to predispose towards the development of NAFLD in patients with PA [11, 30] and might directly lead to insulin resistance through endothelial dysfunction induced by low nitric oxide level, and indirectly through low serum adiponectin [31]. In the present study, serum potassium concentration was significantly lower in patients with APA than that with IHA, whereas HOMA-R did not differ between the two subtypes of PA. Furthermore, there were no correlations between the L/S ratio and serum potassium or HOMA-R in patients with either subtype of PA. However, we cannot exclude the possibility that the significantly different percentage of patients taking potassium supplements between the two PA subgroups influenced these results.
Liver biopsy is regarded as the gold standard method for the assessment of NAFLD and is the only reliable method for diagnosing NAFLD and differentiating NASH from NAFL. However, various non-invasive imaging methods have been used recently, including ultrasonography, CT, magnetic resonance imaging, and magnetic resonance spectroscopy. Ultrasonography is often the first imaging modality used to evaluate NAFLD. Using ultrasonography, NAFLD is diagnosed when the hepatic echo pattern is brighter than that of the right kidney, is homogenous, and there is a loss of intrahepatic architectural detail. However, it is impossible to quantify the severity of NAFLD by ultrasonography. Instead, the severity of NAFLD can be defined using the L/S ratio, derived using CT. Longo et al. have reported a linear correlation between L/S ratio on CT and historic liver steatosis score [32]. Because we perform a CT study for almost all patients with PA and in all patients who undergo AVS, the evaluation of hepatic steatosis by CT was thought to be an appropriate method to use for patients with PA, taking into account the cost involved.
The main strength of this study was that we evaluated L/S ratio in patients with both subtypes of PA, who had been precisely diagnosed using AVS. Furthermore, we compared the severity of hepatic steatosis using the L/S ratio on unenhanced CT between the two subtypes of PA, and evaluated the correlations of L/S ratio with factors potentially influencing the prevalence of NAFLD: PAC, serum potassium, HOMA-R, VF%, and VFA. Finally, we evaluated a range of scores to assess liver pathology: HSI, FLI, NAFLD fibrosis score, and FIB4 index. The main limitation of this study was that we were unable to match the baseline data for patients with each subtype of PA, including the number of patients and sex ratio, because this was a retrospective cohort study conducted at a single center. And we could not perform liver biopsy or other imaging procedures such as magnetic resonance imaging, and magnetic resonance spectroscopy.
In conclusion, the status of hepatic steatosis, evaluated using the L/S ratio on CT, did not differ between patients with APA or IHA. Aldosterone secretion and serum potassium were not associated with hepatic steatosis in either subtype of PA, whereas the amount of visceral fat was associated with hepatic steatosis.
Conflict of Interest
The authors declare no conflicts of interest that could be perceived as biasing the impartiality of the research reported.
References
- 1 Young WF (2007) Primary aldosteronism: renaissance of a syndrome. Clin Endocrinol (Oxf) 66: 607–618.
- 2 Hannemann A, Wallashofski H (2012) Prevalence of primary aldosteronism in patient’s cohorts and in population-based studies—a review of the current literature. Horm Metab Res 44: 157–162.
- 3 Giacchetti G, Ronconi V, Turchi F, Agostinelli L, Mantero F, et al. (2007) Aldosterone as a key mediator of the cardiometabolic syndrome in primary aldosteronism: an observational study. J Hypertens 25: 177–186.
- 4 Fallo F, Veglio F, Bertello C, Sonino N, Della Mea P, et al. (2006) Prevalence and characteristics of the metabolic syndrome in primary aldosteronism. J Clin Endocrinol Metab 91: 454–459.
- 5 Luther JM (2014) Effects of aldosterone on insulin sensitivity and secretion. Steroids 91: 54–60.
- 6 Sowers JR, Whaley-Connell A, Epstein M (2009) Narrative review: the emerging clinical implications of the role of aldosterone in the metabolic syndrome and resistant hypertension. Ann Intern Med 150: 776–783.
- 7 Targher G, Byrne CD (2013) Clinical review: nonalcoholic fatty liver disease: a novel cardiometabolic risk factor for type 2 diabetes and its complications. J Clin Endocrinol Metab 98: 483–495.
- 8 Ko YH, Wong TC, Hsu YY, Kuo KL, Yang SH (2017) The correlation between body fat, visceral fat, and nonalcoholic fatty liver disease. Metab Syndr Relat Disord 15: 304–311.
- 9 Srinivasa S, Fitch KV, Quadri N, Maehier P, O’Malley TK, et al. (2018) Significant association of aldosterone and liver fat among HIV-infected individuals with metabolic dysregulation. J Endocr Soc 2: 1147–1157.
- 10 Luo P, Dematteo A, Wang Z, Zhu L, Wang A, et al. (2013) Alosterone deficiency prevents high-fat-feeding-induced hyperglycemia and adipocyte dysfunction in mice. Diabetelogia 56: 901–910.
- 11 Fallo F, Dalla Plzza A, Tecchio M, Tona F, Sonino N, et al. (2010) Nonalcoholic fatty liver disease in primary aldosteronism: a pilot study. Am J Hypertens 23: 2–5.
- 12 Fassnacht M, Arlt W, Bancos I, Dralle H, Newell-Price J, et al. (2016) Management of adrenal incidentalomas: European Society of Endocrinology Clinical Practice Guideline in collaboration with the European Network for the Study of Adrenal Tumors. Eur J Endocrinol 175: G1–G34.
- 13 Omura M, Sasano H, Saito J, Yamaguchi K, Kakuta Y, et al. (2006) Clinical characteristics of aldosterone producing microadenoma, macroadenoma, and idiopathic hypertaldosteronism in 93 patients with primary aldosteronism. Hypertens Res 29: 883–889.
- 14 Young WF, Stanson AW, Thompson GB, Grant CS, Farley DR, et al. (2004) Role for adrenal venous sampling in primary aldosteromism. Surgery 136: 1227–1235.
- 15 Monticone S, Viola A, Rossato D, Veglio F, Reincke M, et al. (2015) Adrenal vein sampling in primary aldosteronism: towards a standardised protocol. Lancet Diabetes Endocrinol 3: 296–303.
- 16 Webb R, Mathur A, Chang R, Baid S, Niubol N, et al. (2012) What is the best criterion for the interpretation of adrenal vein sample results in patients with primary hyperaldosteronism. Ann Surg Oncol 19: 1881–1886.
- 17 Rossi GP, Sacchetto A, Chiesura-corona M, De Toni R, Gallina M, et al. (2001) Identification of the etiology of primary aldosteronism with adrenal vein sampling in patients with equivocal computed tomography and magnestic resonance findings: results in 104 consecutive cases. J Clin Endocrinol Metab 86: 1083–1090.
- 18 Zeb I, Li D, Nasir K, Katz R, Larijani VN, et al. (2012) Computed tomography scans in the evaluation of fatty liver disease in a population based study: the multi-ethnic study of atherosclerosis. Acad Radiol 19: 811–818.
- 19 Piekarski J, Goldberg HI, Royal SA, Axel L, Moss AA (1980) Difference between liver and spleen CT numbers in the normal adult: its usefulness in predicting the presence of diffuse liver disease. Radiology 137: 727–729.
- 20 Bydder GM, Chapman RW, Harry D, Bassan L, Sherlock S, et al. (1981) Computed tomography attenuation values in fatty liver. J Comput Tomogr 5: 33–35.
- 21 Lee JH, Kim D, Kim HJ, Lee CH, Yang JI, et al. (2010) Hepatic steatosis index: a simple screening tool reflecting nonalcoholic fatty liver disease. Dig Liver Dis 42: 503–508.
- 22 Bedogni G, Bellentani S, Miglioli L, Masutti F, Passalacqua M, et al. (2006) The fatty liver index: a simple and accurate predictor of hepatic steatosis in the general population. BMC Gastroenterol 6: 33.
- 23 Angulo P, Hui JM, Marchesini G, Bugianesi E, George J, et al. (2007) The NAFLD fibrosis score: a noninvasive system that identifies liver fibrosis in patients with NAFLD. Hepatology 45: 846–854.
- 24 Stah AG, Lydecker A, Murray K, Tetri BN, Contos MJ, et al. (2009) Comparison of noninvasive markers of fibrosis in patients with nonalcoholic fatty liver disease. Clin Gastroenterol Hepatol 7: 1104–1112.
- 25 Shibayama Y, Wada N, Baba S, Miyano Y, Obara S, et al. (2018) Relationship between visceral fat and plasma aldosterone concentration in patients with primary aldosteronism. J Endocr Soc 2: 1236–1245.
- 26 van der Poorten D, Milner KL, Hui J, Hodge A, Trenell MI, et al. (2008) Visceral fat: a key mediator of steatohepatitis in metabolic liver disease. Hepatology 48: 449–457.
- 27 Hui JM, Hodge A, Farrell GC, Kench JG, Kriketos A, et al. (2004) Beyond insulin resistance in NASH: TNF-alpha or adionectin? Hepatology 40: 46–54.
- 28 Chitturi S, Farrell G, Frost L, Kriketos A, Lin R, et al. (2002) Serum leptin in NASH correlates with hepatic steatosis but not fibrosis: a manifestation of lipotoxicity? Hepatology 36: 403–409.
- 29 Musso G, Gambino R, Durazzo M, Biroli G, Carello M, et al. (2005) Adipokines in NASH: postrandial lipid metabolism as a link between adiponectin and liver disease. Hepatology 42: 1175–1183.
- 30 Sun K, Lu J, Jiang Y, Xu M, Xu Y, et al. (2014) Low serum potassium level is associated with nonalcoholic fatty liver disease and its related metabolic disorders. Clin Endocrinol (Oxf) 80: 348–355.
- 31 Reungjiui S, Hu H, Mu W, Roncal CA, Croker BP, et al. (2007) Thiazide-induced subtle renal injury not observed in states of equivalent hypokalemia. Kidney Int 72: 1483–1492.
- 32 Longo R, Ricci C, Masutti F, Vidimari R, Croce LS, et al. (1993) Fatty infiltration of the liver. Quantification by 1H localized magnetic resonance spectroscopy and comparison with computed tomography. Invest Radiol 28: 297–302.
