Abstract
Levels of alanine aminotransferase (ALT) and γ-glutamyl transferase (GGT) have been reported to be associated with increased risk of diabetes mellitus (DM). However, whether a combination of levels of ALT and GGT predicts new onset of DM better than does ALT or GGT alone in both males and females has not fully been addressed. We investigated the relationship between the combination of ALT and GGT and DM development during a 10-year follow-up period in 13,919 subjects (male/female: 8,983/4,936; age 48 ± 10 years) who received health examinations. During the 10-year period, 617 males (6.9%) and 153 females (3.1%) had new onset of DM. Multivariable Cox proportional hazard models with a restricted cubic spline showed that hazard ratios (HRs) of DM development increased with higher levels of ALT and GGT at baseline in both sexes after adjustment of confounding factors. When divided into 4 subgroups of high (H-) and low (L-) levels of ALT (male/female: 27/21 U/L) and GGT (male/female: 43/23 U/L) using cutoff values shown by receiver operating characteristic curve analyses, the adjusted HR in the H-ALT/H-GGT group was significantly higher than HR in the L-ALT/L-GGT group as the reference in males (HR [95% confidence interval]: 1.73[1.36–2.20], p < 0.001) but was not significantly higher in females (1.50 [0.97–2.33], p = 0.065). The addition of the combination of H-ALT/H-GGT to traditional risk factors with and without H-ALT or H-GGT alone significantly improved the discriminatory capability for predicting development of DM. In conclusion, the combination of H-ALT/H-GGT efficiently predicts development of DM in male individuals but not significantly in female individuals.
THE PREVALENCE RATE of diabetes mellitus (DM) is 9.3% in adults, and approximately 463 million people suffer from DM worldwide [1]. The number of people with DM is expected to increase further [1]. Since DM causes various complications including nephropathy, neuropathy and cardiovascular disease, identification of individuals who have a high risk of DM is very important. On the other hand, approximately 1.5 billion people worldwide have chronic liver disease such as nonalcoholic fatty liver disease (NAFLD) [2]. NAFLD is diagnosed in approximately 10% to 30% of adults by health examinations [3], and the number of patients with NAFLD has recently been increasing [4]. Since the global burden of chronic liver disease and DM is substantial, it is important to investigate the relationship between DM and chronic liver disease.
Chronic liver disease has recently been reported to be a risk factor of DM [5-8]. It has been reported that several biomarkers for liver function, including alanine aminotransferase (ALT), γ-glutamyl transferase (GGT) and aspartate aminotransferase (AST), are associated with a 1.3~1.5-fold increased risk of DM [9]. Recent meta-analyses showed associations of the risk for development of DM with levels of ALT and GGT but not level of AST [10, 11]. An elevated level of ALT has been reported to be associated with lipid accumulation in the liver [12], which may cause insulin resistance [13] and secondary pancreatic β-cell failure [14]. On the other hand, it has been reported that GGT is involved in the generation of reactive oxygen species [15] and is associated with several inflammatory factors [16]. Therefore, a combination of high levels of ALT and GGT might be a strong predictor of the risk for DM. It has recently been reported that a simultaneous elevation of the level of ALT and GGT was significantly associated with the development of DM in middle-aged Japanese subjects (only males, n = 2,775) [17]. However, since the distribution of concentrations of ALT and GGT differs in males and females, the effect of liver enzymes on the risk for development of DM may differ by sex [18]. Therefore, whether the combination of levels of ALT and GGT predicts new onset of DM in both males and females has not been fully addressed. In the present study, we investigated the association of new onset of DM during a 10-year period with the combination of levels of ALT and GGT as well as each single level at baseline in a general population including both male and female subjects.
Methods
This study was a project of the Broad-range Organization for REnal, Arterial and cardiac studies by Sapporo Medical University Affiliates (BOREAS) investigators and was designed as the BOREAS-DM3 study. The study was performed with the approval of the institutional ethical committee of Sapporo Medical University (Number: 30-2-32) and conformed to the principles outlined in the Declaration of Helsinki. Written informed consent was obtained from all of the subjects.
Study subjects and clinical outcome
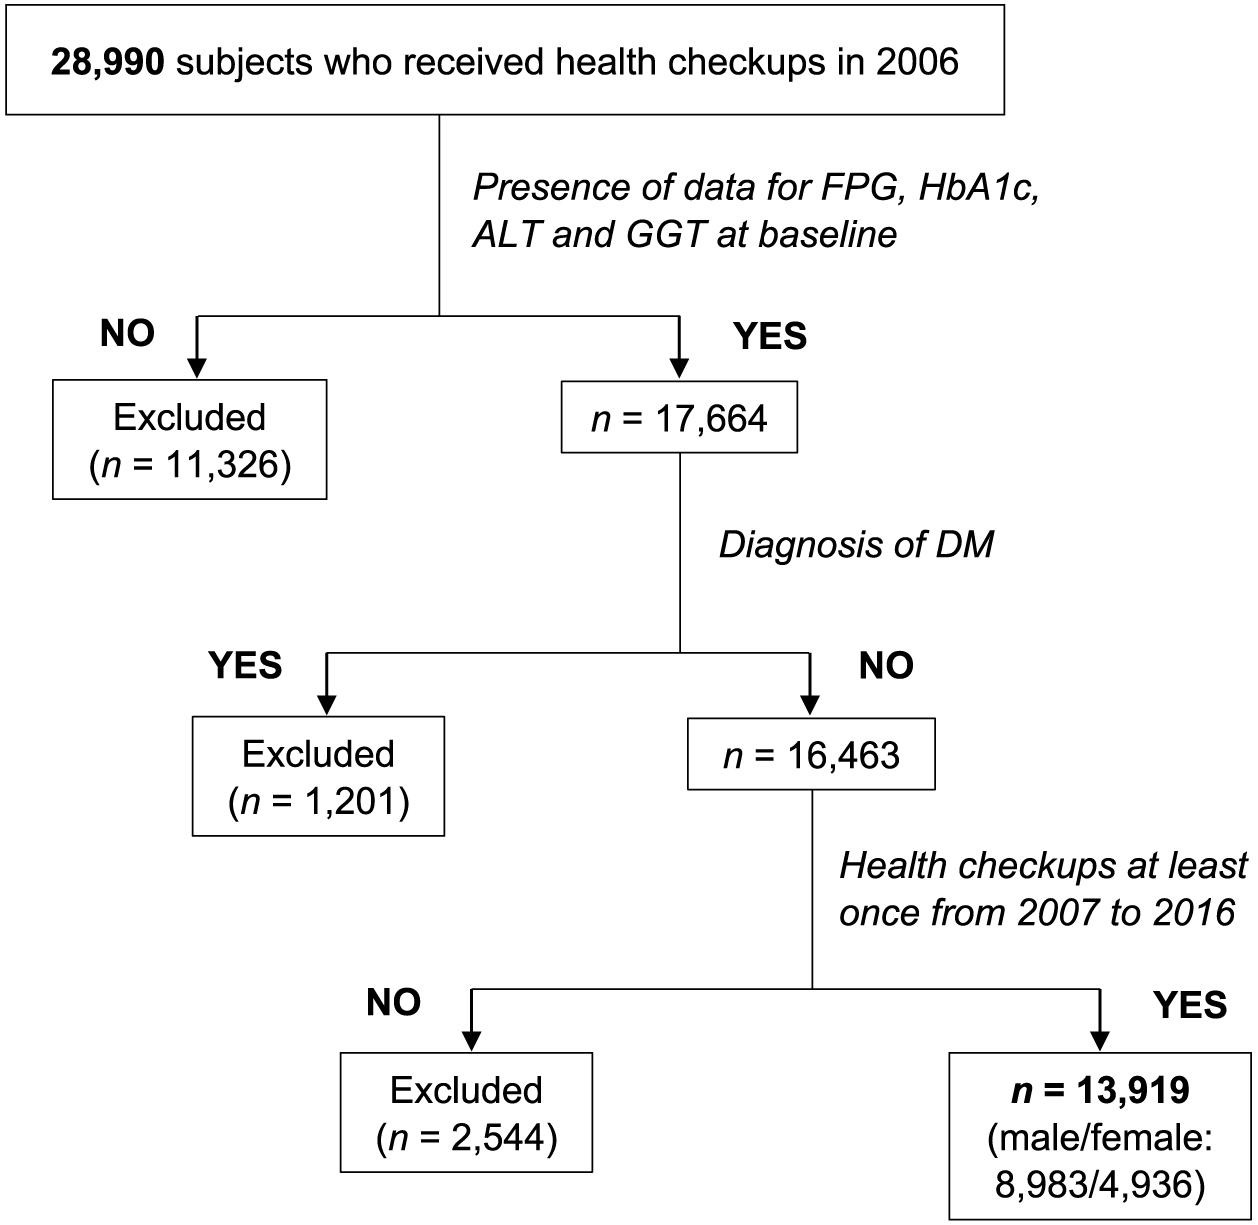
All of the subjects (n = 28,990) who received annual medical checkups at Keijinkai Maruyama Clinic, Sapporo, Japan in 2006 were enrolled [19, 20]. A flow chart of the study subjects is shown in Fig. 1. Exclusion criteria were the diagnosis of DM at baseline and the absence of laboratory data including hemoglobin A1c (HbA1c), fasting plasma glucose (FPG), ALT and GGT at baseline. After exclusion, a total of 13,919 subjects (male/female: 8,983/4,936) who received health examinations at least once during the period from 2007 to 2016 contributed the analysis. The average number of annual examinations during the period from 2007 to 2016 was 6.0, and the number of subjects who continuously received health examinations every year was 5,696 (40.6%, male/female: 3,689/1,967).
The development of DM during a 10-year follow-up period was diagnosed in accordance with the guidelines of the American Diabetes Association [21]: HbA1c ≥6.5%, FPG ≥126 mg/dL or self-reported use of anti-diabetic drugs.
Measurements
Medical examinations were performed after an overnight fast. Body mass index (BMI) was calculated as body weight (kg) divided by height (meter) squared. HbA1c level was presented as the National Glycohemoglobin Standardization Program (NGSP) equivalent value. Estimated glomerular filtration rate (eGFR) was calculated by an equation for Japanese: eGFR (mL/min/1.73 m2) = 194 × serum creatinine (–1.094) × age (–0.287) × 0.739 (if female) [22]. Information on regular alcohol drinking habit (≥3 times/week), current smoking habit, family history of DM, and use of drugs for DM, dyslipidemia and hypertension was obtained by a self-administered questionnaire survey.
Hypertension was diagnosed as systolic blood pressure ≥140 mmHg, diastolic blood pressure ≥90 mmHg or self-reported use of anti-hypertensive drugs. Dyslipidemia was diagnosed as triglycerides ≥150 mg/dL, high-density lipoprotein cholesterol <40 mg/dL, low-density lipoprotein cholesterol ≥140 mg/dL or self-reported use of anti-dyslipidemic drugs.
Statistical analysis
Numeric variables are expressed as means ± SD for normal distribution parameters or medians (interquartile ranges) for skewed distribution parameters. Normality of distribution in each parameter was examined using the Shapiro-Wilk W test. Intergroup differences of demographic parameters were tested by the chi-square test. Differences between data in multiple groups were examined by one-way analysis of variance. The ability of ALT, GGT, FPG or HbA1c at baseline to predict new onset of DM was investigated by using receiver operating characteristic (ROC) curve analysis. The area under the curve (AUC) was calculated, and the cutoff values of ALT and GGT were obtained by the Youden index [23]. The relationship between hazard ratio (HR) for the development of DM and level of ALT or GGT at baseline was analyzed by a multivariable Cox proportional hazard model with a restricted cubic spline after adjustment of confounders including age, BMI, FPG, habits of alcohol drinking and smoking, family history of DM and diagnosis of dyslipidemia and hypertension at baseline. In addition, subjects were divided into subgroups of high (H-) and low (L-) levels of ALT and GGT using cutoff values determined by ROC curve analyses in both male and female subjects. Furthermore, both male and female subjects were divided into four subgroups: L-ALT/L-GGT, L-ALT/H-GGT, H-ALT/L-GGT and H-ALT/H-GGT groups. The rate of cumulative incidence of new onset of DM was analyzed by the log-rank test of Kaplan-Meier curves. HRs, 95% confidence intervals (CIs) and Akaike’s Information Criterion (AIC) after adjustment of the confounders were also calculated in the subgroups. To compare the discrimination for development of DM between the models adjusted for confounders as traditional risk factors for DM with and without H-ALT, H-GGT or H-ALT/H-GGT, C-statistics analogous to the AUC were estimated using the method of DeLong et al. [24]. Moreover, the increased discriminatory value was examined by net reclassification improvement (NRI) and integrated discrimination improvement (IDI) [25]. A p value <0.05 was considered statistically significant. All data were analyzed by using EZR [26] and R3.6.2.
Results
Characteristics of the study subjects
Characteristics of the recruited subjects are shown in Table 1. Male subjects had larger BMI, higher blood pressures, higher levels of albumin, uric acid, FPG, HbA1c and triglycerides and lower levels of eGFR than did female subjects. Levels of ALT, AST and GGT were significantly higher in males than in females. The frequencies of habits of current smoking and regular alcohol drinking were significantly lower in females than in males.
Table 1
Characteristics of the subjects at baseline
|
All |
Male |
Female |
p |
| n |
13,919 |
8,983 |
4,936 |
|
| Age, years |
48 ± 10 |
48 ± 10 |
48 ± 10 |
<0.001 |
| Body mass index |
23.1 ± 3.3 |
24.0 ± 3.1 |
21.7 ± 3.3 |
<0.001 |
| Systolic blood pressure, mmHg |
117 ± 16 |
120 ± 16 |
111 ± 16 |
<0.001 |
| Diastolic blood pressure, mmHg |
75 ± 11 |
77 ± 11 |
70 ± 10 |
<0.001 |
| Alcohol drinking habit |
6,451 (46) |
5,152 (57) |
1,299 (26) |
<0.001 |
| Current smoking habit |
4,798 (34) |
3,893 (45) |
905 (19) |
<0.001 |
| Family history of DM |
2,406 (17) |
1,408 (16) |
998 (20) |
<0.001 |
| Comorbidity |
| Hypertension |
1,320 (9) |
971 (11) |
349 (7) |
<0.001 |
| Dyslipidemia |
572 (4) |
373 (4) |
199 (4) |
0.005 |
| Biochemical data |
| ALT, U/L |
21 (15–31) |
25 (18–36) |
15 (12–20) |
<0.001 |
| AST, U/L |
21 (18–26) |
22 (19–28) |
19 (16–22) |
<0.001 |
| GGT, U/L |
31 (19–56) |
42 (27–72) |
18 (14–26) |
<0.001 |
| Albumin, g/dL |
4.3 ± 0.2 |
4.4 ± 0.2 |
4.3 ± 0.2 |
<0.001 |
| eGFR, mL/min/1.73 m2 |
84 ± 16 |
83 ± 14 |
87 ± 15 |
<0.001 |
| FPG, mg/dL |
90 ± 9 |
92 ± 9 |
86 ± 8 |
<0.001 |
| Hemoglobin A1c, % |
5.2 ± 0.4 |
5.2 ± 0.4 |
5.2 ± 0.4 |
<0.001 |
| Total cholesterol, mg/dL |
203 (182–227) |
203 (183–227) |
202 (180–227) |
0.018 |
| Triglycerides, mg/dL |
92 (63–136) |
109 (19–109) |
67 (50–94) |
<0.001 |
| HDL cholesterol, mg/dL |
59 (49–71) |
54 (46–64) |
68 (59–79) |
<0.001 |
| LDL cholesterol, mg/dL |
120 (101–141) |
122 (102–143) |
117 (97–139) |
<0.001 |
Variables are expressed as number (%), means ± SD or medians (interquartile ranges).
AST, aspartate aminotransferase; ALT, alanine aminotransferase; DM, diabetes mellitus; eGFR, estimated glomerular filtration rate; FPG, fasting plasma glucose; GGT, γ-glutamyl transpeptidase; HDL, high-density lipoprotein; LDL, low-density lipoprotein.
Among the 13,919 subjects (male/female: 8,983/4,936), 617 male subjects (6.9%) and 153 female subjects (3.1%) developed new onset of DM during a 10-year period. The mean follow-up period was 9.5 years, and follow-up summation was 93,556 (male/female: 60,427/33,129) person-years. The cumulative incidence rate of new onset of DM was 80 (95% CI: 75–86) (male/female: 99 [92–107]/46 [39–54]) per 1,000 person-years.
Prediction of new onset of DM by levels of ALT and GGT
ROC curve analyses for predicting new onset of DM showed that cutoff points of ALT level at baseline in males and females were 27 U/L (AUC: 0.66) (Fig. 2A) and 21 U/L (AUC: 0.64) (Fig. 2B), respectively. Cutoff points of GGT level at baseline in males and females were 43 U/L (AUC: 0.66) (Fig. 2C) and 23 U/L (AUC: 0.66) (Fig. 2D), respectively. Sensitivities, specificities, positive predictive values (PPVs) and negative predictive values (NPVs) of the cutoff levels of ALT and GGT for prediction of new onset of DM are shown in Supplementary Table S1.
On the other hand, cutoff points of FPG level at baseline in males and females were 100 mg/dL (AUC: 0.82) (Supplementary Fig. S1A) and 93 mg/dL (AUC: 0.80) (Supplementary Fig. S1B), respectively. Cutoff points of HbA1c level at baseline in males and females were 5.6% (AUC: 0.84) (Supplementary Fig. S1C) and 5.6% (AUC: 0.84) (Supplementary Fig. S1D), respectively.
Levels of ALT and GGT at baseline and new onset of DM
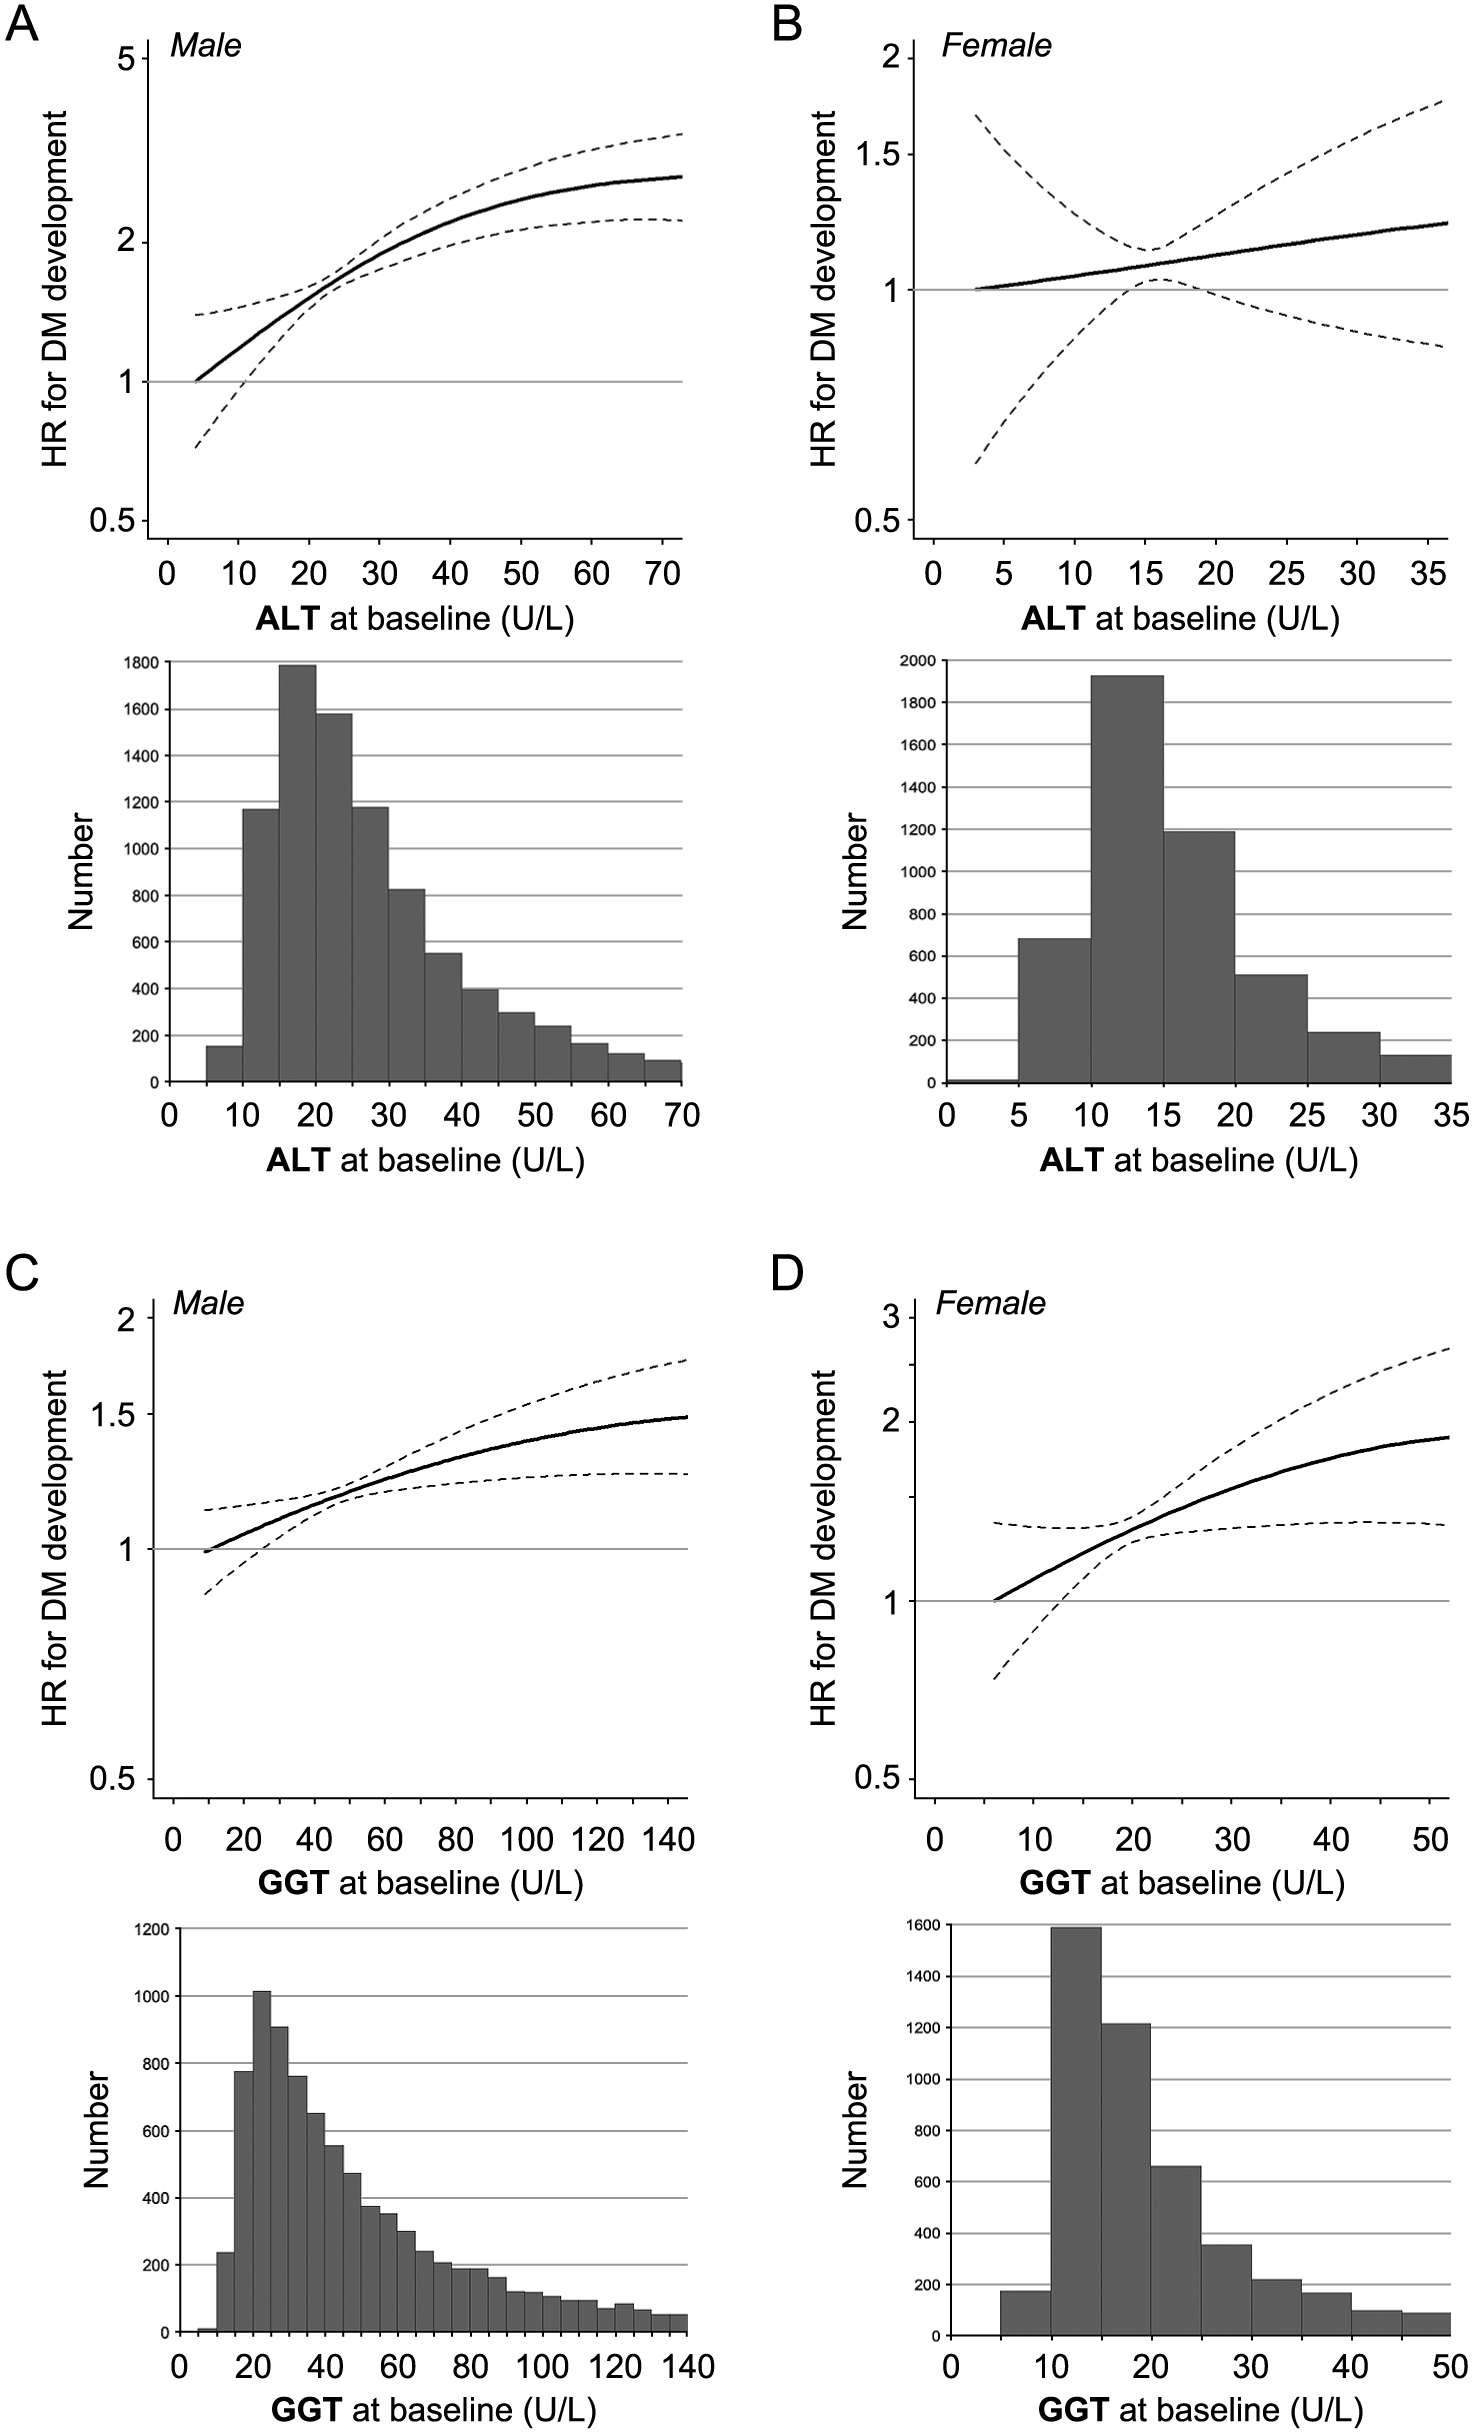
Box plots and histograms of levels of ALT and GGT in both sexes are shown in Supplementary Fig. S2 and Fig. 3, respectively. Multivariable Cox proportional hazard models with a restricted cubic spline showed that HRs of DM development increased with a higher ALT level at baseline in both males (Fig. 3A) and females (Fig. 3B) and a higher GGT level at baseline in both males (Fig. 3C) and females (Fig. 3D) after adjustment for age, BMI, FPG, habits of alcohol drinking and smoking, family history of DM and diagnosis of dyslipidemia and hypertension at baseline.
Level of ALT was a significant risk for new onset of DM in both males and females in unadjusted Cox proportional hazard analyses (Supplementary Table S2). After adjustment of age, BMI, FPG, habits of alcohol drinking and smoking, family history of DM and diagnosis of dyslipidemia and hypertension, the risk of ALT level (per 1 U/L) was significant in males (HR: 1.008, 95% CI: 1.005–1.011, p < 0.001) but not in females (HR: 1.003, 95% CI: 0.993–1.014, p = 0.530).
Level of GGT was a significant risk for new onset of DM in both males and females in unadjusted Cox proportional hazard analyses (Supplementary Table S3). After adjustment of age, BMI, FPG, habits of alcohol drinking and smoking, family history of DM and diagnosis of dyslipidemia and hypertension, the risk of GGT level (per 1 U/L) was significant in males (HR: 1.001, 95% CI: 1.000–1.002, p = 0.007) but not in females (HR: 1.000, 95% CI: 0.996–1.005, p = 0.860).
Combination of levels of ALT and GGT at baseline and hazard risk of new onset of DM
Basal characteristics and cumulative incidence of DM in the 4 subgroups divided by cutoff values of ALT and GGT at baseline determined by ROC curve analyses in all of the subjects as well as in both male and female subjects are shown in Table 2. There were significant differences in parameters, including age, FPG and HbA1c, among the 4 groups in all of the subjects as well as in both male and female subjects.
Table 2
Characteristics of the subjects divided by levels of ALT and GGT at baseline
|
L-ALT/L-GGT |
L-ALT/H-GGT |
H-ALT/L-GGT |
H-ALT/H-GGT |
p |
| All |
6,434 |
2,338 |
1,442 |
3,705 |
|
| Male |
3,501 |
1,457 |
1,093 |
2,932 |
|
| Female |
2,933 |
881 |
349 |
773 |
|
| New onset of diabetes mellitus, number (person-years) |
| All |
157 (44,267) |
120 (15,150) |
78 (9,745) |
415 (24,394) |
|
| Male |
105 (23,999) |
87 (9,402) |
67 (7,461) |
358 (19,565) |
|
| Female |
52 (20,268) |
33 (5,748) |
11 (2,284) |
57 (4,829) |
|
| Cumulative incidence rate, value per 1,000 person-years (95% confidence interval) |
| All |
36 (31–43) |
73 (61–87) |
77 (62–96) |
163 (148–178) |
|
| Male |
45 (37–55) |
83 (67–100) |
85 (67–108) |
173 (157–191) |
|
| Female |
26 (20–34) |
56 (39–79) |
49 (27–90) |
115 (88–149) |
|
| Age, years |
| All |
47 ± 10 |
51 ± 9 |
48 ± 10 |
48 ± 9 |
<0.001 |
| Male |
48 ± 10 |
51 ± 8 |
47 ± 10 |
47 ± 8 |
<0.001 |
| Female |
45 ± 10 |
49 ± 9 |
50 ± 10 |
51 ± 9 |
<0.001 |
| FPG, mg/dL |
| All |
87 ± 8 |
91 ± 10 |
90 ± 9 |
93 ± 10 |
<0.001 |
| Male |
89 ± 8 |
93 ± 9 |
90 ± 8 |
94 ± 10 |
<0.001 |
| Female |
84 ± 7 |
87 ± 8 |
86 ± 8 |
89 ± 9 |
<0.001 |
| Hemoglobin A1c, % |
| All |
5.2 ± 0.3 |
5.2 ± 0.4 |
5.3 ± 0.4 |
5.3 ± 0.4 |
<0.001 |
| Male |
5.2 ± 0.4 |
5.2 ± 0.4 |
5.3 ± 0.4 |
5.3 ± 0.4 |
<0.001 |
| Female |
5.1 ± 0.3 |
5.2 ± 0.4 |
5.2 ± 0.4 |
5.3 ± 0.4 |
<0.001 |
Variables are expressed as number or means ± SD.
ALT, alanine aminotransferase; FPG, fasting plasma glucose; GGT, γ-glutamyl transpeptidase; H-, high; L-, low.
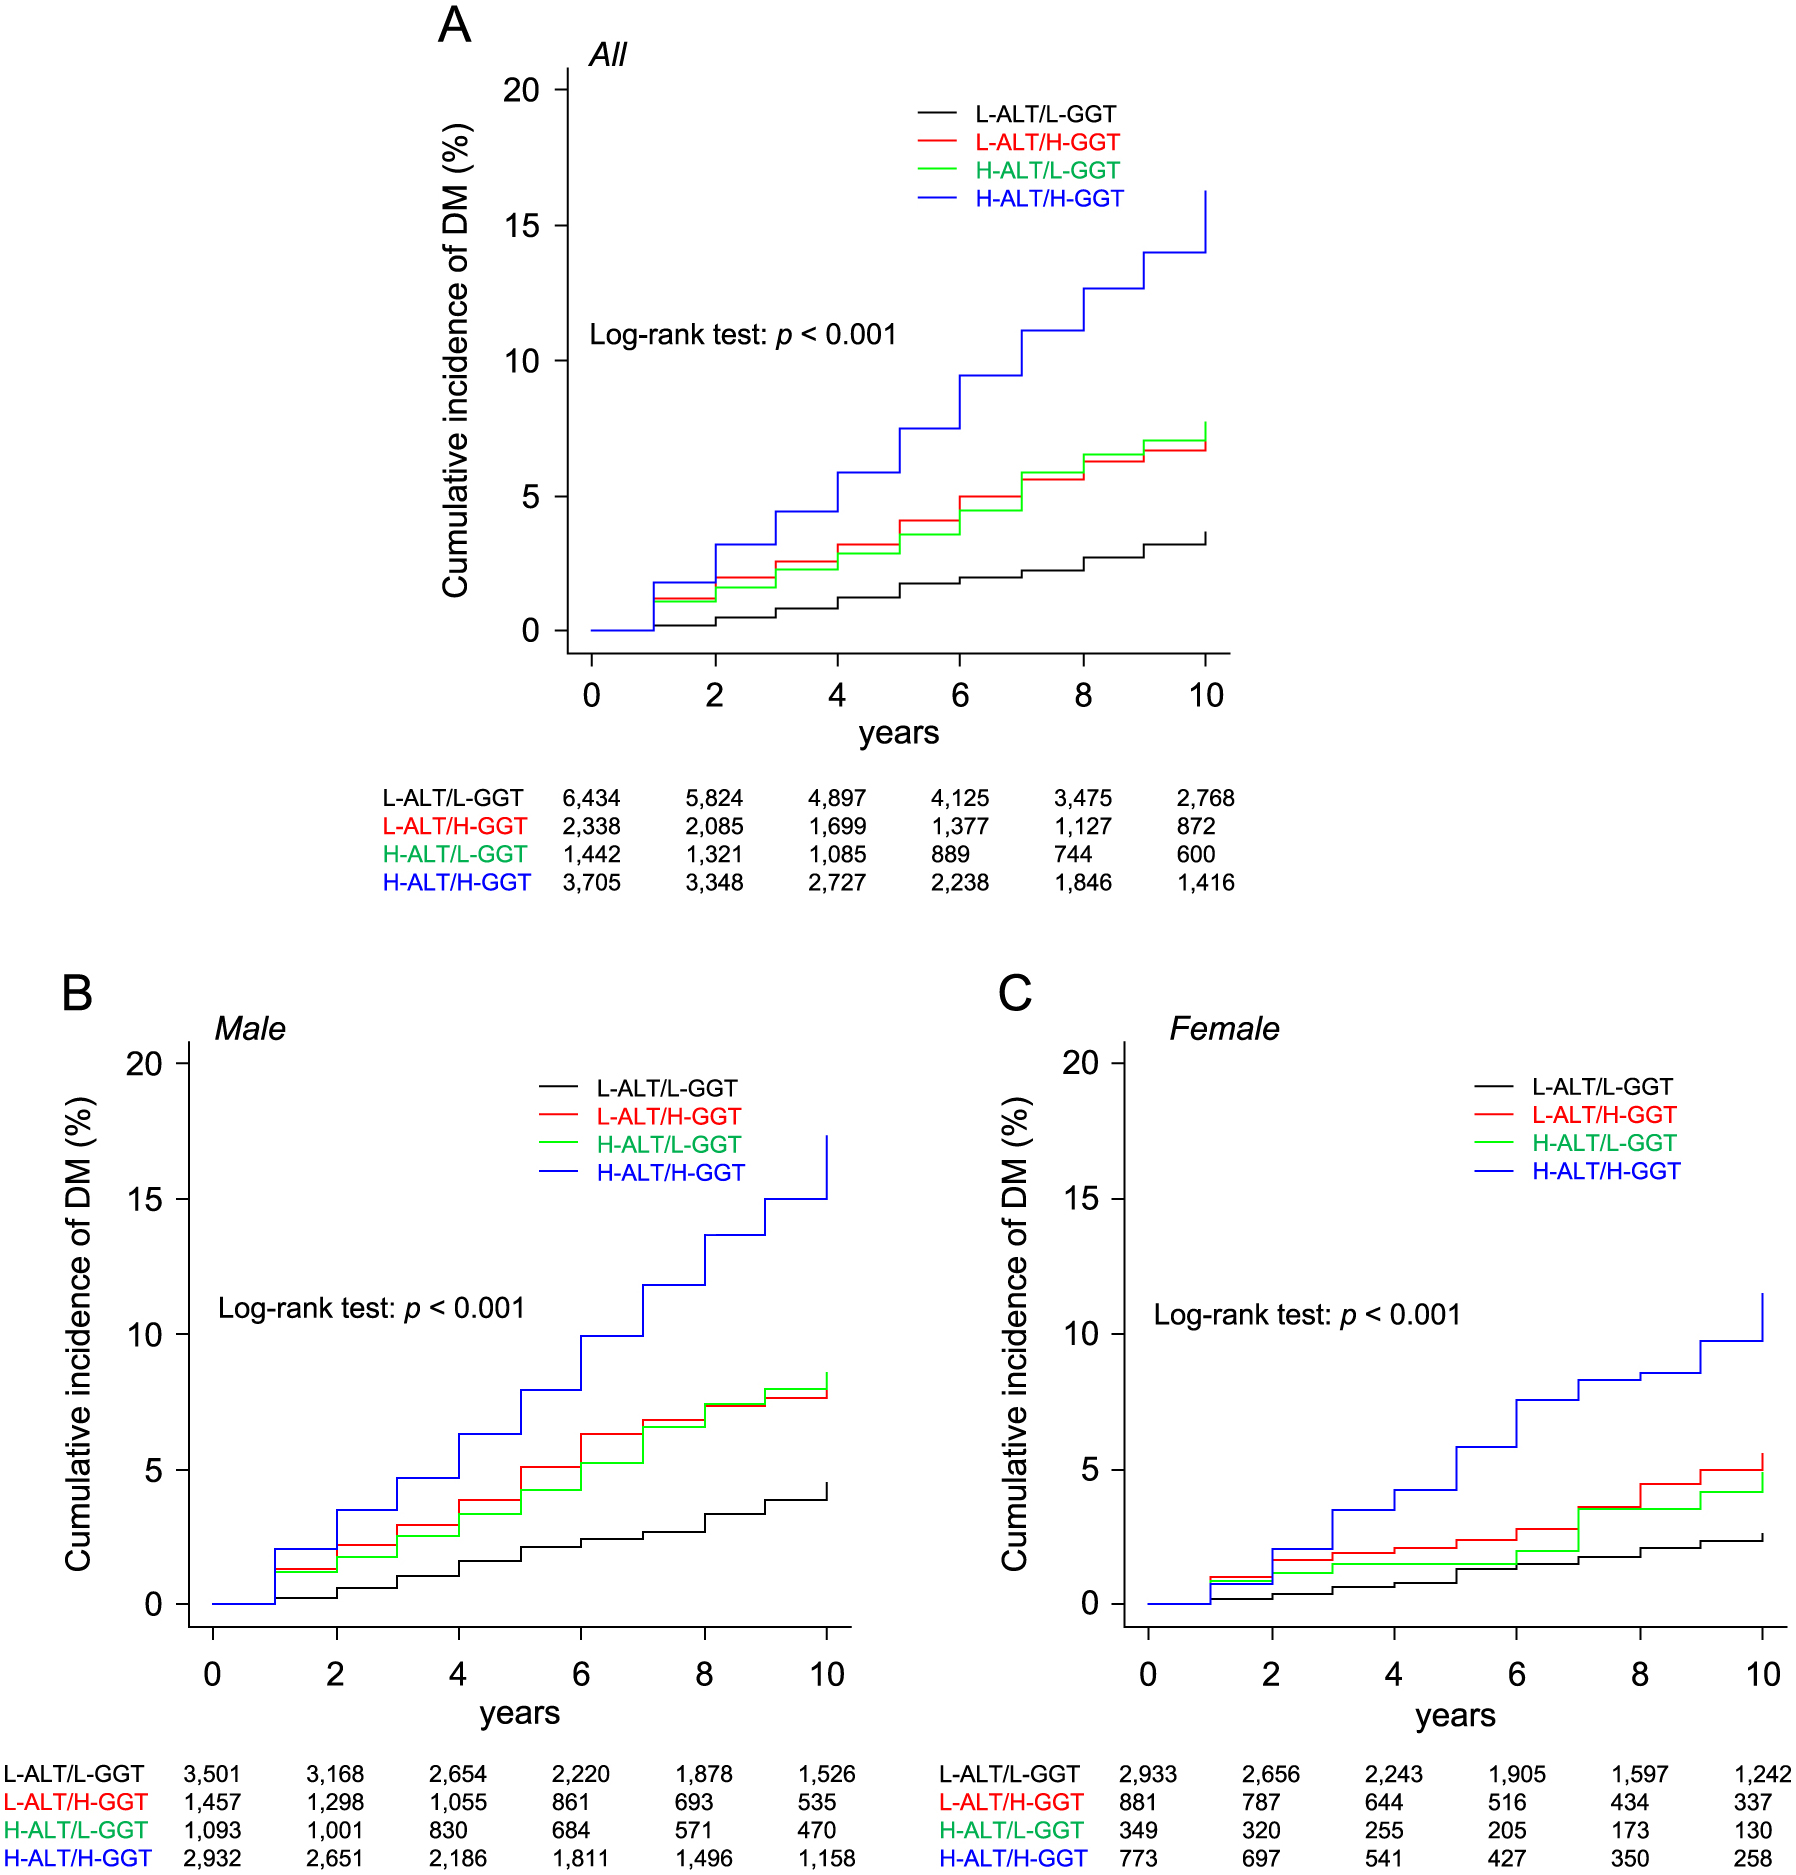
Kaplan-Meier survival curves showed that there were significant differences in rates of cumulative incidence of new onset of DM among the L-ALT/L-GGT, L-ALT/H-GGT, H-ALT/L-GGT and H-ALT/H-GGT groups in all of the subjects (log-rank test: p < 0.001) (Fig. 4A) as well as in male subjects (Fig. 4B) and female subjects (Fig. 4C) when the subjects were divided by sex.
In all of the subjects, after adjustment of age, BMI, FPG, habits of alcohol drinking and smoking, family history of DM and diagnosis of dyslipidemia and hypertension, HR in the H-ALT/H-GGT group (HR: 1.71, 95% CI: 1.39–2.10, p < 0.001) was significantly higher than HR in the L-ALT/L-GGT group as the reference (Supplementary Table S4). There was no significant interaction between sex and ALT/GGT category (p = 0.760). When the subjects were divided by sex, the adjusted HR in the H-ALT/H-GGT group was significantly higher than HR in the L-ALT/L-GGT group as the reference in males (HR: 1.73, 95% CI: 1.36–2.20, p < 0.001) but was not significantly higher in females (HR: 1.50, 95% CI: 0.97–2.33, p = 0.065) (Table 3). Sensitivities, specificities, PPVs, NPVs and adjusted HRs of the combination of H-ALT/H-GGT for prediction of new onset of DM are shown in Supplementary Table S1.
Table 3
Cox proportional hazard analyses for new onset of DM in the ALT/GGT groups divided by sex
|
Male (n = 8,983) |
Female (n = 4,936) |
| n |
HR (95% CI) |
p |
n |
HR (95% CI) |
p |
| L-ALT/L-GGT |
3,501 |
Reference |
— |
2,933 |
Reference |
— |
| L-ALT/H-GGT |
1,457 |
1.18 (0.87–1.59) |
0.277 |
881 |
1.20 (0.75–1.91) |
0.443 |
| H-ALT/L-GGT |
1,093 |
1.36 (0.99–1.87) |
0.056 |
349 |
0.90 (0.45–1.83) |
0.791 |
| H-ALT/H-GGT |
2,932 |
1.73 (1.36–2.20) |
<0.001 |
773 |
1.50 (0.97–2.33) |
0.065 |
| Age (per 1 year) |
|
1.01 (1.00–1.02) |
0.002 |
|
1.03 (1.01–1.05) |
<0.001 |
| Body mass index (per 1) |
|
1.09 (1.07–1.12) |
<0.001 |
|
1.08 (1.04–1.13) |
<0.001 |
| FPG (per 1 mg/dL) |
|
1.13 (1.12–1.14) |
<0.001 |
|
1.11 (1.09–1.12) |
<0.001 |
| Current smoking habit |
|
1.71 (1.45–2.02) |
<0.001 |
|
1.47 (0.98–2.22) |
0.061 |
| Alcohol drinking habit |
|
0.65 (0.54–0.77) |
<0.001 |
|
0.86 (0.57–1.27) |
0.455 |
| Family history of DM |
|
0.91 (0.67–1.24) |
0.586 |
|
0.97 (0.51–1.86) |
0.948 |
| Hypertension |
|
1.01 (0.83–1.22) |
0.930 |
|
0.98 (0.64–1.49) |
0.936 |
| Dyslipidemia |
|
1.51 (1.14–2.02) |
0.003 |
|
1.64 (0.90–2.22) |
0.104 |
|
|
(AIC = 8,846) |
|
(AIC = 2,087) |
AIC, Akaike’s information criterion; ALT, alanine aminotransferase; CI, confidence interval; DM, diabetes mellitus, FPG, fasting plasma glucose; HR, hazard ratio; GGT; γ-glutamyl transpeptidase.
The addition of H-GGT or H-ALT/H-GGT, but not H-ALT, to traditional risk factors for development of DM, including age, sex, BMI, habits of smoking and alcohol drinking, family history of DM, and diagnosis of hypertension and dyslipidemia, modestly but significantly increased the AUC (Table 4). The incorporation of H-ALT, H-GGT or H-ALT/H-GGT led to significant improvements of the discriminatory capacity for predicting development of DM in the NRI and IDI (Table 4). The addition of H-GGT to traditional risk factors with H-ALT alone significantly improved the discriminatory capacity in the NRI, and the incorporation of H-ALT into traditional risk factors with H-GGT alone significantly improved the discriminatory capacity in the NRI and IDI (Table 4).
Table 4
Discrimination of the addition of FLI into traditional risk factors for diabetes mellitus
|
AUC |
NRI |
IDI |
| Value (95% CI) |
p |
Value (95% CI) |
p |
Value (95% CI) |
p |
| Traditional model vs. Addition of H-ALT, H-GGT, or H-ALT/H-GGT |
| Traditional model* |
0.864 (0.848–0.880) |
— |
— |
— |
— |
— |
| Traditional model* + H-ALT |
0.866 (0.850–0.882) |
0.106 |
0.493 (0.413–0.572) |
<0.001 |
0.003 (0.001–0.005) |
0.011 |
| Traditional model* + H-GGT |
0.867 (0.851–0.883) |
0.018 |
0.492 (0.412–0.567) |
<0.001 |
0.002 (0.000–0.004) |
0.045 |
| Traditional model* + H-ALT/H-GGT |
0.868 (0.852–0.884) |
<0.001 |
0.505 (0.424–0.586) |
<0.001 |
0.003 (0.001–0.006) |
0.009 |
| ALT vs. ALT/GGT |
| Traditional model* + H-ALT |
0.866 (0.850–0.882) |
— |
— |
— |
— |
— |
| [Traditional model* + H-ALT] + H-GGT |
0.868 (0.852–0.884) |
0.058 |
0.411 (0.332–0.491) |
<0.001 |
0.001 (0.000–0.002) |
0.239 |
| GGT vs. ALT/GGT |
| Traditional model* + H-GGT |
0.867 (0.851–0.883) |
— |
— |
— |
— |
— |
| [Traditional model* + H-GGT] + H-ALT |
0.868 (0.852–0.884) |
0.474 |
0.473 (0.393–0.552) |
<0.001 |
0.002 (0.001–0.003) |
0.047 |
* Traditional model includes age, sex, body mass index, fasting plasma glucose, smoking habit, alcohol drinking habit, family history of diabetes mellitus, and diagnosis of hypertension and dyslipidemia.
ALT, alanine aminotransferase; AUC, area under the curve; CI, confidence interval; GGT, γ-glutamyl transpeptidase; H-, high; IDI, integrated discrimination improvement; L-, low; NRI, net reclassification improvement.
Summary of reclassification for the addition of H-ALT/H-GGT to traditional risk factors is shown in Table 5. When the traditional model with H-ALT + H-GGT was used, 21 subjects were correctly reclassified into a higher risk category, whereas 21 subjects were inappropriately reclassified into a lower risk category among subjects who had developed DM. On the other hand, 852 subjects were correctly reclassified into a lower risk category, and 577 subjects were inappropriately reclassified into a higher risk category among subjects who had not developed DM.
Table 5
Reclassification for the absolute risk for the development of diabetes mellitus
| Number of subjects who developed diabetes mellitus |
|
Traditional model + H-ALT/H-GGT |
| <1% |
1–2% |
2–5% |
>5% |
| Traditional model |
<1% |
17 |
3 |
0 |
0 |
| 1–2% |
0 |
24 |
5 |
0 |
| 2–5% |
0 |
8 |
49 |
13 |
| >5% |
0 |
0 |
13 |
478 |
| Number of subjects who did not develop diabetes mellitus |
|
Traditional model + H-ALT/H-GGT |
| <1% |
1–2% |
2–5% |
>5% |
| Traditional model |
<1% |
2,619 |
136 |
0 |
0 |
| 1–2% |
277 |
2,233 |
236 |
0 |
| 2–5% |
0 |
331 |
2,169 |
205 |
| >5% |
0 |
0 |
244 |
2,040 |
Traditional model includes age, sex, body mass index, fasting plasma glucose, smoking habit, alcohol drinking habit, family history of diabetes mellitus, and diagnosis of hypertension and dyslipidemia. ALT, alanine aminotransferase; GGT, γ-glutamyl transpeptidase; H-, high; L-, low.
Discussion
The present study focused on the significance of a combination of high levels of ALT and GGT for predicting the development of DM during a 10-year follow-up period in a general population including both male and female subjects. Multivariable Cox proportional hazard models with a restricted cubic spline showed that HRs of DM development increased with higher levels of ALT and GGT at baseline in both sexes after adjustment of confounding factors. However, the adjusted risk of ALT alone and that of GGT alone for the development of DM were not significant in female subjects in the present study. Therefore, we further investigated the adjusted HR for the combination of ALT and GGT using cutoff values shown by ROC analyses. The adjusted HR in the H-ALT/H-GGT group was significantly higher than HR in the L-ALT/L-GGT group as the reference in males (HR: 1.73, 95% CI: 1.36–2.20, p < 0.001) but was not significantly higher in females (HR: 1.50, 95% CI: 0.97–2.33, p = 0.065) (Table 3), though there was no significant interaction between sex and the combination of ALT/GGT category for the risk for development of DM in all of the subjects (Supplementary Table S4). The relatively small number of female subjects may have caused a type 2 error since the rate of cumulative incidence of new onset of DM was lower in females than in males (46 [95% CI: 39–54]) vs. 99 [92–107] per 1,000 person-years).
To the best of our knowledge, there have been 3 studies on the association of DM with a combination of levels of ALT and GGT [17, 27, 28]. In a cross-sectional study using 8,863 Korean subjects (male/female: 3,408/5,455), the odds ratio for prevalence of DM (male/female: 2.37/4.20) was significantly higher in the H-ALT (male/female: >23/>20 U/L)/H-GGT (male/female: >47/>23 U/L) group than in the L-ALT/L-GGT group [27]. In a case-control study using 571 patients with type 2 DM (male/female: 236/335) and 571 control subjects (male/female: 236/335) in Singapore, the risk for DM development in the H-ALT (≥21 U/L)/H-GGT (≥23 U/L) group was significantly higher than that in the L-ALT/L-GGT group (odds ratio: 2.47) [28]. In a longitudinal cohort study using only male subjects (n = 2,775), subjects with H-ALT (≥28 U/L)/H-GGT (≥49 U/L) had a significantly higher hazard risk of DM during a 12-year follow-up period than did subjects with L-ALT/L-GGT (HR: 2.0–2.3) [17]. In the present study using a general population including both male and female subjects, it was found that the combination of H-ALT/H-GGT predicts new onset of DM in all of the subjects and that there was no significant interaction of sex with the ALT/GGT category for the risk of DM, though the adjusted HR in the H-ALT/H-GGT group was not significantly higher than HR in the L-ALT/L-GGT group as the reference in females (p = 0.065). Taken together, these findings in both cross-sectional and longitudinal analyses consistently support the notion that a simultaneous elevation of the levels of ALT and GGT is significantly associated with the development of DM in male and female individuals.
In the present study, the addition of the combination of H-ALT/H-GGT to traditional risk factors with and without H-ALT or H-GGT alone significantly improved the discriminatory capability of regression models for predicting development of DM. Previous two studies regarding the association of DM with a combination of levels of ALT and GGT, a study with continuous values of ALT and GGT using only male subjects [17] and a case-control study with low and high ALT/GGT categories [28], also showed the improvement of discriminatory capability for predicting new onset of DM in NRI and IDI. In NRI analysis, the number of correct reclassification (n = 852) was higher than that of inappropriate reclassification (n = 577) in subjects had not developed DM, whereas the numbers of correct and inappropriate reclassifications were the same (n = 21 each) in subjects who had developed DM (Table 5). These findings suggest that the traditional model with H-ALT + H-GGT significantly improves the discriminatory capability, especially specificity, for predicting development of DM.
In the present study, AUCs for cutoff points of ALT and GGT (0.64–0.67) in ROC curve analyses were lower than those of FPG and HbA1c (0.80–0.84) (Fig. 2, Supplementary Fig. S1). In a previous study using 9,748 Japanese subjects, AUCs for cutoff points of ALT and GGT for predicting new onset of DM were 0.71 (95% CI: 0.68–0.74) and 0.67 (95% CI: 0.64–0.69), respectively [29], which were comparable to the results in the present study. Furthermore, AUCs for cutoff points of other markers, including AST (0.64), alkaline phosphatase (0.53), total bilirubin (0.52), fibrosis-4 index (0.51) and AST to platelet ratio index (0.58), were lower than those of ALT (0.71) and GGT (0.67) [29]. As risk factors, but not markers of diagnosis for DM, the AUCs for ALT and GGT (0.64–0.67) in the present study would be appropriate.
Oxidative stress and increased inflammation are implicated in insulin resistance and impaired insulin secretion [30]. Level of ALT is a specific marker of liver dysfunction, and elevated ALT level is strongly correlated with the accumulation of liver fat [12]. Lipid accumulation in the liver may lead to compensatory hyperinsulinemia and secondary pancreatic β-cell failure with progressive hyperglycemia [14]. Furthermore, ALT, known as a gluconeogenic enzyme, has been proposed to be a marker of impaired insulin signaling independent of liver injury [13]. It has also been reported that ALT level is strongly correlated with plasma activity of xanthine oxidoreductase (XOR), which is abundantly expressed in the liver and can increase reactive oxygen species by generating hydrogen peroxide and superoxide [31-33]. On the other hand, GGT is a sensitive, but nonspecific, biomarker of liver dysfunction [11]. GGT is expressed in the surface of cells and mediates intracellular antioxidant defenses via the uptake of glutathione [34]. It has been reported that GGT is directly involved in the generation of reactive oxygen species [15] and it is considered to be a marker of oxidative stress [35]. GGT level has also been reported to be strongly associated with several inflammatory factors including C-reactive protein [16], and elevation of GGT level reflects a state of chronic inflammation [36]. Therefore, elevated levels of ALT and GGT may reflect distinct mechanisms of insulin resistance and/or impaired insulin secretion, and a combination of high levels of ALT and GGT might be strongly relevant to the risk of DM.
The present study has several limitations. First, since a large number of subjects (n = 11,326, 39.1%) was excluded due to missing data for ALT, GGT, FPG or HbA1c at baseline, the possibility of sample selection bias cannot be ruled out. Second, the study subjects did not undergo extensive examinations regarding causes of liver dysfunction, and non-metabolic liver diseases such as viral hepatitis were not ruled out in the present study. Third, accurate information on alcohol consumption was not obtained in the present study. Fourth, information on status of menopause, which may affect results in females, was not available in the present study. Fifth, DM was only diagnosed by a blood test and a self-administered questionnaire survey once a year at most, and casual plasma glucose level and results of an oral glucose tolerance test were not investigated in the present study. Possible underestimated diagnosis of DM may have influenced the outcome. Lastly, family history of DM, which is a strong risk factor for the development of DM [37], was not a significant predictor of new onset of DM in the present study. Exclusion of subjects with DM at baseline might have affected the results.
In conclusion, the risks for development of DM increase with higher levels of ALT and GGT, and the combination of H-ALT/H-GGT efficiently predicts new onset of DM during a 10-year follow-up period in male individuals but not significantly in female individuals.
Acknowledgements
Not applicable.
Conflict of Interest Statement
The authors declare no conflicts of interest.
References
- 1 Saeedi P, Petersohn I, Salpea P, Malanda B, Karuranga S, et al. (2019) Global and regional diabetes prevalence estimates for 2019 and projections for 2030 and 2045: results from the International Diabetes Federation Diabetes Atlas, 9 th edition. Diabetes Res Clin Pract 157: 107843.
- 2 Moon AM, Singal AG, Tapper EB (2020) Contemporary epidemiology of chronic liver disease and cirrhosis. Clin Gastroenterol Hepatol 18: 2650–2666.
- 3 Amarapurkar DN, Hashimoto E, Lesmana LA, Sollano JD, Chen PJ, et al. (2007) How common is non-alcoholic fatty liver disease in the Asia-Pacific region and are there local differences? J Gastroenterol Hepatol 22: 788–793.
- 4 Younossi ZM, Koenig AB, Abdelatif D, Fazel Y, Henry L, et al. (2016) Global epidemiology of nonalcoholic fatty liver disease-meta-analytic assessment of prevalence, incidence, and outcomes. Hepatology 64: 73–84.
- 5 Williams KH, Shackel NA, Gorrell MD, McLennan SV, Twigg SM (2013) Diabetes and nonalcoholic Fatty liver disease: a pathogenic duo. Endocr Rev 34: 84–129.
- 6 Holstein A, Hinze S, Thiessen E, Plaschke A, Egberts EH (2002) Clinical implications of hepatogenous diabetes in liver cirrhosis. J Gastroenterol Hepatol 17: 677–681.
- 7 Lidofsky SD (2008) Nonalcoholic fatty liver disease: diagnosis and relation to metabolic syndrome and approach to treatment. Curr Diab Rep 8: 25–30.
- 8 Lo L, McLennan SV, Williams PF, Bonner J, Chowdhury S, et al. (2011) Diabetes is a progression factor for hepatic fibrosis in a high fat fed mouse obesity model of non-alcoholic steatohepatitis. J Hepatol 55: 435–444.
- 9 Zhang J, Cheng N, Ma Y, Li H, Cheng Z, et al. (2018) Liver enzymes, fatty liver and type 2 diabetes mellitus in a Jinchang Cohort: a prospective study in adults. Can J Diabetes 42: 652–658.
- 10 Kunutsor SK, Apekey TA, Walley J (2013) Liver aminotransferases and risk of incident type 2 diabetes: a systematic review and meta-analysis. Am J Epidemiol 178: 159–171.
- 11 Kunutsor SK, Abbasi A, Adler AI (2014) Gamma-glutamyl transferase and risk of type II diabetes: an updated systematic review and dose-response meta-analysis. Ann Epidemiol 24: 809–816.
- 12 Kim CH, Park JY, Lee KU, Kim JH, Kim HK (2009) Association of serum gamma-glutamyltransferase and alanine aminotransferase activities with risk of type 2 diabetes mellitus independent of fatty liver. Diabetes Metab Res Rev 25: 64–69.
- 13 Vozarova B, Stefan N, Lindsay RS, Saremi A, Pratley RE, et al. (2002) High alanine aminotransferase is associated with decreased hepatic insulin sensitivity and predicts the development of type 2 diabetes. Diabetes 51: 1889–1895.
- 14 Kawaguchi T, Taniguchi E, Itou M, Sakata M, Sumie S, et al. (2011) Insulin resistance and chronic liver disease. World J Hepatol 3: 99–107.
- 15 Stark AA, Zeiger E, Pagano DA (1993) Glutathione metabolism by gamma-glutamyltranspeptidase leads to lipid peroxidation: characterization of the system and relevance to hepatocarcinogenesis. Carcinogenesis 14: 183–189.
- 16 Lee DH, Jacobs DR Jr (2005) Association between serum gamma-glutamyltransferase and C-reactive protein. Atherosclerosis 178: 327–330.
- 17 Kaneko K, Yatsuya H, Li Y, Uemura M, Chiang C, et al. (2019) Association of gamma-glutamyl transferase and alanine aminotransferase with type 2 diabetes mellitus incidence in middle-aged Japanese men: 12-year follow up. J Diabetes Investig 10: 837–845.
- 18 Ford ES, Schulze MB, Bergmann MM, Thamer C, Joost HG, et al. (2008) Liver enzymes and incident diabetes: findings from the European Prospective Investigation into Cancer and Nutrition (EPIC)-Potsdam Study. Diabetes Care 31: 1138–1143.
- 19 Higashiura Y, Tanaka M, Furuhashi M, Koyama M, Ohnishi H, et al. (2020) Low urine pH predicts new onset of diabetes mellitus during a 10-year period in men: BOREAS-DM1 study. J Diabetes Investig 11: 1490–1497.
- 20 Mori K, Furuhashi M, Tanaka M, Numata K, Hisasue T, et al. (2021) U-shaped relationship between serum uric acid level and decline in renal function during a 10-year period in female subjects: BOREAS-CKD2. Hypertens Res 44: 107–116.
- 21 American Diabetes Association (2017) 2. Classification and Diagnosis of Diabetes. Diabetes Care 40(suppl 1): S11–S24.
- 22 Matsuo S, Imai E, Horio M, Yasuda Y, Tomita K, et al. (2009) Revised equations for estimated GFR from serum creatinine in Japan. Am J Kidney Dis 53: 982–992.
- 23 Schisterman EF, Perkins NJ, Liu A, Bondell H (2005) Optimal cut-point and its corresponding Youden Index to discriminate individuals using pooled blood samples. Epidemiology 16: 73–81.
- 24 DeLong ER, DeLong DM, Clarke-Pearson DL (1988) Comparing the areas under two or more correlated receiver operating characteristic curves: a nonparametric approach. Biometrics 44: 837–845.
- 25 Pencina MJ, D’Agostino RB Sr, Steyerberg EW (2011) Extensions of net reclassification improvement calculations to measure usefulness of new biomarkers. Stat Med 30: 11–21.
- 26 Kanda Y (2013) Investigation of the freely available easy-to-use software ‘EZR’ for medical statistics. Bone Marrow Transplant 48: 452–458.
- 27 Ko SH, Baeg MK, Han KD, Ko SH, Ahn YB (2015) Increased liver markers are associated with higher risk of type 2 diabetes. World J Gastroenterol 21: 7478–7487.
- 28 Wang YL, Koh WP, Yuan JM, Pan A (2016) Association between liver enzymes and incident type 2 diabetes in Singapore Chinese men and women. BMJ Open Diabetes Res Care 4: e000296.
- 29 Hatano Y, Inoue K, Kashima S, Matsumoto M, Akimoto K (2020) Serum alanine transaminase as a predictor of type 2 diabetes incidence: the yuport prospective cohort study. Tohoku J Exp Med 251: 183–191.
- 30 Fraser A, Harris R, Sattar N, Ebrahim S, Davey Smith G, et al. (2009) Alanine aminotransferase, gamma-glutamyltransferase, and incident diabetes: the British Women’s Heart and Health Study and meta-analysis. Diabetes Care 32: 741–750.
- 31 Furuhashi M, Matsumoto M, Tanaka M, Moniwa N, Murase T, et al. (2018) Plasma xanthine oxidoreductase activity as a novel biomarker of metabolic disorders in a general population. Circ J 82: 1892–1899.
- 32 Furuhashi M, Koyama M, Matsumoto M, Murase T, Nakamura T, et al. (2019) Annual change in plasma xanthine oxidoreductase activity is associated with changes in liver enzymes and body weight. Endocr J 66: 777–786.
- 33 Furuhashi M (2020) New insights into purine metabolism in metabolic diseases: role of xanthine oxidoreductase activity. Am J Physiol Endocrinol Metab 319: E827–E834.
- 34 Goldberg DM (1980) Structural, functional, and clinical aspects of gamma-glutamyltransferase. CRC Crit Rev Clin Lab Sci 12: 1–58.
- 35 Lee DH, Blomhoff R, Jacobs DR Jr (2004) Is serum gamma glutamyltransferase a marker of oxidative stress? Free Radic Res 38: 535–539.
- 36 Ceriello A, Motz E (2004) Is oxidative stress the pathogenic mechanism underlying insulin resistance, diabetes, and cardiovascular disease? The common soil hypothesis revisited. Arterioscler Thromb Vasc Biol 24: 816–823.
- 37 Lascar N, Brown J, Pattison H, Barnett AH, Bailey CJ, et al. (2018) Type 2 diabetes in adolescents and young adults. Lancet Diabetes Endocrinol 6: 69–80.