Abstract
Metabolically Healthy Obesity (MHO) is generally recognized as the absence of any metabolic disorders and cardiovascular diseases, including type 2 diabetes, dyslipidemia, and hypertension, in obese individuals; however, it is not clearly defined. Therefore, the present study investigated differences in metabolic characteristics between individuals with MHO and Metabolically Unhealthy Obesity (MUO) during weight reduction therapy. The key factors defining MHO and the importance of weight reduction therapy for MHO were also examined. Cohort data from the Japan Obesity and Metabolic Syndrome (JOMS) study were analyzed. Subjects were divided into the MHO (n = 25) and MUO (n = 120) groups. Prior to weight reduction therapy, serum adiponectin levels were significantly higher in the MHO group than in the MUO group. Serum adiponectin levels also negatively correlated with the area of subcutaneous adipose tissue (SAT) and Homeostasis model assessment (HOMA)-R in the MHO group, but not in the MUO group. Collectively, the present results suggest the importance of adiponectin for maintaining metabolic homeostasis in the MHO group. On the other hand, no significant differences were observed in inflammatory markers between the MHO and MUO groups, suggesting the presence of chronic inflammation in both groups. Furthermore, a positive correlation was noted between changes in serum cystatin C levels and waist circumference in the MHO group, which indicated that despite the absence of metabolic disorders, the MHO group exhibited anti-inflammatory responses during weight reduction therapy. These results underscore the significance of weight reduction even for individuals with MHO.
OBESITY has become a global issue and is associated with various health issues, such as atherosclerotic cardiovascular diseases (ASCVD) and cancer [1, 2]. Metabolically Healthy Obesity (MHO) was defined in the 1950s as obesity in individuals without risk factors for ASCVD. The definition of MHO is based on the absence of any components of metabolic syndrome (Mets) and/or the presence of normal insulin sensitivity, as evaluated using Homeostasis model assessment (HOMA)-R [3-6]. A more detailed understanding of the mechanisms maintaining metabolic homeostasis in MHO may provide insights into the pathophysiology linking obesity and ASCVD. On the other hand, Metabolically Unhealthy Obesity (MUO) is distinguished by the presence of high-risk factors for ASCVD. Additionally, the concept of “Metabolically Unhealthy Normal Obesity” has been reported for individuals with a normal body mass index (BMI), but with an increased risk of ASCVD [4, 5]. Stefan et al. proposed the use of the waist-to-hip ratio to define metabolic health due to its superior sensitivity to waist circumference (WC) or BMI for predicting ASCVD among individuals with obesity [6]. However, it is currently unclear whether MHO and MUO are completely different metabolic states or if MUO is a continuum condition caused by the exacerbation of MHO. Furthermore, it has not yet been established whether MHO requires weight reduction therapy. Therefore, the present study investigated variations in the metabolic characteristics of MHO and MUO throughout weight reduction therapy. To achieve this, we analyzed cohort data from the Japan Obesity and Metabolic Syndrome (JOMS) study, a comprehensive and multi-center research initiative involving Japanese patients with obesity undergoing weight reduction therapy. JOMS study incorporates cross-sectional and prospective research designs to achieve its objectives [7]. Patients were enrolled in JOMS study, and the present study was conducted as part of the Kyoto Diabetes and Obesity Registry study (DOR-KyotoJ).
Materials and Methods
Subjects
A total of 760 Japanese outpatients with obesity, comprising 338 males and 422 females with a mean age of 51 years, were consecutively enrolled in JOMS study between 2005 and 2010 [7]. The study was registered with the University Hospital Medical Information Network Clinical Trial Registry system with an ID of UMIN000000559. Approval for the present study was granted by the Ethics Committee for human research at the Kyoto Medical Center (approval number: 14-034). This study was conducted in accordance with the principles of the Declaration of Helsinki and the Ethical Guidelines for Medical and Health Research Involving Human Subjects. Written informed consent was obtained from all participants. The objective of the present study was to examine the characteristics of Mets and the success rate and effects of weight reduction therapy with diet and exercise guidelines for the prevention of cardiovascular disease (CVD) in Japanese patients with obesity. We recruited obese subjects with BMI >25 kg/m2 [8]. Subjects with a history of severe liver dysfunction, CVD, other vascular diseases, or apparent renal disease were excluded from the present study [7]. We also excluded subjects who did not meet the criteria for abdominal obesity, defined as WC ≥85 cm for males and ≥90 cm for females, according to the Japanese criteria for Mets [9]. Subjects were further categorized into MHO and MUO. Specifically, MHO subjects were defined as those who had no apparent metabolic disorder and ASCVD, including type 2 diabetes, dyslipidemia, or hypertension. MUO subjects were defined as those who had at least two of the following three metabolic abnormalities according to the United States National Cholesterol Education Program-Adult Treatment Panel III: 1) high blood glucose, 2) dyslipidemia, and 3) high blood pressure. High blood glucose was defined as a fasting blood glucose level ≥100 mg/dL, dyslipidemia as a fasting serum triglyceride (TG) level ≥150 mg/dL or high-density lipoprotein-cholesterol (HDL-C) <40 mg/dL for males and <50 mg/dL for females, and high blood pressure as systolic blood pressure (SBP) ≥130 mmHg and diastolic blood pressure (DBP) ≥85 mmHg. Patients who were taking medication for diabetes, dyslipidemia, or hypertension were excluded from the present study. We aimed to eliminate all metabolic effects of medications because statins have been shown to impair pancreatic beta cell function and decrease serum adiponectin levels [10, 11] and some antihypertensive agents may improve adipose tissue function and insulin resistance [12, 13].
Data collection and laboratory assay
Height and weight were measured to calculate BMI and WC was measured at the level of the umbilicus in the standing position. The Tanita body fat analyzer (Tanita Corporation, Tokyo, Japan) was used to assess total body fat percentage (% fat) by bio-impedance. SBP and DBP were measured twice using an automatic electronic sphygmomanometer (BP-103iII; Nippon Colin, Komaki, Japan). Blood samples were collected in the morning after a 12-hour fast without medication to measure fasting levels of plasma glucose (FPG), HbA1c, immunoreactive insulin (IRI), serum LDL-C, HDL-C, TG, leptin, and adiponectin. The estimated glomerular filtration rate (eGFR) was calculated using the new Japanese coefficient for the abbreviated Modification of Diet in Renal Disease Study equation, with a correction factor of 0.739 for women. Serum high-sensitivity C-reactive protein (hsCRP) levels were assessed using an enzyme-linked immunosorbent assay (Assay Pro, St. Charles, MO, USA) according to the manufacturer’s instructions. HOMA-R and HOMA-β were evaluated using the homeostasis model assessment. IRI was measured using an enzyme immunoassay (Tosoh, Tokyo, Japan), while serum adiponectin levels were assessed using enzyme-linked immunosorbent assays (Assay Pro, St. Charles, MO, USA and Otsuka Pharmaceutical, Tokyo, Japan). Serum leptin levels were evaluated using a radioimmunoassay (Linco Research, St. Charles, MO, USA), while the cardio-ankle vascular index (CAVI) was measured using a Vasera VS-1000 vascular screening system (Fukuda Denshi, Tokyo, Japan). Abdominal computed tomography was used to measure the areas of subcutaneous adipose tissue (SAT) and visceral adipose tissue (VAT). Serum amyloid A (SAA)-LDL and alpha 1-antitrypsin-LDL (α1AT-LDL) levels were assessed as previously described (Ikagaku, Kyoto, Japan) [14], while serum cystatin C levels were evaluated using a latex particle-enhanced immunoturbidimetric assay (Ikagaku, Kyoto, Japan) [15].
Weight Reduction Therapy
Seven hundred and sixty obese Japanese outpatients (338 males and 422 females), with a mean age of 51 years and mean BMI of 30 kg/m2, were enrolled in JOMS study and received weight reduction therapy through lifestyle modifications aimed at reducing energy intake and increasing physical activity for a period of three months. The prescribed diet consisted of 25 kcal/kg of the ideal body weight (BW) per day, and subjects were instructed to exercise for at least 30 minutes at a moderate intensity at least 3 days per week [16, 17]. We explained to patients that walking for 30 minutes at a pace of approximately 100 steps per minute constituted exercise of moderate intensity. Before and after weight reduction therapy, we measured BMI, WC, % fat, SBP, and DBP and conducted laboratory tests on each patient. Diet and exercise records were monitored to ensure compliance.
Statistical Analysis
Continuous and parametric data are presented as the mean ± standard deviation and non-parametric data as medians (min-max). Categorical variables were summarized as a percentage. The chi-squared test was used to examine the distribution of categorical values between groups. The Student’s two-tailed t-test was employed to examine differences in the number of males and females and the t-test to assess differences in the area of SAT between MHO and MUO. The Mann-Whitney U test was performed for other comparisons between the two groups. The paired-sample t-test was used to analyze differences in % fat between two paired groups before and three months after weight reduction therapy. The Wilcoxon signed-rank test was performed for other comparisons between the two paired groups. Spearman’s correlation test was used to investigate two relationships. The Shapiro-Wilk test was conducted to establish whether continuous variables were normally distributed. p < 0.05 was considered to be significant. All statistical analyses were performed using SPSS 28.0 for Macintosh (SPSS Inc., Chicago, IL, USA).
Results
Among 760 participants in the JOMS study who met the selection criteria, 467 taking medication for metabolism-related conditions (such as hypoglycemic, antihypertensive, or lipid-lowering agents) and 107 with only one of the three metabolic abnormalities were excluded. The remaining subjects were divided into two groups: MHO (n = 25, 3% of all participants) and MUO (n = 120, 16% of all participants). No significant differences were observed in age or sex between the two groups (Fig. 1 and Table 1).
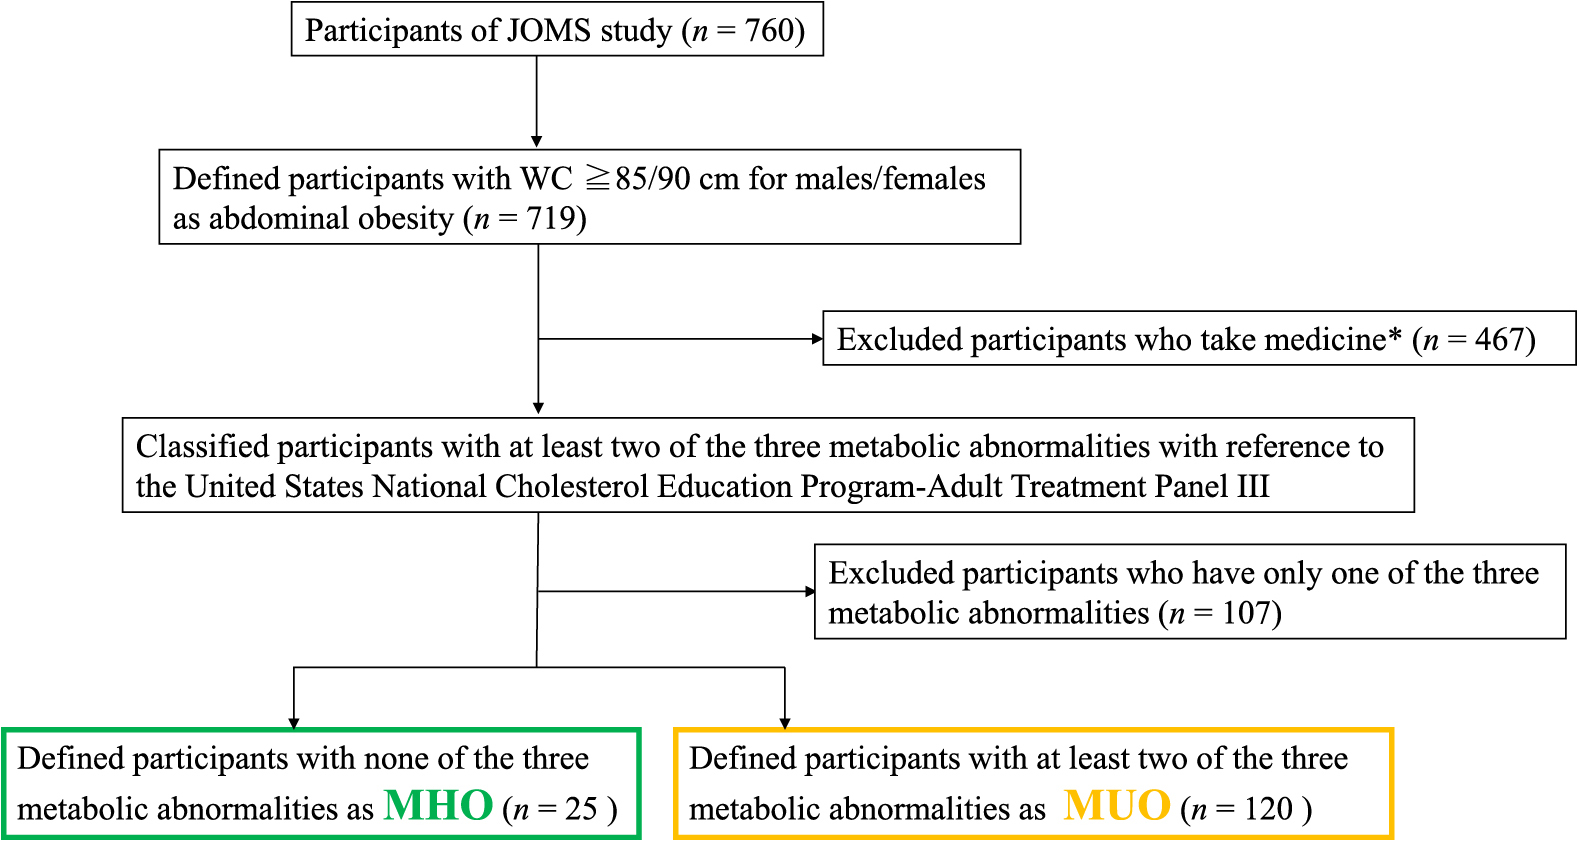
Table 1
Baseline characteristics categorized by MHO and MUO
| Variable |
MHO (n = 25) |
MUO (n = 120) |
p value |
| Age (years) |
37.0 (11–70) |
39.5 (14–82) |
0.271 |
| Male/Female |
12/13 |
65/55 |
0.843 |
| BW (kg) |
79.7 (54–128) |
84.5 (53–173) |
0.679 |
| BMI (kg/m2) |
30.4 (25.0–48.8) |
31.8 (25.0–59.2) |
0.477 |
| WC (cm) |
99.5 (87.5–130.8) |
102 (85.5–165) |
0.197 |
| % fat (%) |
36.0 ± 7.2 |
37.8 ± 9.8 |
0.455 |
| VAT (cm2) |
137 (98–278) |
129 (52–304) |
0.456 |
| SAT (cm2) |
362 ± 144 |
303 ± 115 |
0.128 |
| V/S |
0.5 (0.2–0.8) |
0.5 (0.1–1.5) |
0.733 |
| SBP (mmHg) |
120 (104–128) |
140 (80–175) |
<0.001*** |
| DBP (mmHg) |
76 (43–83) |
87 (57–121) |
<0.001*** |
| eGFR (mL/min/1.73 m2) |
91.6 (68.9–265) |
85.8 (30.9–177) |
0.302 |
| FPG (mg/dL) |
84 (66–98) |
107 (77–314) |
<0.001*** |
| HbA1c (%) |
5.3 (4.5–5.7) |
5.6 (4.5–12.5) |
0.004** |
| IRI (μU/mL) |
12.7 (4.3–41.9) |
15.5 (2.0–160.4) |
0.028* |
| HOMA-R |
2.5 (0.9–8.4) |
4.6 (0.6–62.2) |
0.001** |
| HOMA-β |
189 (65–3,048) |
139 (15–130) |
0.082 |
| TG (mg/dL) |
92 (54–145) |
166 (55–1,452) |
<0.001*** |
| HDL-C (mg/dL) |
58 (44–98) |
50 (30–103) |
0.007** |
| LDL-C (mg/dL) |
116 (54–204) |
129 (69–257) |
0.001** |
| adiponectin (μg/mL) |
7.5 (2.8–12.9) |
5.6 (1.0–35.9) |
0.008** |
| leptin (ng/mL) |
12.7 (2.3–55.4) |
17.4 (1.3–135.7) |
0.340 |
| CAVI |
6.5 (4.9–10.7) |
6.6 (3.7–11.4) |
0.967 |
| cystatin C (mg/L) |
0.71 (0.46–1.03) |
0.74 (0.35–2.27) |
0.355 |
| SAA-LDL (μg/mL) |
26 (12–381) |
29 (7–399) |
0.265 |
| α1AT-LDL (μg/mL) |
3.2 (1.5–5.5) |
2.9 (1.0–7.5) |
0.472 |
| hsCRP (μg/mL) |
0.78 (0.003–5.68) |
1.12 (0.04–29.49) |
0.162 |
Data are expressed as the mean ± SD, median (min, max). BW: body weight, BMI: body mass index, WC: waist circumference, SBP: systolic blood pressure, DBP: diastolic blood pressure, Cre: creatinine, eGFR: estimated glomerular filtration, FPG: fasting plasma glucose, IRI: immunoreactive insulin, % fat: percentage total body fat, VAT: Visceral adipose tissue area, SAT: Subcutaneous adipose tissue area, V/S: VAT-to-SAT ratio, HOMA: homeostasis model assessment, TG: triglyceride, HDL-C: high-density lipoprotein-cholesterol, LDL-C: low-density lipoprotein-cholesterol, CAVI: cardio-ankle vascular index, SAA-LDL: serum amyloid A-LDL, α1AT-LDL: alpha1-antitrypsin-LDL, hsCRP: high sensitivity C reactive protein.
Asterisks indicate a statistical significance (* p < 0.05, ** p < 0.01, *** p < 0.001).
At baseline, significant differences were observed in blood pressure, FPG, HbA1c, and lipids between the MHO and MUO groups, while there were no significant differences in BW, BMI, WC, % fat, or SAT or VAT areas. Additionally, no significant differences were noted in CAVI, serum cystatin C, hsCRP, SAA-LDL, or α1AT-LDL levels between the two groups. However, serum adiponectin levels were significantly higher in the MHO group than in the MUO group (Table 1).
Before weight reduction therapy, IRI and HOMA-R were significantly higher in the MUO group than in the MHO group (7.5 vs. 5.8 μg/mL, p = 0.008) (Table 1). After weight reduction therapy, WC significantly decreased in both the MHO and MUO groups, and BW was significantly reduced in the MUO group (Table 2). The MHO and MUO groups both exhibited a significant increase in serum adiponectin levels. The MUO group showed a marked decrease in HOMA-R, suggesting an improvement in insulin resistance. However, inflammatory markers, such as serum cystatin C, hsCRP, SAA-LDL, and α1AT-LDL levels, did not significantly differ in either group after weight reduction therapy (Table 2).
Table 2
Differences in metabolic parameters between before and three months after weight reduction
| Variable |
MHO |
MUO |
| before |
3 months after |
p value |
before |
3 months after |
p value |
| BW |
79.7 (54–128) |
78.7 (52–133) |
0.065 |
84.5 (53–173) |
81.1 (60–155) |
<0.001*** |
| WC |
99.5 (87.5–130.8) |
98.5 (76.0–131.0) |
0.049* |
102 (85.5–165.0) |
98.5 (79.0–160.0) |
<0.001*** |
| % fat |
36.0 ± 7.2 |
31.5 ± 7.0 |
0.11 |
37.8 ± 9.8 |
34.6 ± 9.5 |
0.144 |
| IRI |
12.7 (4.3–41.9) |
10.7 (3.1–151.3) |
0.182 |
15.5 (2.0–160.4) |
12.9 (2.0–16.2) |
<0.001*** |
| HOMA-R |
2.5 (0.9–8.4) |
2.4 (0.6–71.4) |
0.117 |
4.6 (0.6–62.2) |
3.3 (0.4–41.9) |
<0.001*** |
| HOMA-β |
189 (65–3,048) |
167 (67–426) |
0.388 |
139 (15–130) |
109 (–87–1,128) |
0.054 |
| adiponectin |
7.5 (2.8–12.9) |
9.0 (4.1–18.8) |
0.034* |
5.6 (1.0–35.9) |
6.4 (2.3–19.0) |
0.001** |
| leptin |
12.7 (2.3–55.4) |
14.0 (1.4–24.8) |
0.213 |
17.4 (1.3–135.7) |
8.4 (1.0–75.1) |
0.002** |
| cystatin C |
0.71 (0.46–1.03) |
0.72 (0.58–0.86) |
0.944 |
0.74 (0.35–2.27) |
0.75 (0.48–2.22) |
0.154 |
| SAA-LDL |
26 (12–381) |
32 (9–162) |
0.059 |
29 (7–399) |
26 (4–154) |
0.664 |
| α1AT-LDL |
3.2 (1.5–5.5) |
2.9 (2.0–6.0) |
0.875 |
2.9 (1.0–7.5) |
2.9 (1.3–6.6) |
0.774 |
| hsCRP |
0.78 (0.003–5.68) |
0.76 (0.34–5.42) |
0.79 |
1.12 (0.04–29.49) |
0.68 (0.081–17.78) |
0.073 |
BW: body weight, WC: waist circumference, % fat: percentage total body fat, IRI: immunoreactive insulin, HOMA: homeostasis model assessment, LDL: low-density lipoprotein, SAA: serum amyloid A, α1AT: alpha1-antitrypsin, hsCRP: high sensitivity C reactive protein. Asterisks indicate a statistical significance (* p < 0.05, ** p < 0.01, *** p < 0.001).
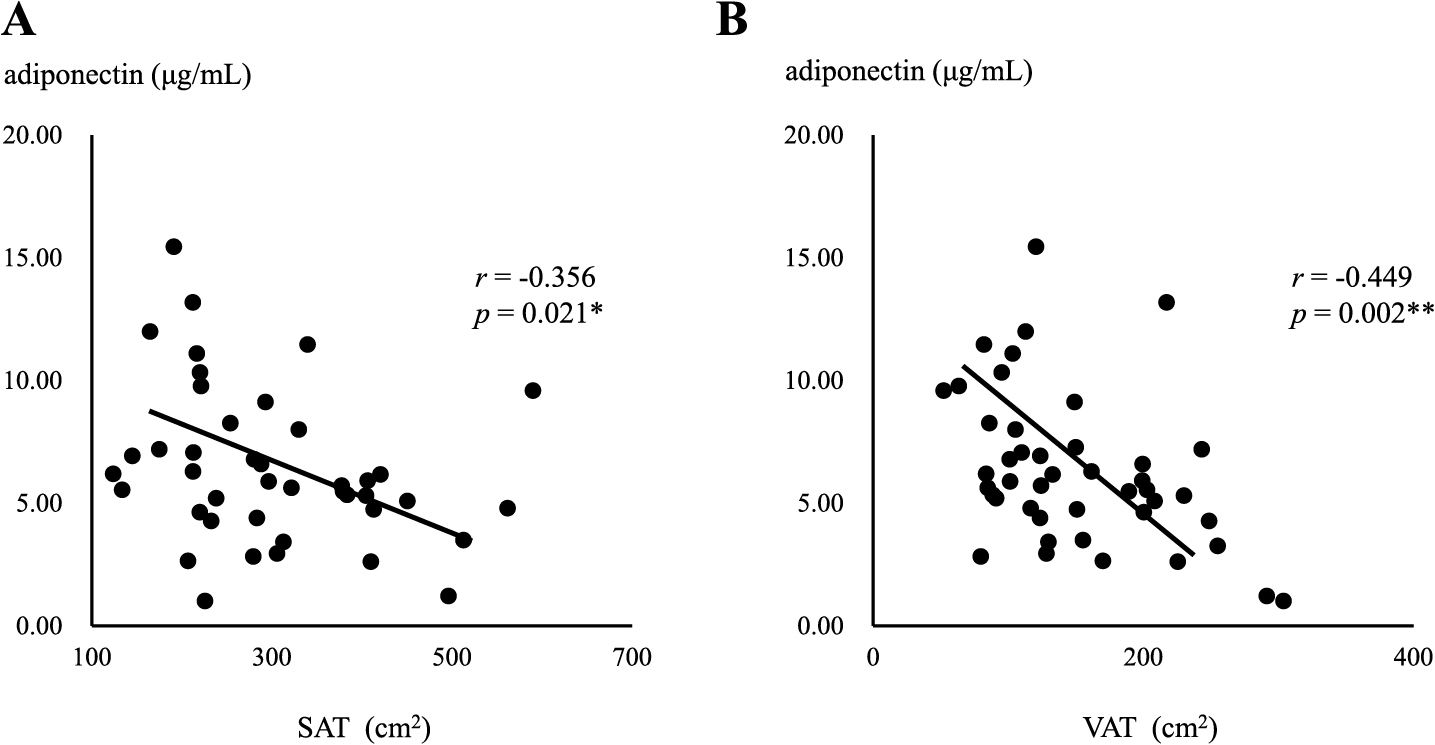
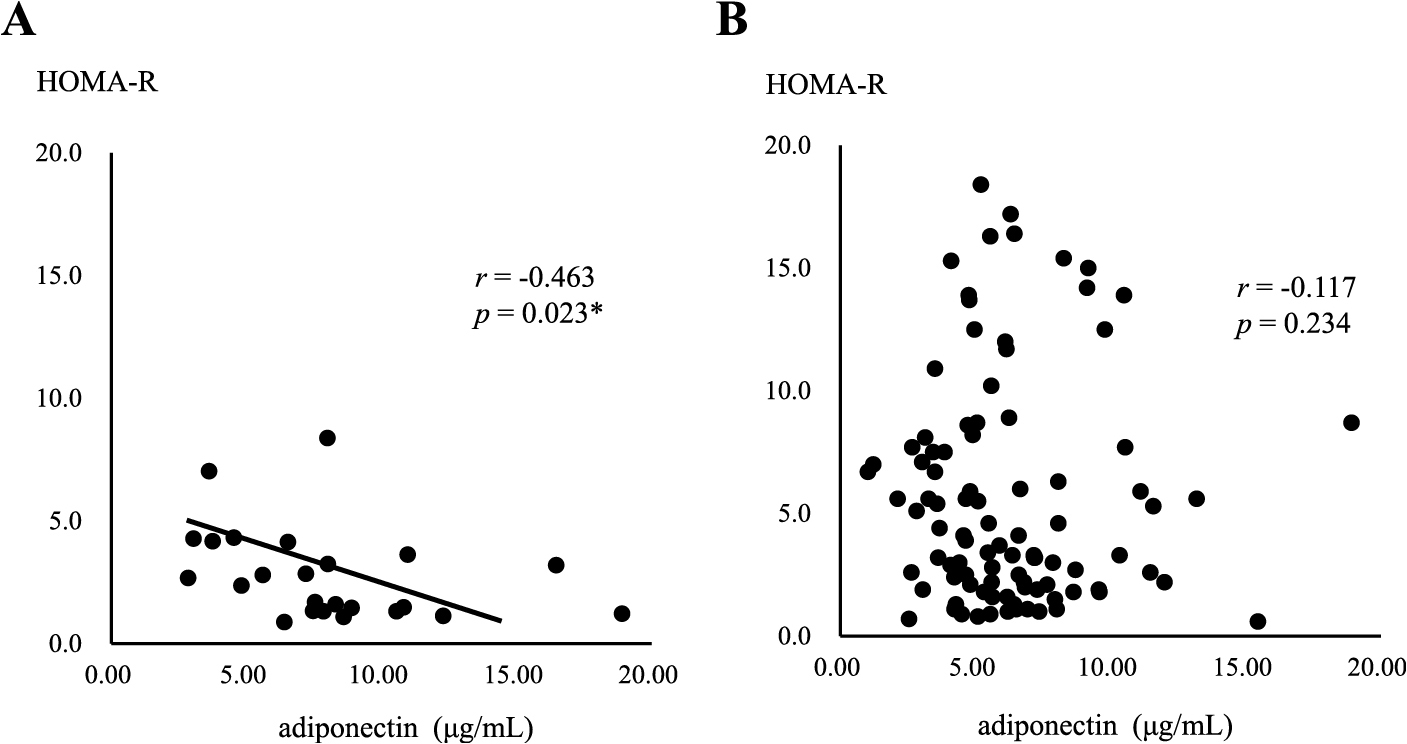
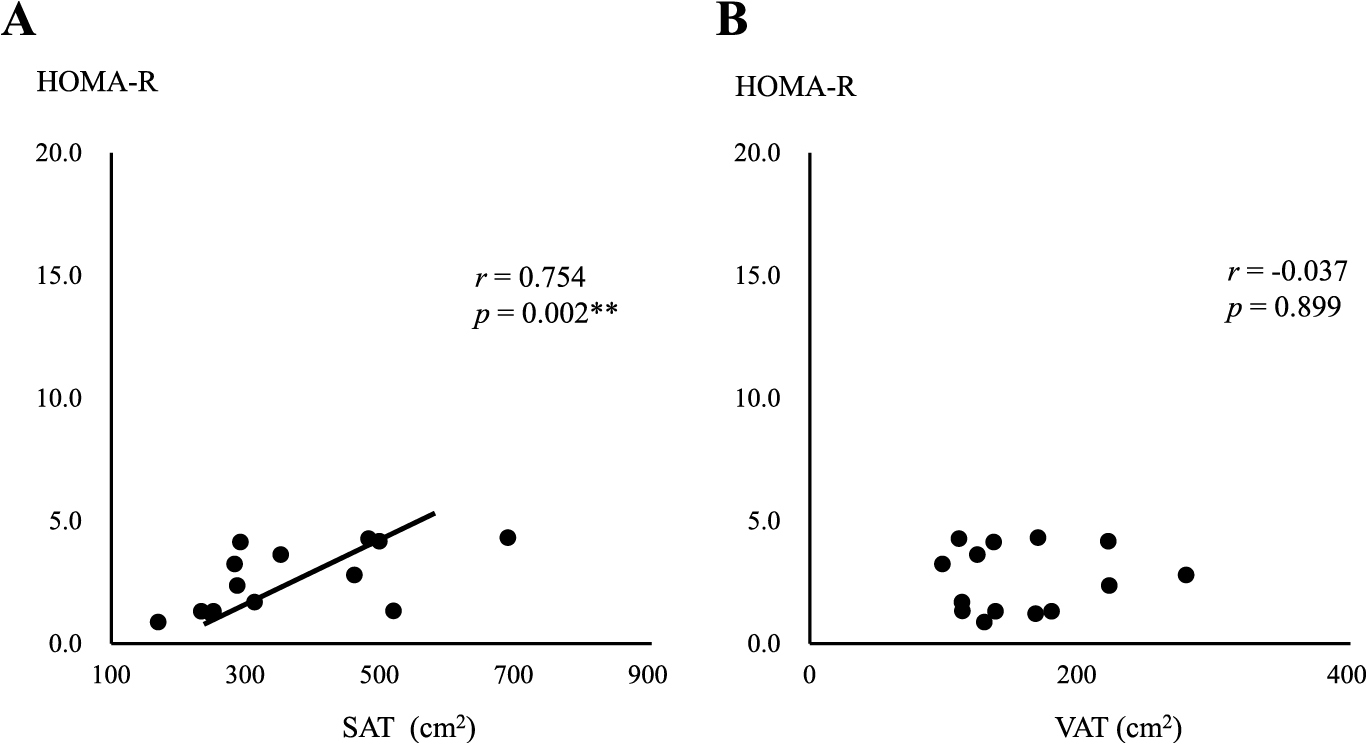
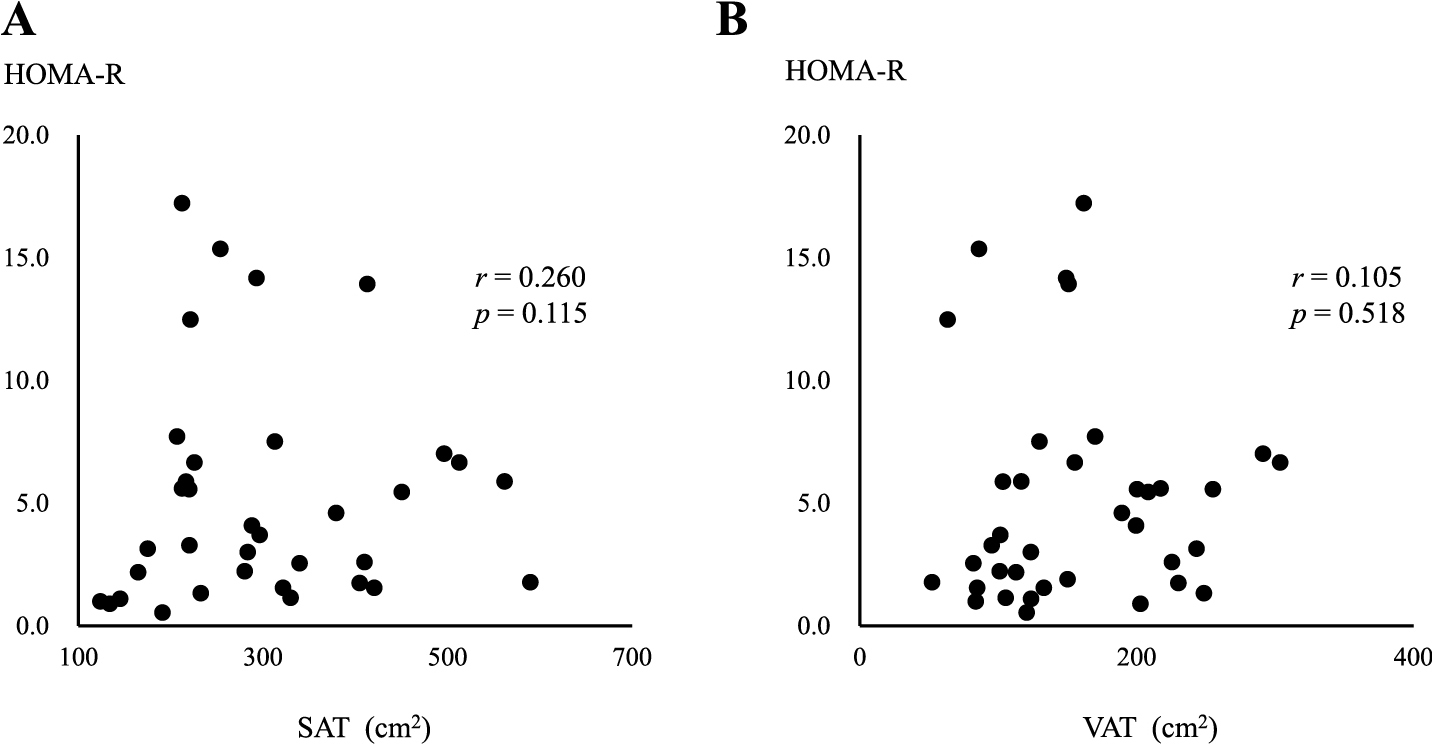
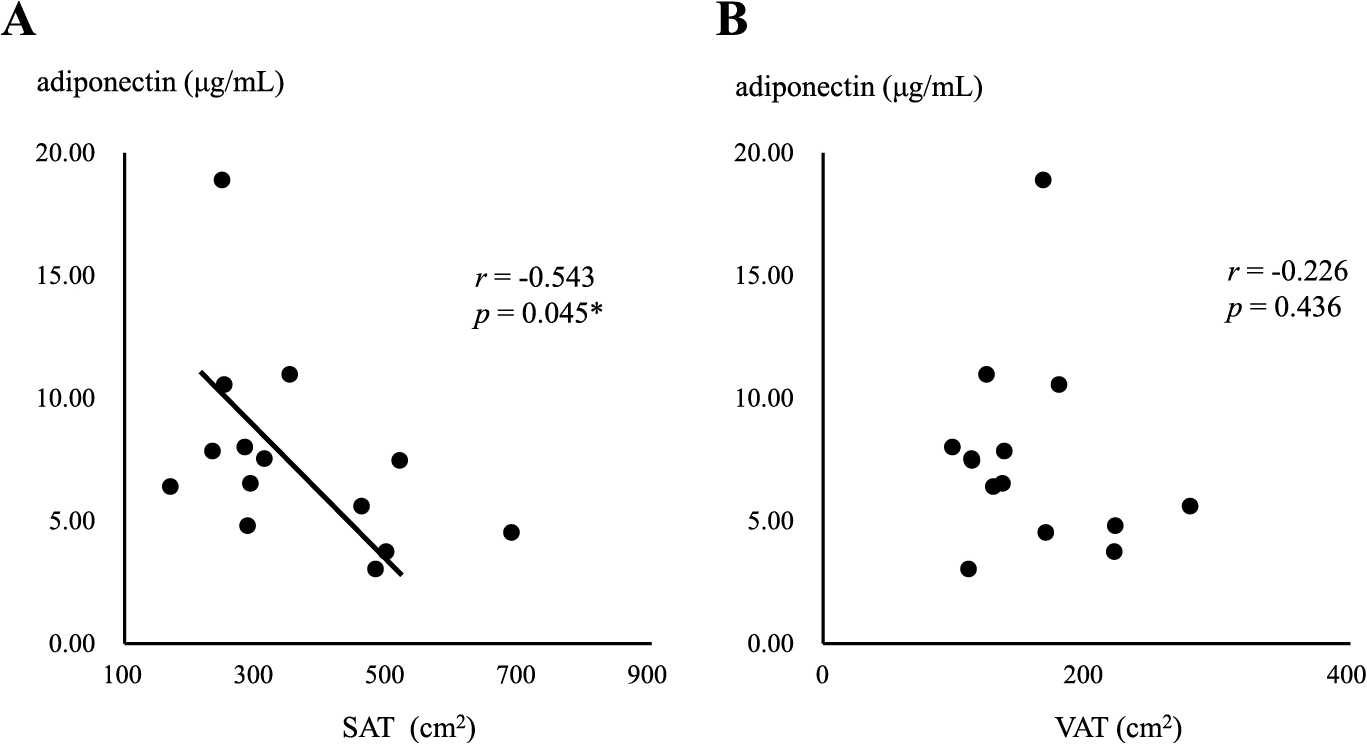
In the MHO group, a negative correlation was observed between serum adiponectin levels and the area of SAT (r = –0.543, p = 0.045) (Fig. 2A), but not the area of VAT (Fig. 2B). In contrast, serum adiponectin levels negatively correlated with both SAT and VAT areas in the MUO group (r = –0.356, p = 0.021, r = –0.449, p = 0.002, respectively) (Fig. 3A and B), with a stronger correlation being observed between serum adiponectin levels and the area of VAT (Fig. 3B). Serum adiponectin levels negatively correlated with HOMA-R in the MHO group, but not in the MUO group (r = –0.463, p = 0.023, r = –0.117, p = 0.234, respectively) (Fig. 4A and B). Furthermore, HOMA-R positively correlated with the area of SAT (r = 0.754, p = 0.002) (Fig. 5A), but not that of VAT (r = –0.037, p = 0.899) in the MHO group (Fig. 5B). In contrast, HOMA-R did not correlate with the area of SAT or VAT in the MUO group (r = 0.260, p = 0.115, r = 0.105, p = 0.518, respectively) (Fig. 6A and B).
Changes in BW (ΔBW loss) positively correlated with reductions in serum cystatin C (Δcystatin C) and SAA-LDL (ΔSAA-LDL) levels in the MUO group, as shown in Fig. 7 and Table 3A (right column). ΔBW loss positively correlated with reductions in IRI (ΔIRI), HOMA-R (ΔHOMA-R), and HOMA-β (ΔHOMA-β) in the MHO group, but not in the MUO group (Table 3A). In the MUO group, ΔBW loss positively correlated with reductions in % fat (Δ% fat) and serum leptin levels (Δleptin), and negatively correlated with changes in serum adiponectin levels (Δadiponectin) (Table 3A, right column). In the MHO group, ΔBW loss positively correlated with Δleptin, but not with Δ% fat, and negatively correlated with Δadiponectin (Table 3A, left column).
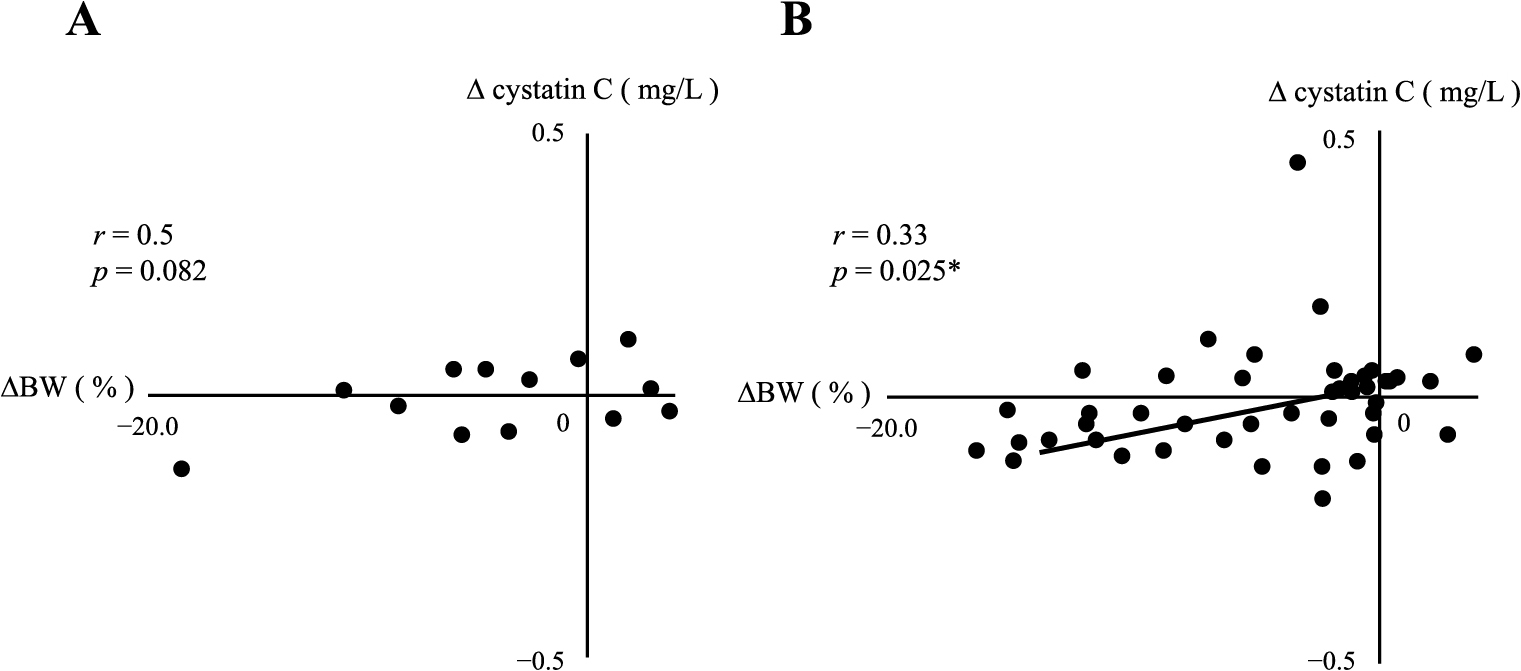
Table 3A
Correlation between changes in BW and metabolic parameters
|
MHO |
MUO |
| r |
p |
r |
p |
| Δcystatin C |
0.50 |
0.082 |
0.33 |
0.025* |
| ΔSAA-LDL |
0.30 |
0.3 |
0.35 |
0.014* |
| Δα1AT-LDL |
–0.2 |
0.5 |
0.21 |
0.095 |
| ΔhsCRP |
0.00 |
1.00 |
0.173 |
0.211 |
| Δ% fat |
0.13 |
0.442 |
0.30 |
0.028* |
| ΔIRI |
0.61 |
0.037* |
0.09 |
0.522 |
| ΔHOMA-R |
0.60 |
0.039* |
0.15 |
0.291 |
| ΔHOMA-β |
0.67 |
0.017* |
0.20 |
0.140 |
| Δadiponectin |
–0.62 |
0.031* |
–0.36 |
0.006** |
| Δleptin |
0.61 |
0.047* |
0.64 |
<0.001*** |
LDL: low-density lipoprotein, SAA: serum amyloid A, α1AT: alpha1-antitrypsin, hsCRP: high sensitivity C reactive protein, % fat: percentage total body fat, IRI: immunoreactive insulin, HOMA: homeostasis model assessment. Asterisks indicate a statistical significance (* p < 0.05, ** p < 0.01, *** p < 0.001).
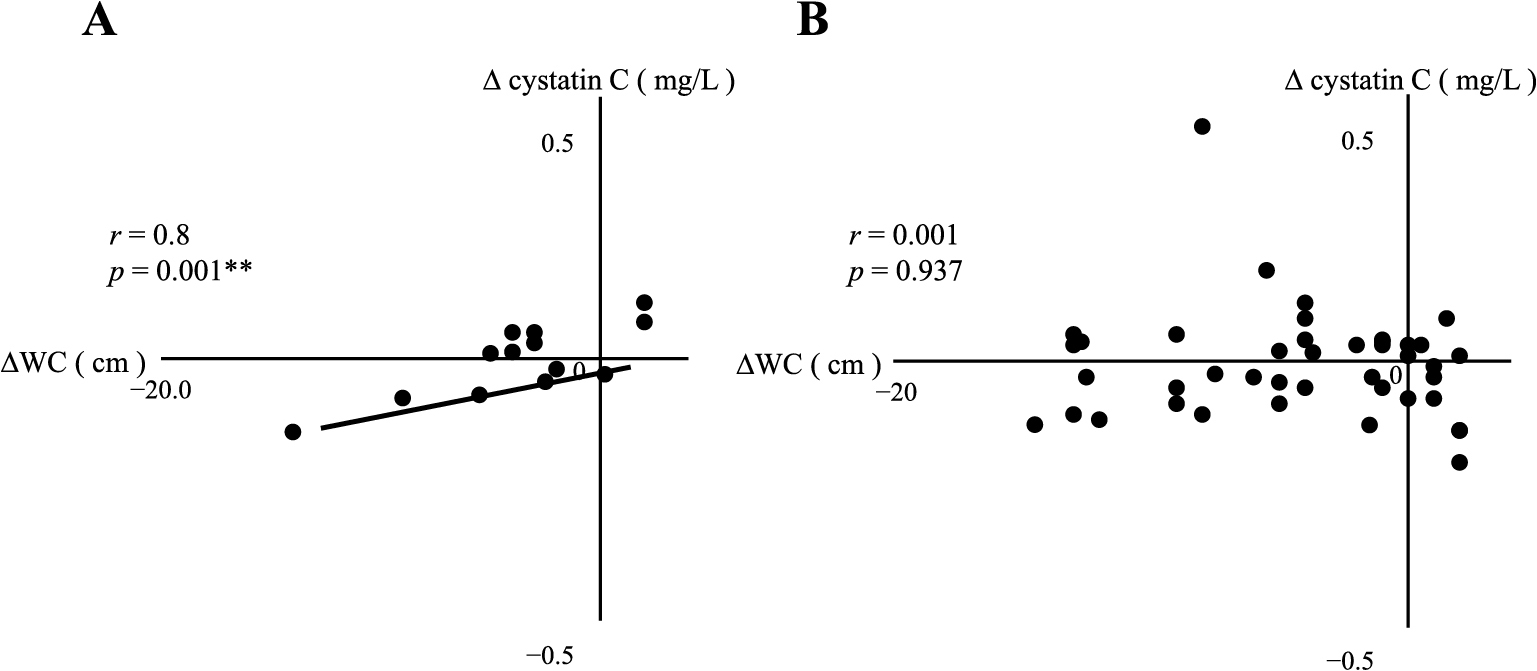
Changes in WC (ΔWC) positively correlated with Δcystatin C in the MHO group (Table 3B, Fig. 8), but not with Δ% fat (Table 3B). However, ΔWC positively correlated with both ΔHOMA-β and Δleptin. In addition, ΔWC negatively correlated with Δadiponectin in the MHO group (as shown in the left column of Table 3B). In the MUO group, ΔWC positively correlated with both Δ% fat and Δleptin (as shown in the right column of Table 3B).
Table 3B
Correlation between changes in WC and metabolic parameters
|
MHO |
MUO |
| r |
p |
r |
p |
| Δcystatin C |
0.80 |
0.001** |
0.01 |
0.937 |
| ΔSAA-LDL |
–0.05 |
0.8 |
0.27 |
0.065 |
| Δα1AT-LDL |
–0.2 |
0.5 |
0.10 |
0.439 |
| ΔhsCRP |
–0.156 |
0.647 |
0.12 |
0.396 |
| Δ% fat |
0.45 |
0.145 |
0.42 |
0.002** |
| ΔIRI |
0.53 |
0.077 |
0.02 |
0.863 |
| ΔHOMA-R |
0.54 |
0.068 |
0.06 |
0.653 |
| ΔHOMA-β |
0.82 |
0.001** |
0.23 |
0.092 |
| Δadiponectin |
–0.58 |
0.047* |
–0.12 |
0.404 |
| Δleptin |
0.68 |
0.022* |
0.41 |
0.002** |
LDL: low-density lipoprotein, SAA: serum amyloid A, α1AT: alpha1-antitrypsin, hsCRP: high sensitivity C reactive protein, % fat: percentage total body fat, IRI: immunoreactive insulin, HOMA: homeostasis model assessment. Asterisks indicate a statistical significance (* p < 0.05, ** p < 0.01, *** p < 0.001).
Discussion
After applying selection criteria to divide subjects into the MHO and MUO groups, up to 60% of all participants were excluded, resulting in a small number of subjects in both groups (Fig. 1). Soriguer et al. previously reported that the prevalence of MHO ranged between 3.0 and 16.9% [18]. In the Korean population, the ratio of MHO to MUO was between 1 and 6% [19]. These variations in prevalence may be attributed to differences in the definitions of MHO and MUO. Since the JOMS study mainly recruited outpatients with obesity, the prevalence of MHO and MUO in the present study was consistent with that previously reported [20].
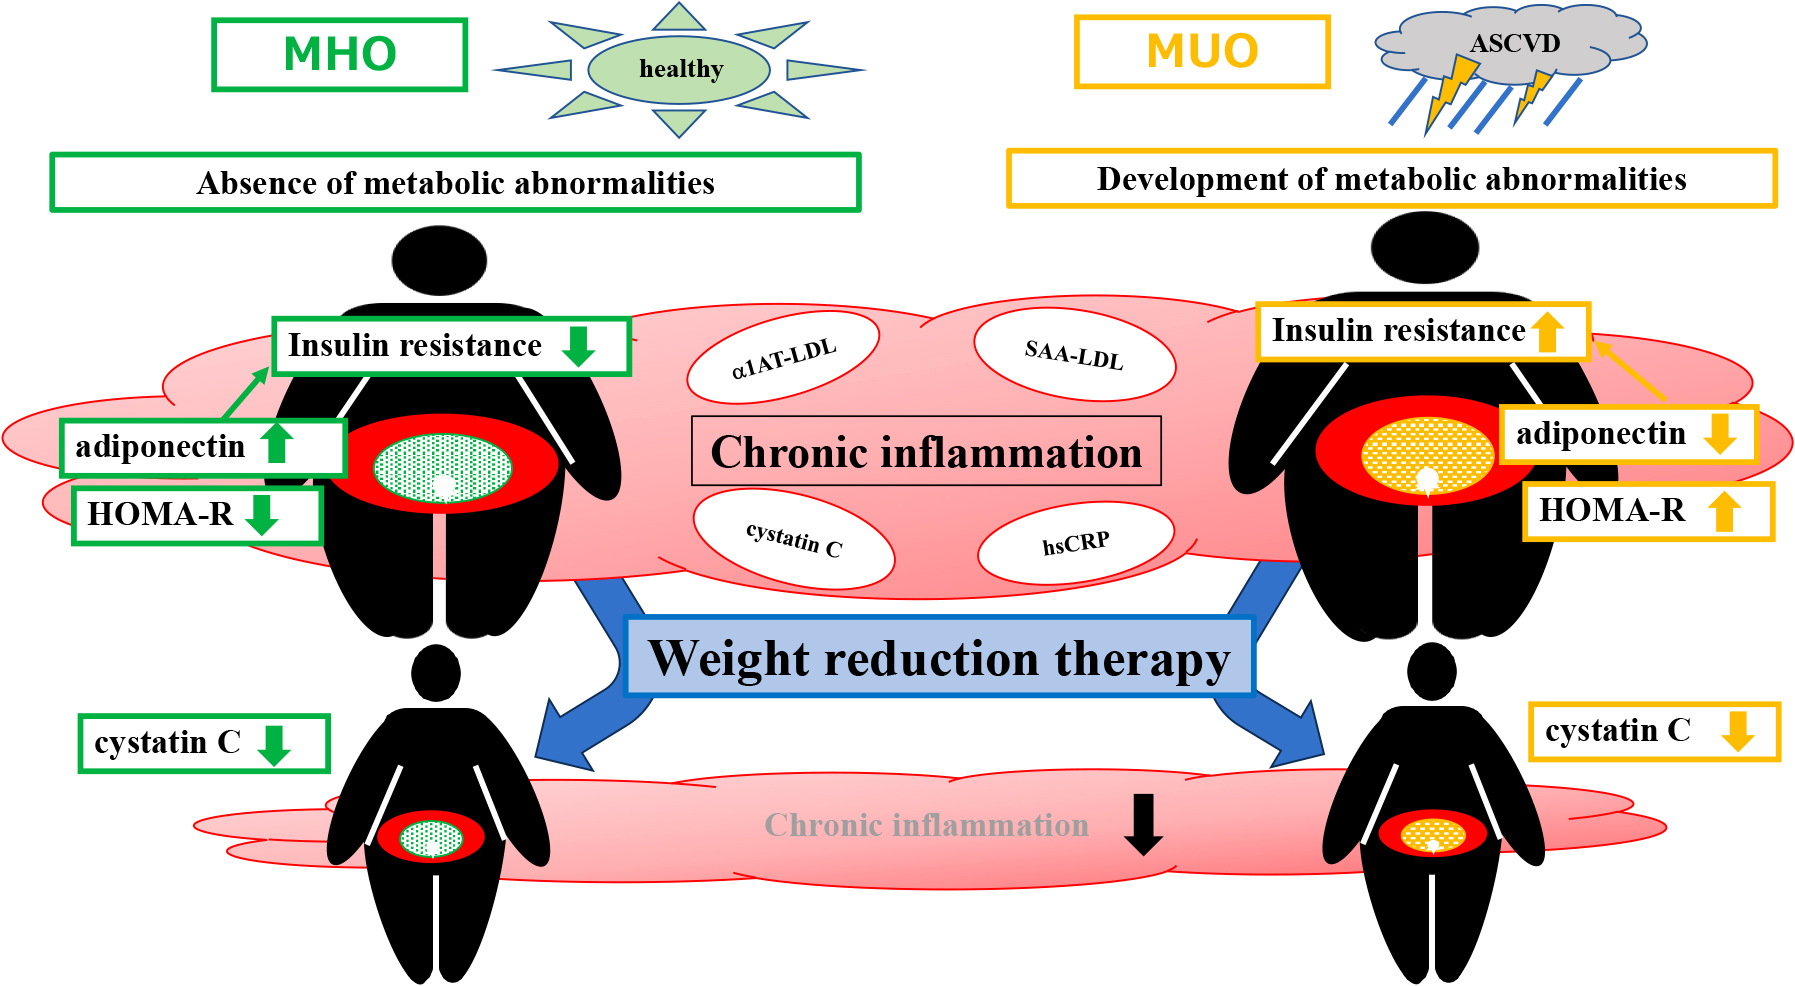
Although the MHO group was considered to be metabolically normal, inflammatory markers, such as serum cystatin C, hsCRP, SAA-LDL, and α1AT-LDL levels, did not significantly differ from those in the MUO group at baseline. Since these markers are associated with inflammation, which contributes to atherosclerosis [14, 21], chronic inflammation may have been present in both the MHO and MUO groups (Fig. 9).
After three months of weight reduction therapy, there was no significant improvement in chronic inflammation in either the MHO or MUO groups (Table 2). However, the MUO group showed significantly lower serum SAA-LDL levels and a greater improvement in insulin resistance than the MHO group (Supplementary Table 1). Additionally, reductions in serum SAA-LDL levels and % fat correlated with weight loss in the MUO group (Table 3A). These results are consistent with previous findings [14, 22-24] and suggest that in the presence of metabolic disorders, such as MUO, a reduction in adipose tissue improves insulin resistance and attenuates chronic inflammation, leading to a decrease in potential risk markers for CVD.
In contrast to the MUO group, the MHO group showed a significant improvement in insulin resistance, which correlated with ΔBW and ΔWC after three months of weight reduction therapy (Table 3A and B). This result indicated that a reduction in adipose tissue is not the only factor affecting insulin sensitivity in individuals with MHO. At baseline, serum adiponectin levels were significantly higher in the MHO group than in the MUO group, which is consistent with previous findings [22, 23]. Furthermore, after weight reduction therapy, serum adiponectin levels increased in the MHO and MUO groups. These results prompted us to investigate the potential role of serum adiponectin in improvements in insulin resistance and the maintenance of a normal metabolic status in the MHO group.
Adiponectin has been shown to improve insulin sensitivity in the liver and muscles and exerts anti-inflammatory effects [25, 26]. Additionally, serum adiponectin levels may be associated with the distribution of adipose tissue, specifically SAT and VAT, rather than the amount of adipose tissue present [23]. The correlations observed between serum adiponectin levels and the area of SAT or VAT differed between the MHO and MUO groups, indicating potential differences in the metabolic status between the two groups. On the other hand, the relationship between serum adiponectin levels and adipose tissue in individuals with MHO has remained ambiguous. Previous studies provided various definitions of MHO, with some reporting positive correlations between serum adiponectin levels and the areas of both SAT and VAT [27]. However, in subjects encompassing both metabolically healthy and non-obese individuals, a negative correlation was observed between serum adiponectin levels and SAT [28]. In a multiple regression analysis of 783 non-obese, healthy men aged 20–29 years, serum adiponectin levels negatively correlated with the area of SAT [29]. There is a prevailing consensus on the inverse relationship between insulin resistance and serum adiponectin levels [30, 31].
These findings were reproduced in the MHO group in the present study (Figs. 2A and 4A), but not in the MUO group (Figs. 3A and 4B), suggesting that adiponectin secreted from SAT played a role in improving insulin resistance to achieve homeostasis in the MHO group. This may be the major difference between the MHO and MUO groups (Figs. 5A and 6A).
Nevertheless, the effectiveness of weight reduction therapy in MHO to improve insulin resistance and reduce inflammatory markers remains controversial. A previous study indicated that weight reduction through lifestyle modifications did not significantly improve insulin resistance or reduce inflammatory markers in MHO from those in obese insulin-resistant individuals [32-35]. While other studies demonstrated that weight loss may reduce inflammatory markers in individuals with MHO, one of these studies reported that treatment-induced weight loss ≥10% negatively affected the secretion of adipokines [32].
Serum cystatin C levels are associated with fat mass and inflammation, which, in turn, are related to the conditions of severe obesity [36]. Cystatin C has been shown to exert anti-inflammatory effects that improve insulin sensitivity in mice [37]. It currently remains unclear whether changes in serum cystatin C levels are reflective of those in fat mass and the inflammatory burden or are indicative of an effective improvement in eGFR following weight loss. After bariatric surgery-induced weight loss, reductions occur in the area of VAT and amount of renal sinus fat deposits. The decrease in the former is associated with a favorable change in the adipocytokine profile and reductions in inflammatory cytokines [38]. In the present study, no significant differences were observed in serum cystatin C levels after weight reduction therapy in the MHO or MUO group (Table 2) and Δcystatin C did not correlate with changes in eGFR or serum creatinine in the MHO or MUO group (Data not shown). However, we found positive correlations between ΔWC and Δcystatin C in the MHO group and between ΔBW and Δcystatin C in the MUO group. Since WC and BW significantly decreased in the MHO and MUO groups, respectively, after weight reduction therapy (Table 2), changes in serum cystatin C levels may reflect those in fat mass and the anti-inflammatory effects of weight reduction therapy.
In summary, the MHO and MUO groups both exhibited similar levels of inflammatory markers, indicating the presence of chronic inflammation induced by excess adipose tissue in both groups. However, the key distinction lies in the insulin resistance of each group, with serum adiponectin levels playing a major role in these differences. Specifically, the MHO group showed higher serum adiponectin levels, which likely contributed to maintaining a normal metabolic status. This may explain why, despite chronic inflammation, the MHO group had a metabolically healthy profile.
On the other hand, serum adiponectin levels were lower in the MUO group, which may be associated with insulin resistance, metabolic abnormalities, and an increased risk of ASCVD. These results underscore the importance of adiponectin levels in assessing the metabolic health of individuals in both groups. Furthermore, during weight reduction therapy, Δcystatin C positively correlated with ΔWC in the MHO group and ΔBW in the MUO group, indicating that this therapy exerted anti-inflammatory effects in both groups (Fig. 9).
The present study had a number of limitations that need to be addressed. We excluded subjects who were taking medications for diabetes, dyslipidemia, and hypertension. This exclusionary approach may have introduced a selection bias because these individuals may have been part of the MUO group. However, our intention in the present study was to compare MHO and MUO while ensuring that the metabolic status was not affected by these medications. Furthermore, we acknowledge the potential impact of the small sample size, particularly in the MHO group, as a limitation of this study. The application of a statistical correction for the smaller sample size in the MHO group may have been beneficial in the present study, but was not implemented. The markedly smaller number of MHO subjects than MUO subjects may have led to a sample selection bias; however, based on the absence of significant differences in age and sex between the groups, the presence of a severe bias appears to be unlikely. Nevertheless, the findings of the present study need to be confirmed by studies with larger sample sizes, especially for MHO subjects.
It remains unclear whether MHO and MUO are distinct clinical entities because MHO subjects may transition to MUO over time [39-41]. Nonetheless, weight reduction therapy needs to be considered for MHO subjects with inflammation. Prospective intervention studies involving larger MHO groups are needed in the future.
Data Availability
Data that support the present results are available from the corresponding author upon reasonable request.
Acknowledgments
This work was supported in part by a Grant-in-Aid for Scientific Research (KAKENHI) from the Japan Society for the Promotion of Science (JSPS) [grant number: 23K08015] (To K.H.).
Author Contributions
K.H. evaluated the data, wrote the manuscript, and supervised the entire project; S.K. conceived the project, analyzed the data, wrote the manuscript, and prepared figures and tables; H.Y. contributed to statistical analyses; K.K. and M.N. evaluated the data; N.S-A. provided the cohort data of JOMS study and evaluated the data. All authors discussed the results, commented on the manuscript, and gave their final approval of the version to be submitted.
Competing Interests
The authors declare no competing interests.
Disclosure
The authors have nothing to disclose. K.H., M.N. and N.S-A. are members of Endocrine Journal’s Editorial Board.
Supplementary Table 1
Differences in changes in metabolic parameters between MHO and MUO
| Variable |
MHO |
MUO |
p value |
| ΔBW |
–2.6 (–18.5–3.7) |
–3.3 (–20–7.2) |
0.242 |
| ΔWC |
–3.0 (–14–7) |
–3.0 (–21.5–8.2) |
0.516 |
| Δ% fat |
–1.1 (–9.2–5.1) |
–0.9 (–13.5–29.7) |
0.567 |
| ΔIRI |
0.5 (–9.5–144.8) |
–4.1 (–112.0–65.5) |
0.004** |
| ΔHOMA-R |
0.23 (–1.79–70.03) |
–1.13 (–48.6–13.4) |
0.002** |
| ΔHOMA-β |
3.3 (–256–302) |
–14.3 (–859–1,062) |
0.189 |
| Δadiponectin |
1.0 (–1.0–3.5) |
0.7 (–16.9–7.7) |
0.758 |
| Δleptin |
–2.4 (–30.6–5.2) |
–1.2 (–123.8–52.8) |
0.914 |
| Δcystatin C |
0.01 (–0.14–0.11) |
–0.02 (–0.43–0.44) |
0.490 |
| ΔSAA-LDL |
3.0 (–19–89) |
–4.0 (–186–65) |
0.027* |
| Δα1AT-LDL |
0.5 (–3.0–2.6) |
0 (–2.2–3.6) |
0.618 |
| ΔhsCRP |
0.09 (–2.75–5.61) |
–0.28 (–10.15–13.61) |
0.366 |
BW: body weight, WC: waist circumference, % fat: percentage total body fat, IRI: immunoreactive insulin, HOMA: homeostasis model assessment, LDL: low-density lipoprotein, SAA: serum amyloid A, α1AT: alpha1-antitrypsin, hsCRP: high sensitivity C reactive protein. Asterisks indicate a statistical significance (* p < 0.05, ** p < 0.01).
References
- 1 Lin X, Li H (2021) Obesity: epidemiology, pathophysiology, and therapeutics. Front Endocrinol (Lausanne) 12: 706978.
- 2 Blüher M (2019) Obesity: global epidemiology and pathogenesis. Nat Rev Endocrinol 15: 288–298.
- 3 Vague J (1956) The degree of masculine differentiation of obesities: a factor determining predisposition to diabetes, atherosclerosis, gout, and uric calculous disease. Am J Clin Nutr 4: 20–34.
- 4 Schulze MB (2019) Metabolic health in normal-weight and obese individuals. Diabetologia 62: 558–566.
- 5 Smith GI, Mittendorfer B, Klein S (2019) Metabolically healthy obesity: facts and fantasies. J Clin Invest 129: 3978–3989.
- 6 Stefan N, Schulze MB (2023) Metabolic health and cardiometabolic risk clusters: implications for prediction, prevention, and treatment. Lancet Diabetes Endocrinol 11: 426–440.
- 7 Satoh N, Shimatsu A, Kato Y, Araki R, Koyama K, et al. (2008) Evaluation of the cardio-ankle vascular index, a new indicator of arterial stiffness independent of blood pressure, in obesity and metabolic syndrome. Hypertens Res 31: 1921–1930.
- 8 Shiwaku K, Anuurad E, Enkhmaa B, Nogi A, Kitajima K, et al. (2004) Overweight Japanese with body mass indexes of 23.0–24.9 have higher risks for obesity-associated disorders: a comparison of Japanese and Mongolians. Int J Obes Relat Metab Disord 28: 152–158.
- 9 (2005) Definition and the diagnostic standard for metabolic syndrome—Committee to Evaluate Diagnostic Standards for Metabolic Syndrome. Nihon Naika Gakkai Zasshi 94: 794–809 (In Japanese).
- 10 Freeman DJ, Norrie J, Sattar N, Neely RD, Cobbe SM, et al. (2001) Pravastatin and the development of diabetes mellitus: evidence for a protective treatment effect in the West of Scotland coronary prevention study. Circulation 103: 357–362.
- 11 Banach M, Malodobra-Mazur M, Gluba A, Katsiki N, Rysz J, et al. (2013) Statin therapy and new-onset diabetes: molecular mechanisms and clinical relevance. Curr Pharm Des 19: 4904–4912.
- 12 Goossens GH, Moors CC, van der Zijl NJ, Venteclef N, Alili R, et al. (2012) Valsartan improves adipose tissue function in humans with impaired glucose metabolism: a randomized placebo-controlled double-blind trial. PLoS One 7: e39930.
- 13 Bitkin EC, Boyraz M, Taşkın N, Akçay A, Ulucan K, et al. (2013) Effects of ACE inhibitors on insulin resistance and lipid profile in children with metabolic syndrome. J Clin Res Pediatr Endocrinol 5: 164–169.
- 14 Kotani K, Satoh N, Kato Y, Araki R, Koyama K, et al. (2009) A novel oxidized low-density lipoprotein marker, serum amyloid A-LDL, is associated with obesity and the metabolic syndrome. Atherosclerosis 204: 526–531.
- 15 Uchida K, Gotoh A (2002) Measurement of cystatin-C and creatinine in urine. Clin Chim Acta 323: 121–128.
- 16 Teramoto T, Sasaki J, Ueshima H, Egusa G, Kinoshita M, et al. (2007) Executive summary of Japan Atherosclerosis Society (JAS) guideline for diagnosis and prevention of atherosclerotic cardiovascular diseases for Japanese. J Atheroscler Thromb 14: 45–50.
- 17 Teramoto T, Sasaki J, Ishibashi S, Birou S, Daida H, et al. (2013) Treatment A) lifestyle modification: executive summary of the Japan Atherosclerosis Society(JAS) guidelines for the diagnosis and prevention of atherosclerotic cardiovascular diseases in Japan—2012 version. J Atheroscler Thromb 20: 835–849.
- 18 Soriguer F, Gutierrez-Repiso C, Rubio-Martin E, Garcia-Fuentes E, Almaraz MC, et al. (2013) Metabolically healthy but obese, a matter of time? Findings from the prospective Pizarra study. J Clin Endocrinol Metab 98: 2318–2325.
- 19 Lee SK, Kim SH, Cho GY, Baik I, Lim HE, et al. (2013) Obesity phenotype and incident hypertension: a prospective community-based cohort study. J Hypertens 31: 145–151.
- 20 Appleton SL, Seaborn CJ, Visvanathan R, Hill CL, Gill TK, et al. (2013) Diabetes and cardiovascular disease outcomes in the metabolically healthy obese phenotype: a cohort study. Diabetes Care 36: 2388–2394.
- 21 Ogasawara K, Mashiba S, Wada Y, Sahara M, Uchida K, et al. (2004) A serum amyloid A and LDL complex as a new prognostic marker in stable coronary artery disease. Atherosclerosis 174: 349–356.
- 22 Ahl S, Guenther M, Zhao S, James R, Marks J, et al. (2015) Adiponectin levels differentiate metabolically healthy vs. unhealthy among obese and nonobese white individuals. J Clin Endocrinol Metab 100: 4172–4180.
- 23 Guenther M, James R, Marks J, Zhao S, Szabo A, et al. (2014) Adiposity distribution influences circulating adiponectin levels. Transl Res 164: 270–277.
- 24 Esposito K, Pontillo A, Di Palo C, Giugliano G, Masella M, et al. (2003) Effect of weight loss and lifestyle changes on vascular inflammatory markers in obese women: a randomized trial. JAMA 289: 1799–1804.
- 25 Zhao L, Fu Z, Liu Z (2014) Adiponectin and insulin cross talk: the microvascular connection. Trends Cardiovasc Med 24: 319–324.
- 26 Tishinsky JM, Robinson LE, Dyck DJ (2012) Insulin-sensitizing properties of adiponectin. Biochimie 94: 2131–2136.
- 27 Hanley AJ, Bowden D, Wagenknecht LE, Balasubramanyam A, Langfeld C, et al. (2007) Associations of adiponectin with body fat distribution and insulin sensitivity in nondiabetic Hispanics and African-Americans. J Clin Endocrinol Metab 92: 2665–2671.
- 28 Fujikawa R, Ito C, Nakashima R, Orita Y, Ohashi N (2008) Is there any association between subcutaneous adipose tissue area and plasma total and high molecular weight adiponectin levels? Metabolism 57: 506–510.
- 29 Frederiksen L, Nielsen TL, Wraae K, Hagen C, Frystyk J, et al. (2009) Subcutaneous rather than visceral adipose tissue is associated with adiponectin levels and insulin resistance in young men. J Clin Endocrinol Metab 94: 4010–4015.
- 30 Weyer C, Funahashi T, Tanaka S, Hotta K, Matsuzawa Y, et al. (2001) Hypoadiponectinemia in obesity and type 2 diabetes: close association with insulin resistance and hyperinsulinemia. J Clin Endocrinol Metab 86: 1930–1935.
- 31 Yamamoto Y, Hirose H, Saito I, Tomita M, Taniyama M, et al. (2002) Correlation of the adipocyte-derived protein adiponectin with insulin resistance index and serum high-density lipoprotein-cholesterol, independent of body mass index, in the Japanese population. Clin Sci (Lond) 103: 137–142.
- 32 Kantartzis K, Machann J, Schick F, Rittig K, Machicao F, et al. (2011) Effects of a lifestyle intervention in metabolically benign and malign obesity. Diabetologia 54: 864–868.
- 33 Gomez-Huelgas R, Ruiz-Nava J, Santamaria-Fernandez S, Vargas-Candela A, Alarcon-Martin AV, et al. (2019) Impact of intensive lifestyle modification on levels of adipokines and inflammatory biomarkers in metabolically healthy obese women. Mediators Inflamm 2019: 4165260.
- 34 Cobos-Palacios L, Ruiz-Moreno MI, Vilches-Perez A, Vargas-Candela A, Munoz-Ubeda M, et al. (2022) Metabolically healthy obesity: Inflammatory biomarkers and adipokines in elderly population. PLoS One 17: e0265362.
- 35 Mathis BJ, Tanaka K, Hiramatsu Y (2023) Metabolically healthy obesity: are interventions useful? Curr Obes Rep 12: 36–60.
- 36 Okura T, Jotoku M, Irita J, Enomoto D, Nagao T, et al. (2010) Association between cystatin C and inflammation in patients with essential hypertension. Clin Exp Nephrol 14: 584–588.
- 37 Dedual MA, Wueest S, Challa TD, Lucchini FC, Aeppli TRJ, et al. (2020) Obesity-induced increase in Cystatin C alleviates tissue inflammation. Diabetes 69: 1927–1935.
- 38 Moriconi D, Nannipieri M, Dadson P, Rosada J, Tentolouris N, et al. (2022) The beneficial effects of bariatric-surgery-induced weight loss on renal function. Metabolites 12: 967.
- 39 Eckel N, Li Y, Kuxhaus O, Stefan N, Hu FB, et al. (2018) Transition from metabolic healthy to unhealthy phenotypes and association with cardiovascular disease risk across BMI categories in 90 257 women (the Nurses’ Health Study): 30 year follow-up from a prospective cohort study. Lancet Diabetes Endocrinol 6: 714–724.
- 40 Mongraw-Chaffin M, Foster MC, Anderson CAM, Burke GL, Haq N, et al. (2018) Metabolically healthy obesity, transition to metabolic syndrome, and cardiovascular risk. J Am Coll Cardiol 71: 1857–1865.
- 41 Moussa O, Arhi C, Ziprin P, Darzi A, Khan O, et al. (2019) Fate of the metabolically healthy obese-is this term a misnomer? A study from the clinical practice research datalink. Int J Obes (Lond) 43: 1093–1101.