ORIGINAL
Region-specific hippocampal atrophy is correlated with poor glycemic control in type 2 diabetes: a cross-sectional study

2023 年 70 巻 12 号 p. 1131-1140

詳細
2023 年 70 巻 12 号 p. 1131-1140
To examine the association between prediabetes/type 2 diabetes mellitus (T2DM) and hippocampal subfields and to investigate the effects of glycemic control (HbA1c and FBG)/diabetes duration on the volume of hippocampal subfields in T2DM patients. This cross-sectional study included 268 participants from Tianjin Union Medical Center between August 2019 and July 2022. The participants were divided into three groups: T2DM, prediabetes and no diabetes. All participants underwent brain MRI examination on a 3T MRI scanner. FreeSurfer was performed to segment hippocampus automatically based on T1 MPRAGE images. The relationships between glycemic status/glycemic control/diabetes duration and hippocampal subfield volumes were estimated by multiple linear regression analysis/generalized additive modeling (GAM). Among all participants, 76 (28.36%) had prediabetes, and 96 (35.82%) had T2DM. In multi-adjusted linear regression models, those with prediabetes had a significantly lower volume of bilateral parasubiculum (βright = –5.540; βleft = –6.497). Those with diabetes had lower volume of parasubiculum (βleft = –7.868), presubiculum-head (βleft = –6.244) and fimbria (βleft = –7.187). We did not find relationship between diabetes duration and hippocampal subfield volumes. In stratified analysis, long duration with high FBG related with lower volume of right fimbria (βright = –15.583). Long duration with high HbA1c related with lower volume of presubiculum-head (βright = –19.693), subiculum-head (βright = –28.303), subiculum-body (βleft = –38.599), CA1-head (βright = –62.300, βleft = –47.922), CA1-body (βright = –19.043), CA4-body (βright = –14.392), GC-ML-DG-head (βright = –20.521), GC-ML-DG-body (βright = –16.293, βleft = –12.799), molecular_layer_HP-head (βright = –44.202, βleft = –26.071) and molecular_layer_HP-body, (βright = –31.368), hippocampal_tail (βleft = –80.073). Prediabetes related with lower bilateral parasubiculum volume, and T2DM related with lower left parasubiculum, presubiculum-head and fimbria. T2DM with chronic poor glycemic control had lower volume in multiple hippocampal subregions.
TYPE 2 DIABETES MELLITUS (T2DM) is the most common chronic disease among older adults and is a growing public health problem. Data from fifty-seven low- and middle-income countries reported that prevalence diabetes was 9.3% [1]. Diabetes prevalence has steadily increased in China. In 2013 among the Chinese adult population, reported that the prevalence of diabetes was 10.9% and prediabetes was 35.7% [2]. However, in 2018 the estimated overall prevalence of diabetes was 12.4% and of prediabetes was 38.1%, and only 50.1% of diabetes patients receiving treatment were controlled adequately [3]. Large-scale epidemiological surveys have shown that diabetes is associated with morphological changes in the brain, including frontal, temporal, hippocampus and so on [4, 5]. However, the results are controversial. The results from ACCORD trial showed that longer duration of diabetes is associated with gray matter volume loss, but HbA1c level was not associated with any MR imaging measure [6]. Subjects with diabetes had significantly lower volume in the frontal lobe, temporal lobe, insula and deep gray matter structures [5]. The ARIC Study from four U.S. communities showed that higher HbA1c and longer disease duration was associated with smaller brain volumes [4]. Another population study showed that longer duration of diabetes and elevated postload glucose are risk factors for brain atrophy, particularly hippocampal atrophy [7].
The hippocampus, the brain region responsible for learning and memory, is the most sensitive to hyperglycemia [8]. The research shows that high-glucose conditions can put the body in low-grade chronic inflammation which cause further hippocampal vulnerability [9]. The mechanism showed in experimental studies that dynamin-related protein 1 promotes synaptic injury and neurodegeneration in the diabetic hippocampus [9].
So far, few studies have considered the association between subfields of hippocampal atrophy and diabetes. One small sample study showed that the T2DM patients showed decreased volumes of hippocampal subfields in the bilateral molecular layers, GC-ML-DG, CA4, fimbria, left subiculum and right HATA, and fasting blood-glucose (FBG) was negatively correlated with volume of right fimbria [10]. However, another small sample study showed that the volumes of the left subiculum, left presubiculum, left fimbria, right CA1 and molecular layer-HP were reduced in T2DM patients with cognitive impairment [11]. Due to the small sample size, the results were inconsistent.
In the present study, we aimed to examine the morphology of hippocampal subfields in prediabetic and T2DM patients. Furthermore, in T2DM patients, we investigated the effects of HbA1c/FBG/diabetes duration on the volume of hippocampal subfields.
Participants were included from Tianjin Union Medical Center between August 2019 and July 2022. This study was approved by the Medical Research Ethics Committee, and written informed consent was provided by all subjects.
We recruited participants who underwent brain MRI examination and met the following eligibility criteria: (1) patients aged 30 years or older; (2) patients with qualified brain magnetic resonance imaging (MRI); (3) patients with complete related clinical information; (4) patients with brain trauma and tumors were excluded; (5) patients with diabetes other than T2DM (T1DM or gestational diabetes) were excluded.
Clinical data collectionClinical data for this study were collected by searching the Hospital Information System (HIS), Picture Archiving and Communication System (PACS) and participants’ self-report. Information included demographics (age and sex), lifestyle and anthropometric factors (smoking, weight and height), clinical diagnosis (hypertension, diabetes and cerebrovascular disease) and total cholesterol.
Body mass index (BMI) was calculated as weight (kg) divided by squared height (m2). Smoking status was dichotomized as never smoke vs. former/current smoker.
Brain trauma and brain or other site tumors were evaluated according to the medical records from the HIS.
Assessment of T2DM and prediabetesAccording to the American Diabetes Association (ADA) criteria for diabetes diagnosis and combined with clinical diagnosis, we defined glycemic status into three groups: T2DM, prediabetes and no diabetes (normoglycemia). T2DM was defined as fasting blood-glucose (FBG) ≥7.0 mmol/L or HbA1c ≥6.5% and combined with diagnosis by clinician; prediabetes was defined as FBG (5.6 mmol/L–7.0 mmol/L) or HbA1c (5.7%–6.5%). For T2DM patients, according to the Guidelines for the Prevention and Control of T2DM in China, FBG was dichotomized as high FBG level (FBG ≥7.0 mmol/L) and normal FBG (FBG <7.0 mmol/L); HbA1c was dichotomized as high HbA1c level (HbA1c ≥7.0%) and normal HbA1c (HbA1c <7.0%) [12]. According to the duration of diabetes, we divided the diabetes patients into long-term diabetes (diabetes duration ≥10 years) and short-term diabetes (diabetes duration ≤9 years).
MRI data acquisitionWhole-brain anatomical T1 MPRAGE images were acquired on a 3T MRI scanner (Skyra, Siemens Healthcare, Germany) equipped with a 20-channel head-neck coil. Using a sagittal T1-weighted brain-volume imaging sequence (TR = 2,000 ms, TE = 2.3 ms, section thickness = 1 mm, matrix size = 256 × 256, flip angle = 9°, slice thickness = 1 mm).
Data processingFirst, all data were converted to NIFTI format using MRIcroN software; then the images were processed by FreeSurfer version 7.0.0 (https://surfer.nmr.mgh.harvard.edu/) using the default setting. The processing involved the following steps, motion correction, intensity normalization, skull stripping, transformation to MNI template, segmentation, creating the cortical surface and parcellation. Finally, we obtained hippocampal subfield volumes and estimated total intracranial volume (eTIV). The hippocampus was automatically segmented into the following subfields: Parasubiculum; presubiculum; subiculum; CA1; CA3; CA4; molecular_layer_HP; hippocampus amygdala transition area (HATA); fimbria; hippocampal_tail; hippocampal-fissure and the whole volume of the bilateral hippocampi. The automatic segmentation of one patient’s hippocampus was showed in Fig. 1.
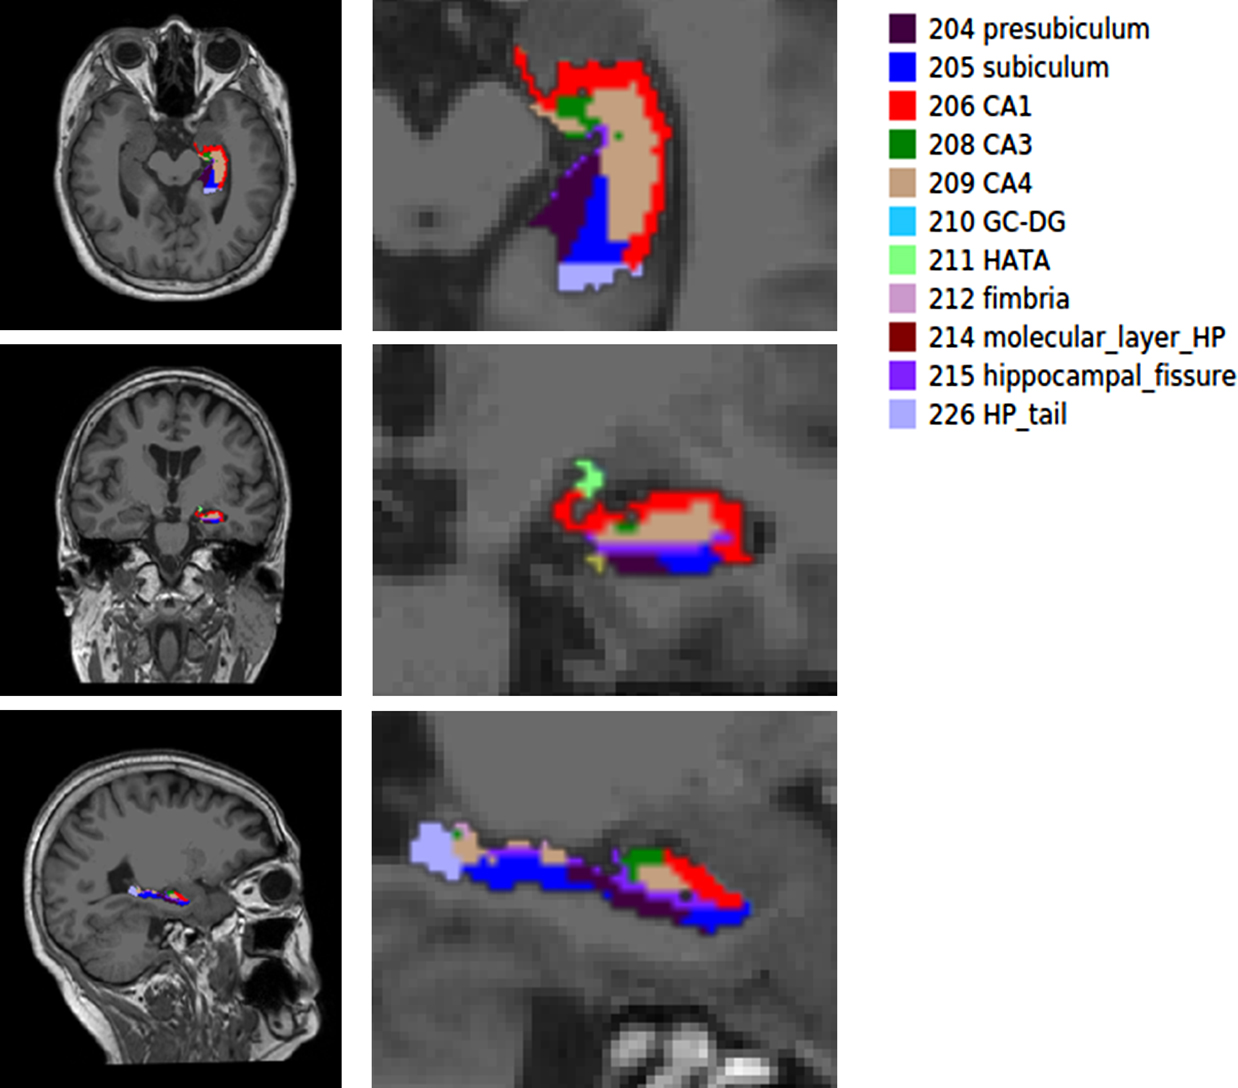
A simple of left hippocampal subfield automated segmentation
The chi-square tests were used to compare proportions and one-way ANOVA used to compare means of continuous variables with a normal distribution (the Mann-Whitney U test was used when variables were nonnormally distributed). Multiple linear regression analysis was employed to estimate the relationship between glycemic status/diabetic blood sugar control and hippocampal subfield volumes. Age, sex, body mass index, smoking, TC, history of hypertension, cerebrovascular disease and eTIV were considered potential confounders. Generalized additive modeling (GAM) was used to analyze the relationship between diabetes duration and hippocampal subfield volumes. All analyses were performed with R 3.6.2. The level of statistical significance for the two-tailed test of each hypothesis was set at p < 0.05.
A total of 268 participants fulfilled the initial inclusion criteria. Of these participants, 145 (54.10%) were male, and the mean (SD) age was 60.37 (9.31) years. In all participants, 76 (28.36%) had prediabetes, and 96 (35.82%) had T2DM. Compared to participants without pathoglycemia, patients with prediabetes and T2DM were more likely to be older, male, and smokersing, and to have higher rates of hypertension and cerebrovascular disease (p < 0.05). Patients with prediabetes and T2DM had smaller left hippocampus volume (p = 0.019) (Table 1). In T2DM, of the 92 patients with FBG values, the mean (SD) FBG was 8.26 (2.88), and 56 patients (60.87%) had high FBG levels; of the 76 patients with HbA1c values, the mean (SD) HbA1c was 7.81 (1.93), and among them, 46 patients (60.53%) with high HbA1c level, indicating poor blood glucose control.
Baseline characteristics of the study population according to the glycemic status
| variables | No diabetes | Prediabetes | T2DM | p |
|---|---|---|---|---|
| n = 96 | n = 76 | n = 96 | ||
| Age | 56.23 (10.72) | 62.37 (7.24) | 62.94 (7.74) | <0.001 |
| Male | 37 (38.54) | 49 (64.47) | 59 (61.46) | 0.001 |
| BMI | 24.04 (3.62) | 24.58 (2.62) | 25.15 (3.62) | 0.073 |
| Smoking | 19 (19.79) | 32 (42.11) | 45 (46.88) | <0.001 |
| Hypertension | 29 (30.21) | 45 (59.21) | 69 (71.88) | <0.001 |
| Cerebrovascular disease | 15 (15.63) | 38 (50.00) | 47 (48.96) | <0.001 |
| FBG (mmol/L) | 4.97 (0.39) | 5.97 (0.60) | 8.26 (2.88) | <0.001 |
| HbA1c (%) | 5.39 (0.22) | 5.77 (0.29) | 7.81 (1.93) | <0.001 |
| Total cholesterol | 4.82 (0.98) | 4.78 (0.98) | 5.09 (1.25) | 0.129 |
| Right hippocampus volume (mm3) | 3,763.31 (433.70) | 367,874 (316.23) | 3,665.34 (354.07) | 0.161 |
| Left hippocampus volume (mm3) | 3,630.93 (433.29) | 3,499.65 (346.85) | 3,487.12 (353.86) | 0.019 |
| Total intracranial volume (mm3) | 1,478,091.29 (153,169.63) | 1,469,198.29 (155,957.93) | 1,470,678.90 (143,258.05) | 0.913 |
After adjusted age, sex, body mass index, smoking, TC, history of hypertension, cerebrovascular disease and eTIV, in multi-adjusted linear regression models, history of hypertension and cerebrovascular disease, those with prediabetes had a significantly lower volume of parasubiculum in both right and left hippocampus (βright = –5.540, p = 0.019; βleft = –6.497, p = 0.020). In multi-adjusted linear regression models, those with diabetes had a significantly lower volume of left hippocampal subregion, including parasubiculum (βleft = –7.868, p = 0.004), presubiculum-head (βleft = –6.244, p = 0.036) and fimbria (βleft = –7.187, p = 0.029) (Table 2).
Multiple linear regression examining associations between glycemic status and hippocampal subfields volume
| Hippocampal subfields | prediabetes | T2DM | |||||||
|---|---|---|---|---|---|---|---|---|---|
| β | SE | t | p | β | SE | t | p | ||
| Right hippocampal | |||||||||
| parasubiculum | –5.540 | 2.348 | –2.359 | 0.019* | –4.440 | 2.308 | –1.924 | 0.055 | |
| presubiculum | presubiculum-head | –1.036 | 2.930 | –0.354 | 0.724 | –3.202 | 2.879 | –1.112 | 0.267 |
| presubiculum-body | –3.319 | 4.351 | –0.763 | 0.446 | –2.322 | 4.276 | –0.543 | 0.588 | |
| subiculum | subiculum-head | –2.246 | 4.982 | –0.451 | 0.652 | –4.831 | 4.895 | –0.987 | 0.325 |
| subiculum-body | –2.392 | 4.707 | –0.508 | 0.612 | –2.388 | 4.626 | –0.516 | 0.606 | |
| CA1 | CA1-head | –0.343 | 11.034 | –0.031 | 0.975 | 2.687 | 10.842 | 0.248 | 0.804 |
| CA1-body | 1.203 | 3.474 | 0.346 | 0.730 | 3.477 | 3.414 | 1.018 | 0.309 | |
| CA3 | CA3-head | –1.169 | 3.496 | –0.334 | 0.738 | –2.096 | 3.435 | –0.610 | 0.542 |
| CA3-body | 0.228 | 2.753 | 0.083 | 0.934 | 2.511 | 2.705 | 0.928 | 0.354 | |
| CA4 | CA4-head | 0.052 | 2.839 | 0.018 | 0.985 | –1.051 | 2.789 | –0.377 | 0.707 |
| CA4-body | 0.642 | 2.743 | 0.234 | 0.815 | 1.246 | 2.695 | 0.462 | 0.644 | |
| GC-DG | GC-DG-head | 0.819 | 3.491 | 0.235 | 0.815 | –0.955 | 3.430 | –0.278 | 0.781 |
| GC-DG-body | 1.560 | 2.948 | 0.529 | 0.597 | 1.359 | 2.897 | 0.469 | 0.639 | |
| molecular_layer_HP | molecular_layer_HP-head | –0.429 | 6.430 | –0.067 | 0.947 | –2.509 | 6.318 | –0.397 | 0.692 |
| molecular_layer_HP-body | 1.274 | 4.357 | 0.292 | 0.770 | 2.426 | 4.281 | 0.567 | 0.571 | |
| HATA | –0.420 | 1.662 | –0.252 | 0.801 | –1.715 | 1.633 | –1.050 | 0.295 | |
| fimbria | –0.363 | 2.910 | –0.125 | 0.901 | –4.313 | 2.859 | –1.509 | 0.133 | |
| hippocampal_tail | 15.983 | 11.260 | 1.419 | 0.157 | 16.607 | 11.065 | 1.501 | 0.135 | |
| hippocampal-fissure | –2.024 | 6.342 | –0.319 | 0.750 | 5.854 | 6.232 | 0.939 | 0.348 | |
| Whole_hippocampal_body | –1.168 | 20.654 | –0.057 | 0.955 | 1.995 | 20.295 | 0.098 | 0.922 | |
| Whole_hippocampal_head | –10.312 | 32.591 | –0.316 | 0.752 | –18.112 | 32.026 | –0.566 | 0.572 | |
| Whole_hippocampus | 4.503 | 55.078 | 0.082 | 0.935 | 0.490 | 54.122 | 0.009 | 0.993 | |
| Left hippocampal | |||||||||
| parasubiculum | –6.497 | 2.766 | –2.349 | 0.020* | –7.868 | 2.718 | –2.894 | 0.004* | |
| presubiculum | presubiculum-head | –5.590 | 3.019 | –1.852 | 0.065 | –6.244 | 2.967 | –2.105 | 0.036* |
| presubiculum-body | –5.401 | 4.989 | –1.082 | 0.280 | –6.824 | 4.903 | –1.392 | 0.165 | |
| subiculum | subiculum-head | –6.192 | 5.266 | –1.176 | 0.241 | –4.088 | 5.174 | –0.790 | 0.430 |
| subiculum-body | –8.320 | 5.333 | –1.560 | 0.120 | –6.607 | 5.241 | –1.261 | 0.209 | |
| CA1 | CA1-head | –5.795 | 11.257 | –0.515 | 0.607 | –6.848 | 11.061 | –0.619 | 0.536 |
| CA1-body | –1.580 | 3.294 | –0.480 | 0.632 | 0.827 | 3.237 | 0.256 | 0.799 | |
| CA3 | CA3-head | 1.581 | 3.274 | 0.483 | 0.630 | 1.749 | 3.217 | 0.544 | 0.587 |
| CA3-body | 0.431 | 2.721 | 0.158 | 0.874 | 2.155 | 2.674 | 0.806 | 0.421 | |
| CA4 | CA4-head | 0.018 | 2.817 | 0.006 | 0.995 | 0.429 | 2.768 | 0.155 | 0.877 |
| CA4-body | 0.656 | 2.343 | 0.280 | 0.780 | 0.971 | 2.303 | 0.422 | 0.673 | |
| GC-DG | GC-DG-head | 0.974 | 3.467 | 0.281 | 0.779 | –0.281 | 3.407 | –0.082 | 0.934 |
| GC-DG-body | 0.087 | 2.602 | 0.033 | 0.973 | –0.661 | 2.556 | –0.258 | 0.796 | |
| molecular_layer_HP | molecular_layer_HP-head | –4.975 | 6.672 | –0.746 | 0.457 | –5.197 | 6.556 | –0.793 | 0.429 |
| molecular_layer_HP-body | –2.407 | 4.044 | –0.595 | 0.552 | –2.303 | 3.974 | –0.580 | 0.563 | |
| HATA | 0.370 | 1.753 | 0.211 | 0.833 | –1.852 | 1.723 | –1.075 | 0.284 | |
| fimbria | –1.989 | 3.324 | –0.598 | 0.550 | –7.187 | 3.266 | –2.201 | 0.029* | |
| hippocampal_tail | 12.196 | 11.550 | 1.056 | 0.292 | 10.842 | 11.349 | 0.955 | 0.340 | |
| hippocampal-fissure | –4.855 | 4.969 | –0.977 | 0.329 | 3.319 | 4.883 | 0.680 | 0.497 | |
| Whole_hippocampal_body | –18.523 | 19.630 | –0.944 | 0.346 | –19.629 | 19.289 | –1.018 | 0.310 | |
| Whole_hippocampal_head | –26.104 | 33.078 | –0.789 | 0.431 | –30.200 | 32.504 | –0.929 | 0.354 | |
| Whole_hippocampus | –32.432 | 54.219 | –0.598 | 0.550 | –38.987 | 53.278 | –0.732 | 0.465 | |
Adjusted age, sex, body mass index, smoking, TC, history of hypertension, cerebrovascular disease and estimated total intracranial volume
* p < 0.05
In the GAM, only volume of hippocampal-fissure in right hippocampal has a nonlinear relationship with diabetes duration when we analyzed the relationship between diabetes duration and hippocampal subfield volumes in patients with T2DM (F = 2.288, p = 0.0338), but result was no longer statistically significant after multiple comparison correction (p = 0.918).
Effects of glycemic control on hippocampal subfields volume in T2DM stratified by diabetes durationWe found there was statistically significant interaction between HbA1c/FBG and diabetes duration associated with volume of molecular_layer_HP-head in right hippocampal. However no significant results were found in other hippocampal subregions (Supplement Table 1).
Furthermore, to clarify the effect of glycemic control on hippocampal subfield volume, we analyzed the relationship between HbA1c/FBG and hippocampal subregion volumes stratified by diabetes duration.
Among short-term T2DM patients, in multi-adjusted linear regression models, however, no significant association between HbA1c/FBG and hippocampal subregion volume was observed (Tables 3 and 4).
Multiple linear regression examining associations between fasting blood-glucose and hippocampal subfields volume in diabetes stratified by diabetes duration
| Hippocampal subfields | Short-term diabetes (n = 65) | Long-term diabetes (n = 31) | |||||||
|---|---|---|---|---|---|---|---|---|---|
| β | SE | t | p | β | SE | t | p | ||
| Right hippocampal | |||||||||
| parasubiculum | 2.175 | 3.328 | 0.654 | 0.516 | –2.518 | 8.507 | –0.296 | 0.770 | |
| presubiculum | presubiculum-head | 3.700 | 4.204 | 0.880 | 0.383 | –6.930 | 8.545 | –0.811 | 0.427 |
| presubiculum-body | –0.479 | 5.883 | –0.081 | 0.935 | 2.312 | 8.216 | 0.281 | 0.781 | |
| subiculum | subiculum-head | 9.850 | 7.986 | 1.233 | 0.223 | –10.758 | 13.232 | –0.813 | 0.426 |
| subiculum-body | –8.614 | 5.604 | –1.537 | 0.130 | –7.640 | 12.301 | –0.621 | 0.542 | |
| CA1 | CA1-head | 15.973 | 15.729 | 1.016 | 0.315 | –36.494 | 27.777 | –1.314 | 0.204 |
| CA1-body | –4.203 | 5.394 | –0.779 | 0.439 | –4.737 | 9.381 | –0.505 | 0.619 | |
| CA3 | CA3-head | –5.850 | 5.163 | –1.133 | 0.262 | –9.291 | 8.034 | –1.156 | 0.261 |
| CA3-body | –4.839 | 3.989 | –1.213 | 0.231 | –9.639 | 6.834 | –1.410 | 0.174 | |
| CA4 | CA4-head | –1.677 | 3.861 | –0.434 | 0.666 | –5.692 | 7.683 | –0.741 | 0.467 |
| CA4-body | –3.949 | 3.928 | –1.005 | 0.319 | –8.959 | 6.995 | –1.281 | 0.215 | |
| GC-DG | GC-DG-head | –0.027 | 4.726 | –0.006 | 0.996 | –12.793 | 9.446 | –1.354 | 0.191 |
| GC-DG-body | –3.261 | 4.201 | –0.776 | 0.441 | –11.797 | 7.691 | –1.534 | 0.141 | |
| molecular_layer_HP | molecular_layer_HP-head | 8.849 | 8.903 | 0.994 | 0.325 | –26.780 | 16.441 | –1.629 | 0.119 |
| molecular_layer_HP-body | –5.440 | 5.591 | –0.973 | 0.335 | –14.559 | 12.521 | –1.163 | 0.259 | |
| HATA | 3.828 | 2.553 | 1.499 | 0.140 | –3.627 | 4.087 | –0.887 | 0.385 | |
| fimbria | –0.046 | 4.520 | –0.010 | 0.992 | –15.583 | 6.369 | –2.447 | 0.024* | |
| hippocampal_tail | –20.940 | 16.338 | –1.282 | 0.206 | –6.292 | 34.707 | –0.181 | 0.858 | |
| hippocampal-fissure | –13.175 | 9.348 | –1.409 | 0.165 | 13.495 | 21.438 | 0.630 | 0.536 | |
| Whole_hippocampal_body | –30.831 | 24.687 | –1.249 | 0.217 | –70.601 | 52.879 | –1.335 | 0.197 | |
| Whole_hippocampal_head | 36.822 | 43.309 | 0.850 | 0.399 | –114.882 | 84.922 | –1.353 | 0.191 | |
| Whole_hippocampus | –14.949 | 68.619 | –0.218 | 0.828 | –191.776 | 147.092 | –1.304 | 0.207 | |
| Left hippocampal | |||||||||
| parasubiculum | 0.551 | 3.753 | 0.147 | 0.884 | 8.380 | 6.220 | 1.347 | 0.193 | |
| presubiculum | presubiculum-head | 2.644 | 4.790 | 0.552 | 0.583 | –8.140 | 8.196 | –0.993 | 0.333 |
| presubiculum-body | 2.789 | 8.100 | 0.344 | 0.732 | 1.209 | 9.140 | 0.132 | 0.896 | |
| subiculum | subiculum-head | 12.972 | 8.596 | 1.509 | 0.137 | –12.680 | 15.379 | –0.824 | 0.419 |
| subiculum-body | 2.132 | 8.359 | 0.255 | 0.800 | –12.124 | 12.952 | –0.936 | 0.360 | |
| CA1 | CA1-head | 18.283 | 15.984 | 1.144 | 0.258 | –13.602 | 25.053 | –0.543 | 0.593 |
| CA1-body | 2.715 | 4.173 | 0.651 | 0.518 | 3.018 | 8.420 | 0.358 | 0.724 | |
| CA3 | CA3-head | –7.030 | 5.456 | –1.289 | 0.203 | –8.291 | 8.640 | –0.960 | 0.349 |
| CA3-body | –4.139 | 4.936 | –0.838 | 0.406 | –0.479 | 6.698 | –0.071 | 0.944 | |
| CA4 | CA4-head | –2.497 | 4.378 | –0.570 | 0.571 | –9.589 | 7.324 | –1.309 | 0.205 |
| CA4-body | 1.203 | 4.054 | 0.297 | 0.768 | –3.154 | 5.793 | –0.544 | 0.592 | |
| GC-DG | GC-DG-head | –1.527 | 5.141 | –0.297 | 0.768 | –13.100 | 8.718 | –1.503 | 0.149 |
| GC-DG-body | 2.182 | 4.189 | 0.521 | 0.605 | –5.467 | 6.020 | –0.908 | 0.375 | |
| molecular_layer_HP | molecular_layer_HP-head | 9.252 | 9.601 | 0.964 | 0.340 | –19.366 | 16.717 | –1.158 | 0.260 |
| molecular_layer_HP-body | 1.802 | 6.065 | 0.297 | 0.768 | –3.920 | 11.313 | –0.347 | 0.733 | |
| HATA | 1.908 | 2.758 | 0.692 | 0.492 | –0.652 | 4.217 | –0.155 | 0.879 | |
| fimbria | –1.567 | 5.623 | –0.279 | 0.782 | –3.250 | 6.239 | –0.521 | 0.608 | |
| hippocampal_tail | –11.645 | 18.058 | –0.645 | 0.522 | 8.742 | 30.616 | 0.286 | 0.778 | |
| hippocampal-fissure | –9.394 | 9.800 | –0.959 | 0.342 | 2.110 | 15.003 | 0.141 | 0.890 | |
| Whole_hippocampal_body | 7.117 | 30.302 | 0.235 | 0.815 | –24.167 | 51.179 | –0.472 | 0.642 | |
| Whole_hippocampal_head | 34.556 | 49.061 | 0.704 | 0.484 | –77.039 | 79.480 | –0.969 | 0.344 | |
| Whole_hippocampus | 30.028 | 76.597 | 0.392 | 0.697 | –92.463 | 138.186 | –0.669 | 0.511 | |
Adjusted age, sex, body mass index, smoking, TC, history of hypertension, cerebrovascular disease and estimated total intracranial volume
* p < 0.05
Multiple linear regression examining associations between HbA1c and hippocampal subfields volume in diabetes stratified by diabetes duration
| Hippocampal subfields | Short-term diabetes (n = 65) | Long-term diabetes (n = 31) | |||||||
|---|---|---|---|---|---|---|---|---|---|
| β | SE | t | p | β | SE | t | p | ||
| Right hippocampal | |||||||||
| parasubiculum | 0.788 | 3.631 | 0.217 | 0.829 | –13.002 | 9.445 | –1.377 | 0.187 | |
| presubiculum | presubiculum-head | 0.842 | 4.794 | 0.176 | 0.861 | –19.693 | 8.963 | –2.197 | 0.042* |
| presubiculum-body | 4.941 | 6.392 | 0.773 | 0.444 | –19.349 | 9.451 | –2.047 | 0.056 | |
| subiculum | subiculum-head | 8.807 | 9.167 | 0.961 | 0.343 | –28.303 | 10.618 | –2.666 | 0.016* |
| subiculum-body | –5.549 | 6.542 | –0.848 | 0.401 | –15.532 | 11.152 | –1.393 | 0.182 | |
| CA1 | CA1-head | 1.368 | 18.721 | 0.073 | 0.942 | –62.300 | 24.123 | –2.583 | 0.019* |
| CA1-body | –8.170 | 5.906 | –1.383 | 0.174 | –19.043 | 8.400 | –2.267 | 0.037* | |
| CA3 | CA3-head | –9.560 | 5.733 | –1.668 | 0.103 | –15.134 | 9.014 | –1.679 | 0.112 |
| CA3-body | –4.198 | 4.664 | –0.900 | 0.374 | –15.116 | 7.193 | –2.102 | 0.051 | |
| CA4 | CA4-head | –3.821 | 4.439 | –0.861 | 0.395 | –14.648 | 8.281 | –1.769 | 0.095 |
| CA4-body | –2.563 | 4.669 | –0.549 | 0.586 | –14.392 | 6.793 | –2.119 | 0.049* | |
| GC-DG | GC-DG-head | –3.084 | 5.352 | –0.576 | 0.568 | –20.521 | 9.727 | –2.110 | 0.050* |
| GC-DG-body | –2.592 | 5.036 | –0.515 | 0.610 | –16.293 | 7.508 | –2.170 | 0.044* | |
| molecular_layer_HP | molecular_layer_HP-head | 3.126 | 10.637 | 0.294 | 0.770 | –44.202 | 12.818 | –3.448 | 0.003* |
| molecular_layer_HP-body | –6.831 | 6.463 | –1.057 | 0.297 | –31.368 | 9.749 | –3.218 | 0.005* | |
| HATA | –2.278 | 2.837 | –0.803 | 0.427 | –8.081 | 4.609 | –1.753 | 0.098 | |
| fimbria | 1.252 | 5.509 | 0.227 | 0.822 | –2.087 | 9.316 | –0.224 | 0.825 | |
| hippocampal_tail | –4.868 | 16.202 | –0.300 | 0.765 | –50.180 | 42.311 | –1.186 | 0.252 | |
| hippocampal-fissure | –9.261 | 11.051 | –0.838 | 0.407 | –27.878 | 25.137 | –1.109 | 0.283 | |
| Whole_hippocampal_body | –23.710 | 30.273 | –0.783 | 0.438 | –133.180 | 43.039 | –3.094 | 0.007* | |
| Whole_hippocampal_head | –3.812 | 50.141 | –0.076 | 0.940 | –225.884 | 74.555 | –3.030 | 0.008* | |
| Whole_hippocampus | –32.391 | 81.944 | –0.395 | 0.695 | –409.244 | 129.295 | –3.165 | 0.006* | |
| Left hippocampal | |||||||||
| parasubiculum | 5.916 | 4.109 | 1.440 | 0.158 | –0.556 | 7.066 | –0.079 | 0.938 | |
| presubiculum | presubiculum-head | 1.493 | 5.248 | 0.284 | 0.778 | –14.477 | 7.249 | –1.997 | 0.062 |
| presubiculum-body | –4.346 | 10.057 | –0.432 | 0.668 | –18.282 | 9.445 | –1.936 | 0.070 | |
| subiculum | subiculum-head | 5.015 | 9.382 | 0.535 | 0.596 | –15.907 | 11.904 | –1.336 | 0.199 |
| subiculum-body | –8.254 | 10.679 | –0.773 | 0.444 | –38.599 | 10.768 | –3.585 | 0.002* | |
| CA1 | CA1-head | 3.560 | 17.151 | 0.208 | 0.837 | –47.922 | 22.339 | –2.145 | 0.047* |
| CA1-body | 4.610 | 4.400 | 1.048 | 0.301 | –17.068 | 8.643 | –1.975 | 0.065 | |
| CA3 | CA3-head | –4.612 | 6.392 | –0.721 | 0.475 | –10.354 | 8.044 | –1.287 | 0.215 |
| CA3-body | 0.813 | 5.500 | 0.148 | 0.883 | –3.065 | 5.865 | –0.523 | 0.608 | |
| CA4 | CA4-head | –3.593 | 5.105 | –0.704 | 0.486 | –12.710 | 6.192 | –2.053 | 0.056 |
| CA4-body | –1.230 | 4.812 | –0.255 | 0.800 | –10.242 | 4.897 | –2.092 | 0.052 | |
| GC-DG | GC-DG-head | –4.745 | 5.893 | –0.805 | 0.426 | –14.303 | 7.181 | –1.992 | 0.063 |
| GC-DG-body | –1.733 | 4.907 | –0.353 | 0.726 | –12.799 | 4.822 | –2.654 | 0.017* | |
| molecular_layer_HP | molecular_layer_HP-head | 0.461 | 10.621 | 0.043 | 0.966 | –31.484 | 12.127 | –2.596 | 0.019* |
| molecular_layer_HP-body | –0.108 | 7.136 | –0.015 | 0.988 | –26.071 | 9.262 | –2.815 | 0.012* | |
| HATA | 0.029 | 3.016 | 0.009 | 0.993 | 2.906 | 4.554 | 0.638 | 0.532 | |
| fimbria | –9.495 | 6.361 | –1.493 | 0.144 | 1.565 | 7.510 | 0.208 | 0.837 | |
| hippocampal_tail | 10.721 | 17.724 | 0.605 | 0.549 | –80.073 | 32.909 | –2.433 | 0.026* | |
| hippocampal-fissure | –7.253 | 11.848 | –0.612 | 0.544 | –27.658 | 17.456 | –1.585 | 0.132 | |
| Whole_hippocampal_body | –19.742 | 36.640 | –0.539 | 0.593 | –124.560 | 41.048 | –3.035 | 0.007* | |
| Whole_hippocampal_head | 3.524 | 53.039 | 0.066 | 0.947 | –144.808 | 64.356 | –2.250 | 0.038* | |
| Whole_hippocampus | –5.496 | 89.997 | –0.061 | 0.952 | –349.441 | 108.054 | –3.234 | 0.005* | |
Adjusted age, sex, body mass index, smoking, TC, history of hypertension, cerebrovascular disease and estimated total intracranial volume
* p < 0.05
Among long-term T2DM patients, in multi-adjusted linear regression models, compare to normal FBG level, only volume of fimbria in right hippocampus was lower in high level of FBG (βright = –15.583, p = 0.024) (Table 3). Compare to normal HbA1c level, those with high level of HbA1c had lower volume of whole_hippocampal_body (βright = –133.180, p = 0.007; βleft = –124.560, p = 0.007), whole_hippocampal_head (βright = –225.884, p = 0.008; βleft = –144.808, p = 0.038), whole_hippocampus (βright = –409.244, p = 0.006; βleft = –349.441, p = 0.005). For the hippocampus subregion, volume of multiple hippocampal subregions were found to decrease in high level of HbA1c. After multi-adjusted, in the right hippocampus, the following subregion volumes decreased: presubiculum-head (βright = –19.693, p = 0.024), subiculum-head (βright = –28.303, p = 0.016), CA1-head (βright = –62.300, p = 0.019), CA1-body (βright = –19.043, p = 0.037), CA4-body (βright = –14.392, p = 0.049), GC-ML-DG-head (βright = –20.521, p = 0.050), GC-ML-DG-body (βright = –16.293, p = 0.044), molecular_layer_HP-head (βright = –44.202, p = 0.003) and molecular_layer_HP-body (βright = –31.368, p = 0.005). After multi-adjusted, in the left hippocampus, the following subregion volumes decreased: subiculum-body (βleft = –38.599, p = 0.002), CA1-head (βleft = –47.922, p = 0.047), GC-ML-DG-body (βleft = –12.799, p = 0.017), molecular_layer_HP-head (βleft = –26.071, p = 0.012), and the hippocampal_tail (βleft = –80.073, p = 0.026) (Tables 3 and 4).
In this cross-sectional study, we found the following: 1) compared to participants without pathoglycemia, those with prediabetes had a significantly lower volume of parasubiculum in both the right and left hippocampus, and those with T2DM had a significantly lower volume of left hippocampal subregion, including parasubiculum, presubiculum-head and fimbria; 2) among patients with diabetes, we did not find the relationship between diabetes duration and hippocampal subfield volumes; 3) among patients with long-term T2DM, compare to normal FBG level, only volume of fimbria in the right hippocampus was lower in high level of FBG; 4) among patients with long-term T2DM, compare to normal HbA1c level, those with high level of HbA1c had lower volume in multiple hippocampus subregions, including the right hippocampus (presubiculum-head, subiculum-head, CA1, CA4-body, GC-DG, molecular_layer_HP) and the left hippocampus (subiculum-body, CA1-head, GC-ML-DG-body, molecular_layer_HP-head, hippocampal_tail).
Many studies have explored the association between diabetes and whole hippocampal volume. However, few previous studies have investigated the association between diabetes/prediabetes and hippocampal subregion volume. In our study, we observed bilateral parasubiculum atrophy in prediabetes and left parasubiculum in T2DM patients. Experimental studies have shown that the neuronal composition of the parasubiculum involved in spatial navigation [13]. Our present results showed that volumes of the left presubiculum and left fimbria were reduced in T2DM patients. These results were also observed in previous studies [10, 11]. However, in other study the results did not show this association, just showed significant hippocampal subfields atrophy in the left hippocampal tail, left CA1, bilateral molecular layer, bilateral dentate gyrus, and bilateral CA4 in T2DM patients [14]. The morphological appearance and chemical composition of the presubiculum play an important role in neurodegenerative diseases, such as Alzheimer’s disease [15]. The fimbria-fornix can mitigate defects in hippocampus-dependent memory [16]. Our results suggested that high blood glucose may induce neuronal apoptosis [17]. Further research is needed to confirm this effect in the hippocampus subregion which is more susceptible to atrophy.
Previous study reported that the risk of microvascular complications increased with diabetes duration [18]. There is also research reported poor glycemic control also increased the risk of diabetic complication [19]. For example chronic unregulated HbA1c can cause certain microvascular complications [20]. However, studies on the association between glycemic control/diabetes duration and volume of hippocampus have also shown inconsistent results. One epidemiological study in elderly Japanese reported that longer duration of diabetes and elevated postload glucose levels are risk factors for hippocampal atrophy [5, 7]. A cross-sectional study reported that diabetes with HbA1c ≥7.0% had smaller hippocampal volumes [4]. However, now lack of research investigated the association between glycemic control/diabetes duration and volume of hippocampal subregion. Similar to previous studies, our results showed that diabetes patients with longer duration and high level of FBG had lower right fimbria, and patients with longer duration and high level of HbA1c had lower volumes in multiple hippocampal subregions, including the right hippocampus (presubiculum-head, subiculum-head, CA1, CA4-body, GC-DG, molecular_layer_HP) and left hippocampus (subiculum-body, CA1-head, GC-ML-DG-body, molecular_layer_HP-head, hippocampal_tail). Research indicates that HbA1c levels can affect cognitive and memory skills by multiple hippocampal subregions (such as the CA1, CA4 and molecular layer) in T2DM [14]. T2DM is characterized by chronic hyperglycaemia, hyperinsulinemia and dyslipidaemia, and these symptoms eventually weak insulin sensitivity and function [21, 22]. Previous study reported that insulin resistance made the brain very vulnerable to oxidative stress and led to brain oxidative damage [23]. Overproduction of reactive oxygen species (ROS) resulted in an increase in advanced glycosylation end products, and further led to neurodegenerative changes and an accumulation of amyloid β-protein in the brain [24-26]. Finally, neuronal/oligodendroglial survival and neuroplasticity were decreased. So the hippocampus where insulin receptors are more widely distributed may be the most susceptible to neuroapoptosis which result in atrophy of the hippocampal subregion [7, 23, 26] (Fig. 2). Therefore, good serum glucose is crucial to reducing cognitive impairment in patients with T2DM.
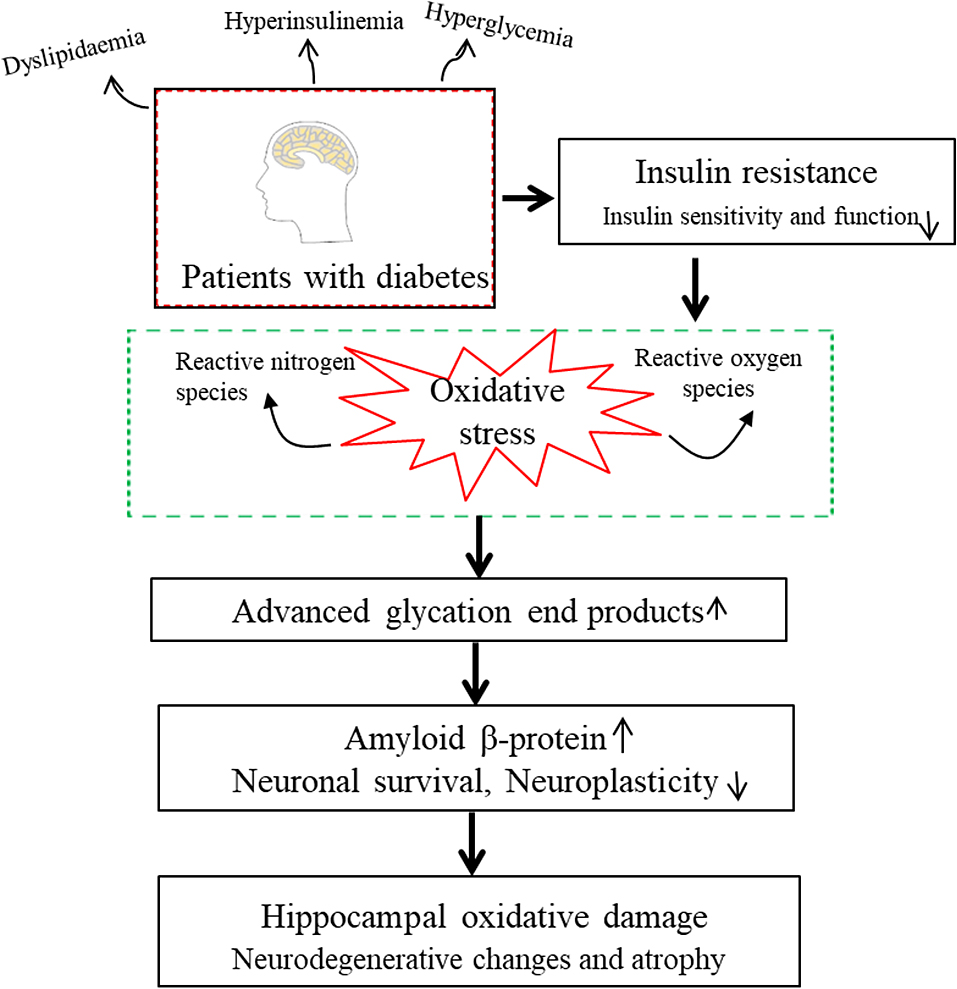
Possible mechanism of hippocampal atrophy in type 2 diabetes
The current study has strengths. On the one hand, in the analysis, we built a multi-factor analysis model to make the results more reliable; on the other hand, FreeSurfer is a highly efficient and accurate software package that provides automated neuroimaging analysis [27, 28]. However, some limitations need to be pointed out. First, in this study, despite we included subjects with relatively large sample size comparing previous studies, the sample sizes for analysis in diabetic population was limited; Second, the present study was only a cross-sectional study, but the results could help explore the effect of diabetes on hippocampal structure. Further longitudinal follow-up research is needed to confirm the association; Third, the participants in this study were recruited from a hospital. Thus, the results of this study might be subject to selection bias; Fourth, medication status may have played a role in the results, which should be taking into account in the data analysis. However, the data on medication status were unavailable in this study. In the analysis, glycemic control (HbA1c and FBG) were taken into account, and this might be indirectly or partially controlled for effects of medication.
In conclusion, our study shows that prediabetes is related to a lower bilateral parasubiculum volume, and T2DM is related to lower left parasubiculum, left presubiculum-head and left fimbria volumes. In T2DM patients, patients with longer duration and high level of HbA1c had lower volume in multiple hippocampal subregions. Large population-based longitudinal studies are warranted for further clarification.
This work was partially sponsored by Tianjin Health Research Project (KJ20100), and receives funding from China Postdoctoral Science Foundation (2021M702461), Tianjin Union Medical Center Project (2020YJ023), the National Natural Science Foundation of China (12174203) and Scientific and Technological Projects of Tianjin (21JCYBJC00120).
Study design: Jun Liu and Cuiping Bao; Data collection and sorting: Cuiping Bao, Xuehuan Liu, Yiming Li, Jun Yang, Feng Wei, Yi Gong and Zhihui Ma; Analysis and interpretation of the study: Jun Liu, Cuiping Bao, Xuehuan Liu, Yiming Li, Jun Yang, Feng Wei; Drafting the manuscript: Cuiping Bao.
No potential conflicts of interest relevant to this article were reported.