Original papers
Effects of Flavor and Texture on the Desirability of Cheddar Cheese during Ripening
2014 Volume 20 Issue 1 Pages 23-29
Details
2014 Volume 20 Issue 1 Pages 23-29
We investigated factors that affect the desirability of Cheddar-type cheeses among collegiate women in Japan using sensory and instrumental analyses. The sensory characteristics of seven Cheddar cheeses were analyzed, i.e., volatile composition; fatty acid composition; low molecular weight compounds including amino acids, amines, and organic acids; texture; and color. PCA models based on the sensory attributes and instrumental analyses of the cheeses demonstrated that the texture, pH, flavor intensity, and amount of amino acids in Cheddar cheeses affected their desirability. Volatile compounds detected by headspace SPME-GC/MS explained the flavor intensity, whereas those detected by SDE-GC/MS were related to a desirable aroma after eating. The descriptive sensory analysis showed that “butter” and “mango” aroma characteristics, which were related to methyl ketone and ester volatile compounds, were important factors that affected Cheddar cheese desirability. The sensory properties changed throughout ripening because of variations in these components.
Cheddar-type cheeses are the most common and popular cheeses consumed worldwide. Cheese flavor is one of the most important criteria determining consumer choice and acceptance (Young et al., 2004). During cheese ripening, numerous biochemical changes occur that lead to the development of the characteristic flavors and textures of different cheese varieties (Singh et al., 2003). The flavor of Cheddar cheese develops as the cheese ages, although many factors can affect the type of flavor profile that develops, including the milk source, starter culture, nonstarter bacteria, ripening temperature, final moisture content, and so on. Considerable knowledge has accumulated on the biochemical processes that occur during the ripening of Cheddar cheese and which have major consequences for the development of its flavor and texture. Singh et al. (2003) reviewed the major metabolic pathways and agents involved in the modification of milk constituents during Cheddar cheese ripening.
Cheese flavor is the result of the correct concentrations of and balance between a wide variety of volatile flavor compounds. A number of research groups have analyzed the volatile flavor compounds found in Cheddar cheese, including acids, alcohols, esters, aldehydes, ketones, sulfur-containing compounds, and phenolics. However, previous reports have not addressed the sensory effects of specific volatiles.
As well as the effects of flavor development on sensory perception, several other changes have been reported during ripening. Umami plays an important role in the flavor of many cheese varieties. Drake et al. (2007) identified the compounds responsible for the umami taste of Cheddar cheese. Based on a combined sensory and chemical analysis of model cheeses, they found that glutamic acid plays a major role in the umami taste of Cheddar cheeses. Preininger et al. (1996) suggested that the characteristic tastes of cheeses were attributable to a synergy of many substances, including organic acids and salts. After continuously monitoring electrical conductivity during the consumption of a range of Cheddars, Jack et al. (1995) reported that the manner in which salt is released into the mouth during chewing may be directly related to cheese breakdown and its texture.
Creamer and Olson (1982) investigated a number of Cheddar cheese samples of different ages, pHs, and moisture contents, and conducted rheological and electrophoretic analyses to determine whether the progressive changes in the cheese textures were related to casein proteolysis. The forcecompression curves obtained by crushing cubes of cheese between small flat plates at a constant speed differed among cheese samples and were affected by the moisture content, pH, and the extent of asl-casein proteolysis in the cheese.
Cheddar cheese flavor profiles and consumer preferences also vary. Drake et al. (2008) reported that consumer perception in the USA was linked to the sharpness and age of commercial Cheddar cheeses. They evaluated Cheddar cheese preferences among consumers in different locations throughout the USA and examined how they were related to the consumers' exposure to regional products. It was suggested that consumer location may have affected the preference for sharp Cheddar cheese flavors.
Several studies have investigated the changes that occur in cheese properties during ripening, but few have evaluated the relationships among sensory, physical, and compositional changes. Therefore, the objectives of this study were to: (1) clarify the major factors that affect the desirability of Cheddar-type cheeses in collegiate women in Japan; (2) evaluate the relationships among changes in these factors and the sensory desirability of cheeses; and (3) acquire information to improve the selection of aroma extraction methods for gas chromatography (GC).
Materials Cheddar cheese samples were obtained from different commercial sources in the following regions: Oceania (A, B, C, D), North America (E), Europe (F), and East Asia (G). The samples were purchased directly from the manufacturers. Sample preparation for instrumental analysis was conducted at approximately the same time as the sensory evaluation. Sensory and instrumental analyses were performed for each sample at two different times. All Cheddar cheese samples used in this study ranged from 7 months to 12 months in age (first stage) and subsequent investigations were conducted after a further six months (second stage).
Headspace solid-phase microextraction Volatile compounds were extracted by headspace solid-phase microextraction (SPME) or steam distillation extraction (SDE) followed by their separation and identification with GC/mass spectrometry (MS). The headspace volatiles in the cheese samples were measured by SPME-GC/MS as follows. Each cheese sample (1 g) was loaded into a 20 mL vial with a flat steel top (Supelco, Bellefonte, PA, USA). We added 70 mg of an internal standard solution (5 ppm trans-2-methyl-2- butenal in distilled water; Sigma-Aldrich, Milwaukee, WI, USA) to each vial to control for analytical variability. The sample vials were placed in a constant-temperature bath at 37°C for 10 min to establish an equilibrium between the headspace and the sample. An SPME device equipped with a fiber assembly coated with Stableflex 50/30 mm DVB-Carboxen-PDMS fiber film (Supelco) was used to sample the volatiles. The SPME fiber was inserted into the sample container through the septum and exposed to the headspace for 60 min. The analyses were performed in duplicate and good reproducibility was confirmed for all volatile compounds. The volatile headspace compounds in the samples were thermally desorbed in the injection port (250°C) using the splitless mode of a gas chromatograph (6890N, Agilent Technologies, Santa Clara, CA, USA) coupled to a mass spectrometer (5973, Agilent Technologies). The volatile compounds were separated on a GC column (length 50 m, i.d. 0.32 mm, thickness 0.52 mm; DB-5, Agilent J&W). The column temperature was maintained at 37°C for 8 min during injection and increased at a rate of 4°C/min to 190°C; it was then increased at a rate of 40°C/min to 280°C, where it was held for 8 min. The flow rate of the carrier gas (helium) was 2.4 mL/ min. Electron impact MS data were collected at m/z 30 - 300 with an ionization voltage of 70 eV. The relative abundances of the compounds in the headspace were calculated based on the calculated concentration of the internal standard recovered. Although the aroma compounds adsorbed onto SPME are influenced by their chemical potentials, comparison of the aroma compounds between samples can be made using these relative abundances. The volatile compounds were identified using the NIST 2005 library of spectral and retention indices. The retention indices were calculated using an alkane series (GL Science Inc., Tokyo, Japan). Fifty volatile compounds were estimated quantitatively using headspace SPME-GC/MS.
Steam distillation extraction (SDE) The flavor isolates used for the GC/MS analysis were prepared by SDE (Bassette, 1976). SDE was performed with 50 g samples of grated cheese in 150 mL of water at room temperature. SDE was conducted until 500 mL of water solution containing flavor compounds was obtained. The flavor compounds were then extracted twice from the water solution to a dichloromethane solution using a separating funnel. The solution obtained was condensed to 0.3 mL with a concentrator at 60°C, and diphenyl was added to this dichloromethane solution as an internal standard. The concentrations of the volatile materials were measured by GC/MS under the conditions described in the previous paragraph. A Varian 450 gas chromatograph (Agilent Technologies) coupled to a mass spectrometer (Varian 220-MS) was used to identify the compounds. The temperature at the interface was maintained at 250°C. The electron impact mass spectra were recorded at 70 eV. The volatiles were identified with the procedure described for headspace SPME-GC/MS. Twenty-four volatile compounds were evaluated quantitatively with SDE-GC/MS.
Compositional analysis The moisture content was measured using the air oven moisture content determination method (Bradley et al., 2001). The fat content of cheese samples was measured using the Roese-Gottlieb method (AOAC Official Method 933.05). The ash content was determined using the AOAC Official Method 941.12. The protein content was measured using the Kjeldahl method (AOAC Official Method 973.48). The degree of ripening was defined as the water-soluble total nitrogen / total nitrogen (Kuchroo and Fox, 1982). Amino acids were determined using the cadmium-ninhydrin method described by Folkertsma and Fox (1992).
β-carotene analysis The β-carotene content was measured by high performance liquid chromatography using a Shodex RSpak DS-613 column (150 mm × 6.0 mm i.d.; Showa Denko K.K., Tokyo, Japan) and a UV/VIS detector (UV-970; JASCO Corp., Hachioji, Japan) at a wavelength of 453 nm.
Fatty acid analysis The fatty acid composition of samples was determined using an HP5890 GC (Agilent Technologies) with an SP-2560 column (Supelco), which was equipped with an FID operated at 300°C. Analysis was performed under a temperature increase from 180°C to 200°C at 2°C/min after an initial holding time of 45 min at 180°C.
Texture analysis The hardness of individual cheese samples was determined using a texture analyzer (TA-XT2i, Stable Micro Systems Ltd., Godalming, UK). Each sample was cut to a size of 1 cm3. A 75 mm circular probe was lowered at 1 mm/s into the sample surface and penetrated the sample at 0.5 mm/s with 80% strain. Two measurements were made of the maximum load (N) and the crumble-value (mm), which was defined as the difference in the distortion rate-axis between the subsidiary fracture point and the maximum load point.
Color and pH The L*a*b* color space was determined using a CR-400 (Konica Minolta Optics, Inc., Tokyo, Japan). The pH was measured using a pH meter (F-73, Horiba Ltd., Kyoto, Japan) using a cheese:distilled water (1:1) slurry.
Descriptive sensory analysis A trained sensory panel (n = 10 panelists) discussed and documented the flavor attributes of the cheeses. Sensory analyses of aroma intensity were conducted before eating (headspace aroma) and after eating (retronasal aroma) using the KJ method. During these evaluations, the panelists used a vocabulary of 10 flavor attributes. The sensory panel evaluated the cheeses using the semantic differential method (Osgood, 1957). The sensory panels consisted of students and teachers from the Japan Women's University Department of Food and Nutrition Faculty of Home Economics. The first-stage sensory analysis was performed by 73 panel members (69 students and 4 teachers) and the second-stage sensory analysis was performed by 64 panel members (62 students and 2 teachers). The cheese samples were presented to each panelist as 5 × 3 × 5 mm blocks using a randomized, balanced block design. The assessors were presented with randomly coded cheese samples that had been equilibrated to room temperature. They assessed the intensity of 11 attributes: appearance (color), aroma intensity before eating, aroma intensity after eating, intensity of the last note, two textures (hardness and tongue feel), three flavor attributes (salty, umami, and bitter tastes), and desirability. The sensory analysis was used to evaluate seven cheeses on a 10.5 cm horizontal scale with directional terms (i.e., weak/strong) located at each end. “Crisp” or “melting” was evaluated as the attribute in the tongue feel analysis. After the sensory analysis, the scores were converted into numerical values. The mean score for each attribute was calculated during the data analysis of the sensory profiles of the cheese samples.
Statistical analysis A principal components analysis (PCA) was performed to visualize the relationships between the instrumental data, such as the relative abundances of the volatile compounds, and the sensory data for the cheese samples. The relationships among the sensory attribute data and the instrumental data were tested using Pearson's correlation coefficient test. In the determination, *indicates a significant difference at P < 0.05, and **indicates a significant difference at P < 0.01. These analyses were performed using PASW Statistics 17 (SPSS Japan Inc., Tokyo, Japan).
Sensory attributes of cheeses relative to their composition, texture, and color To determine the factors that affect the desirability of Cheddar cheeses, we used PCA to analyze the sensory attribute scores and the instrumental data collected for seven samples. The loading plots are shown in Fig.1. The principal components (PCs) that accounted for 34.0% (PC1) and 28.1% (PC2) of the total variance were extracted. The desirability score was positively related to three data points (pH, degree of ripening, and aroma intensity before eating). The amino acid content, b*, salty taste, and umami taste were closely related to the desirability score. In contrast, the desirability score correlated negatively with hardness and acidic flavor. These results indicate that the taste component perceived as umami, a soft texture, and a yellow color were major factors affecting the preference for Cheddar cheese. In contrast, a perceived acidic flavor and hardness of the Cheddar cheese were negatively received.
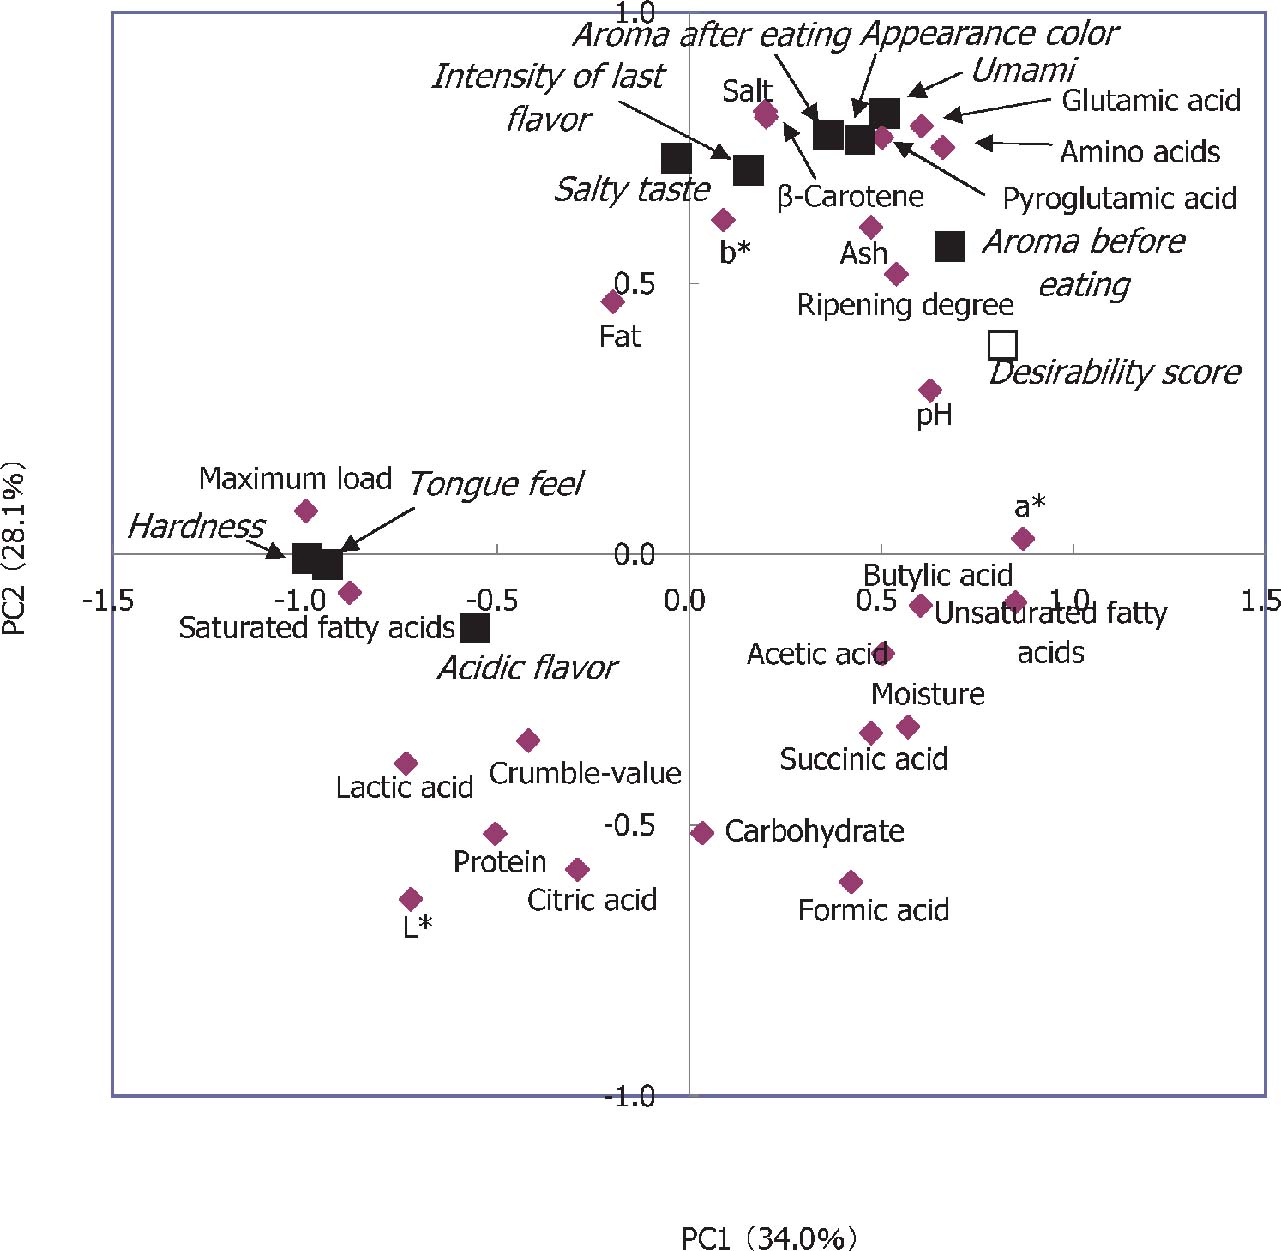
Principal components analysis (PCA) loading plots of the sensory attributes (▪), instrumental analysis data (♦), and desirability scores (□) for seven Cheddar cheese samples.
Correlations between sensory attributes and data measurements The relationships among the sensory attributes and the measurement data were also evaluated. A deep color correlated strongly with L* (r = −0.827*) and b* (r = 0.853*). The hardness score correlated with the maximum loading of the texture analyzer (r = 0.988**), the saturated fatty acid content (r = 0.836*), and the unsaturated fatty acid content (r = −0.805*). In contrast, the correlations between the hardness score, moisture content (r = −0.631), and fat content (r = 0.255) were relatively weak. These results suggest that the hardness of the cheese samples used in this study was profoundly affected by the physical properties of the milk fat in them. Correlations between the fatty acid composition of the raw milk and several sensory properties of the cheeses have been reported (Kraggerud et al., 2008). Salty and acidic flavors correlated strongly with the salt content (r = 0.847*) and pH (r = −0.952*), respectively. Umami perception correlated strongly with the amino acid content (r = 0.950**) and glutamic acid content (r = 0.971**). The desirability of the cheese samples was influenced by pH in this study, which correlated with the lactic acid content (r = −0.851*).
Effects of volatiles detected by headspace SPME- and SDE-GC/MS on sensory aroma intensity and desirability PCAs of two aroma perceptions (intensity and desirability) and the volatile compound content were performed. Intensity and desirability were evaluated before and after the cheese was eaten. Figure 2 shows the PCA loading plot for the sensory score and the volatile compound data based on the SDE-GC/MS and headspace SPME-GC/MS analyses of the cheese samples. The loading plot explained 31.5% (PC1: 21.1%; PC2: 10.4%) of the total variation. The volatile compounds determined by headspace SPME-GC/MS and SDE-GC/MS are shown as filled diamonds and filled circles, respectively, in Fig.2. The aroma intensity scores before and after eating had similar vectors. 2-Butanone, 2-heptanone, and 3-methyl-butanal had similar aroma intensity scores before eating, whereas dimethylsulfide, nonanal, and 2-butanone had similar intensity scores after eating. The aroma intensities before and after eating correlated negatively with the aroma desirability before eating (negative direction of PC1) and after eating (positive direction of PC2), respectively. These results show that the aroma intensity was not always sufficient to ensure desirability. The aroma desirability after eating had a positive PC1 axis, which included long-chain methyl ketone compounds such as 2-nonanone and 2-undecanone, which were measured with SDE-GC/MS. Headspace SPME was performed at 37°C, which is the oral temperature. SPME at 37°C was used to determine the volatile compounds with low to medium boiling points. In contrast, SDE can extract higher-boiling-point compounds than SPME. These results show that the aroma intensity was affected by volatile compounds with relatively low boiling points, whereas the aroma desirability after eating was affected by volatile compounds with relatively high boiling points. These results provide a good indication of the volatile levels in the cheeses based on GC measurements.
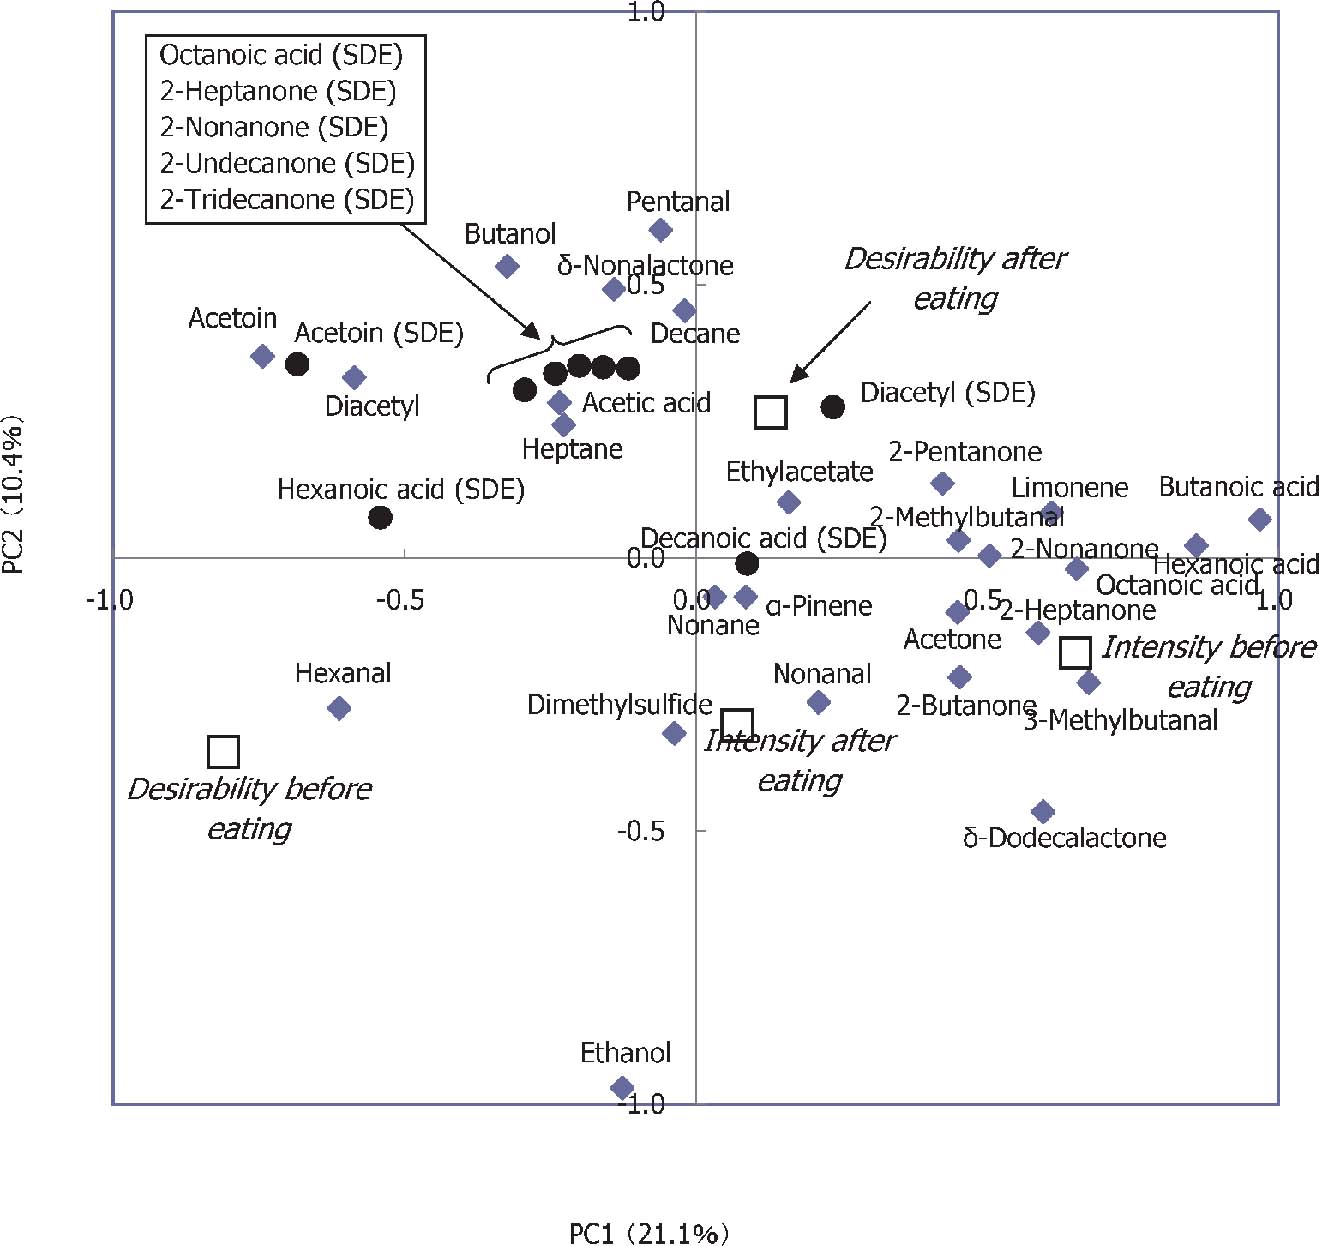
Principal components analysis (PCA) loading plots of the sensory attributes (□), volatile compounds measured with headspace SPME-GC/MS (♦), and volatile compounds measured with headspace SDE-GC/MS (•) for seven Cheddar cheese samples.
Aroma perception of volatile compounds Before conducting the sensory analysis, eight trained panelists selected 10 words applicable to flavor attributes to describe the sensory characteristics of the seven cheese samples: “sweet”, “fungal”, “gum”, “animal”, “smells fishy”, “butter”, “mango”, “milk”, “yogurt”, and “bean”, to avoid any ambiguity. “Sweet”, “butter”, “mango”, “milk”, and “yogurt” were described as desirable characteristics, whereas “gum”, “animal”, and “smells fishy” were undesirable characteristics. The terms “animal” and “bean” have both desirable and undesirable associations, which differed among individuals. In addition to these 10 flavor attributes, we evaluated the sensory desirability, “umami”, and “tongue feel” using sensory analysis. PCA was used to visualize the relationships among the 12 sensory attributes and the 23 volatile compounds of the seven cheese samples that were measured with SPME-GC/MS (Fig.3). The loading plot explained 43.2% (PC1: 23.2%; PC2: 20.0%) of the total variation. The desirability scores for “butter”, “bean”, and “mango” had similar vectors, whereas “yogurt” and “fungal” correlated negatively. 2-Nonanone had a characteristic “hot milk” flavor, ethyl acetate had a characteristic “fruit” flavor, and nonanal had a characteristic “green” flavor, and these three had similar vectors to the “butter”, “mango”, and “bean” attributes, respectively (Drake et al., 2012). Diacetyl and acetoin are known to be responsible for the key aromas of yogurt and are correlated with the “yogurt” attribute (Routray and Mishra, 2011). These results suggest that the “butter” and “mango” attributes, which were attributable to the aroma characteristics of methyl ketone and ester volatile compounds, were important factors that affected the preference for Cheddar cheese. Dimethylsulfide was related to the desirability score. It is known that sulfur compounds have low odor threshold values and they can have a major effect on cheese aromas. The attributes “animal”, “milk”, “gum”, and “umami” did not correlate directly with the flavor volatiles. This suggests that these attributes are related to less-volatile high-mass compounds or active taste compounds that may not have been detected with these methods. The “tongue feel” attributes were not strongly related to the volatile compound compositions or the textural properties of the cheeses.
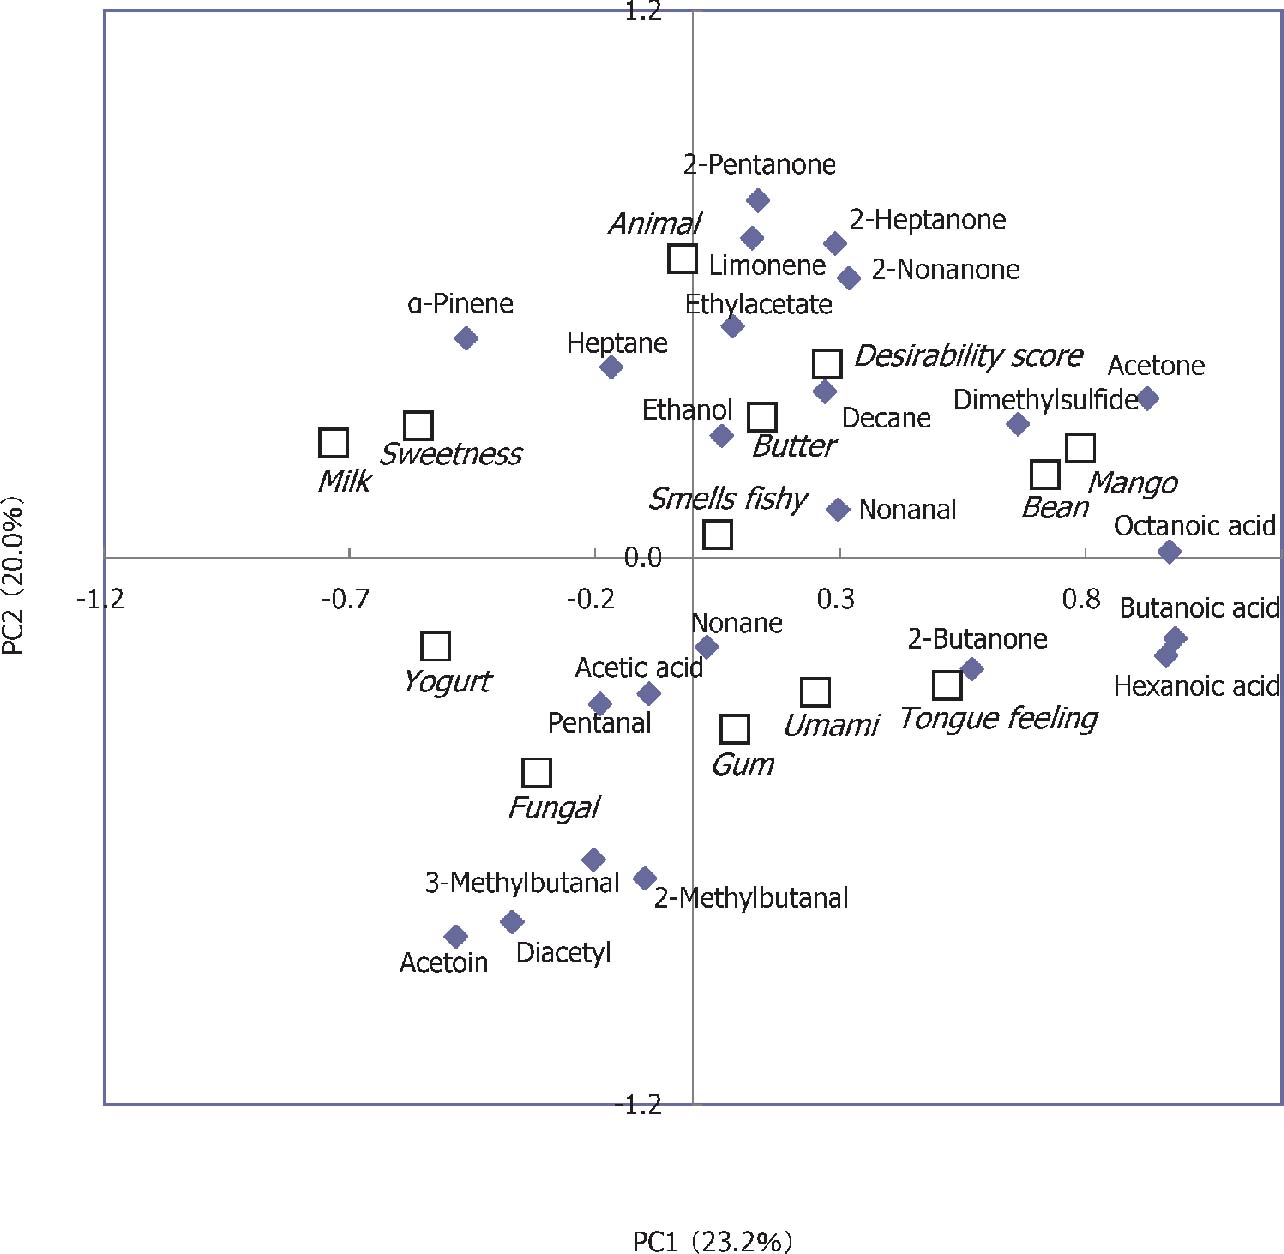
Principal components analysis (PCA) loading plots of 12 sensory attributes and desirability scores (□), and 23 volatile compounds measured with SPME-GC/MS (♦) for seven Cheddar cheese samples.
Changes in sensory properties during ripening To determine the changes that occur during Cheddar cheese ripening, we compared the sensory properties at two different times (first stage and second stage) during the maturation of each sample using sensory and instrumental analyses. Figures 1 and 3 show the parameters related to sensory desirability for six volatile compounds (octanoic acid, 2-nonanone, dimethylsulfide, nonanal, diacetyl, and acetoin), textural properties (maximum load and crumble value), amino acid content, and pH. Of these six volatile compounds, we detected increases in octanoic acid, 2-nonanone, dimethylsulfide, and acetoin (Table 1). In contrast, the levels of nonanal and diacetyl remained unchanged or decreased during maturation. The physical properties of the cheeses also changed during ripening. The maximum load decreased and the crumble value increased, indicating that maturation correlated with softening and an increase in elasticity. There were also increases in the amino acid contents resulting from the hydrolysis of peptides and proteins. However, there was little difference in the pH at the two ripening time points.
Methyl ketones have been identified in Cheddar cheese and were shown to play a role in the cheese flavor (Singh et al., 2003). Methyl ketones are produced from fatty acids by oxidative degradation. The production of methyl ketones involves the oxidation of fatty acids to β-ketoacids, which are then decarboxylated to their corresponding methyl ketones with one less carbon atom, predominantly from C6:0 to C12:0 fatty acids. A range of carbonyl compounds have been identified, including acetoin, diacetyl, acetone, 2-butanone, 2-pentanone, 2-heptanone, 2-nonanone, and 2-undecanone. Manning and Robinson (1973) reported that H2S, methanethiol, dimethylsulfide, diacetyl, methyl ketones, and volatile fatty acids play important roles in Cheddar cheese flavor. Sulfur compounds, such as dimethyl disulfide, which originate from methionine, generally have low odor threshold values and powerful odors, which are described as “sulfurous” and “cabbage-”, “onion-”, or “garlic-like”.
| A | B | C | D | E | F | G | |||
|---|---|---|---|---|---|---|---|---|---|
| Volatile compounds (µg/kg) | |||||||||
| Octanoic acid | First stage | 13.7 | 30.0 | 20.6 | 0.0 | 0.0 | 39.4 | 15.6 | |
| Second stage | 71.8 | 44.0 | 53.0 | 31.6 | 34.6 | 199.9 | 116.8 | ||
| 2-Nonanone | First stage | 7.0 | 6.7 | 8.2 | 7.4 | 2.7 | 7.2 | 7.7 | |
| Second stage | 13.8 | 6.3 | 22.2 | 11.1 | 5.3 | 10.9 | 19.4 | ||
| Dimethyl sulfide | First stage | 2.4 | 2.3 | 3.5 | 1.9 | 2.7 | 1.4 | 3.1 | |
| Second stage | 9.6 | 4.2 | 5.4 | 4.5 | 5.1 | 8.0 | 13.6 | ||
| Nonanal | First stage | 1.6 | 2.9 | 2.8 | 2.3 | 2.0 | 2.1 | 5.8 | |
| Second stage | 4.2 | 1.8 | 1.4 | 3.0 | 1.3 | 1.8 | 4.8 | ||
| Diacetyl | First stage | 3.4 | 7.4 | 6.3 | 24.1 | 12.1 | 5.1 | 7.2 | |
| Second stage | 0.0 | 5.6 | 3.3 | 45.0 | 14.9 | 4.1 | 0.0 | ||
| Acetoin | First stage | 45.0 | 110.5 | 31.8 | 443.7 | 336.2 | 93.2 | 17.7 | |
| Second stage | 75.1 | 174.6 | 79.1 | 967.6 | 689.0 | 88.9 | 85.9 | ||
| Textural parameters | Maximum load (N) | First stage | 50.0 | 63.3 | 65.3 | 52.5 | 47.5 | 29.3 | 53.4 |
| Second stage | 34.1 | 41.7 | 45.9 | 42.5 | 45.2 | 19.9 | 45.9 | ||
| Crumble value (mm) | First stage | 4.96 | 3.55 | 4.70 | 5.20 | 4.26 | 2.72 | 6.89 | |
| Second stage | 6.61 | 8.05 | 8.39 | 7.41 | 9.49 | 5.18 | 8.32 | ||
| Amino acid content (mg/100 g) | First stage | 427 | 340 | 887 | 1073 | 529 | 1545 | 279 | |
| Second stage | 975 | 808 | 1667 | 1683 | 935 | 2405 | 793 | ||
| pH | First stage | 5.3 | 5.4 | 5.4 | 5.3 | 5.2 | 5.7 | 5.3 | |
| Second stage | 5.5 | 5.5 | 5.4 | 5.3 | 5.3 | 5.6 | 5.4 | ||
Umami is a basic taste found in many cheeses. Drake et al. (2007) reported that umami intensity increased as cheeses aged and showed that umami correlated positively with the flavor attributes of aged Cheddar cheeses. Proteolysis and the release of free amino acids is a typical reaction as cheeses age. The free glutamic acid content of Cheddar cheese changes during ripening, increasing the desirability of the cheese.
The PCA models derived from the sensory analysis and the instrument measurement data detected relationships among the sensory properties, components, and textural properties of the cheeses. A soft texture and stronger flavor intensity were related to a sensory preference for Cheddar cheese. It is well known that the mechanical and rheological properties of foods affect the perception of taste. Kraggerud et al. (2008) have reported that textural properties, such as firmness during chewing, cohesiveness, and elasticity, which decrease with age, are associated with casein breakdown, and this is consistent with our findings. The role of pH in cheese texture is important because changes in pH are directly related to chemical changes in the protein network and thus the cheese texture, its stretchability, and its meltability. The textural changes observed in this study during ripening did not result from changes in the protein network because the pHs remained unchanged at the two sample testing time points.
Drake et al. (2008) suggested that consumer location may determine the preference for a mild Cheddar cheese flavor. The key indicators of a mild Cheddar cheese are: color; cooked, milky, whey, and brothy flavors; and a sour taste. No effects were linked to texture. In the present study, we have shown that the texture of a Cheddar cheese was an important factor affecting its desirability. This difference is probably attributable to cultural differences between the USA and Japan, or the makeup of the panels used to conduct the sensory analyses. We investigated sensory properties using a panel of collegiate women from Japan. Younger generations may prefer softer foods. More precise studies are required to clarify the differences in food preferences that are related to culture, generation, age, locality, and the desirability of different cheeses.