Abstract
Starches from two local cultivars of taro from North-Eastern region of India were characterized and compared with potato and rice starches. The cultivars were Kani and Garu. Average granule size of the taro starches were much smaller than potato starch, but comparable to the rice starch. A-type X-ray diffraction (XRD) pattern similar to rice starch was observed for the taro starches. The Fourier transform infra red (FT-IR) spectra of all the four starches were almost similar in nature. The peak gelatinization temperature (Tp) for Kani, Garu and rice starches were 74.7, 74.1 and 72.5°C, respectively while that of potato starch was 65.6°C. The pasting temperature of Kani starch was highest at 88.3°C and significantly different from the other starches. The peak, hold, final, breakdown and setback viscosities of Kani starch were lowest among the starches but were close to Garu and rice starches, but much lower than potato starch.
Introduction
Colocasia esculenta, commonly known as ‘Taro’, is a perennial, tropical plant grown primarily as a root vegetable for its edible corm, and secondarily as a leaf vegetable. Cultivated taro is classified as Colocasia esculenta, but the species is considered to be polymorphic. There are at least two botanical varieties: Colocasia esculenta (L.) Schott var. esculenta and Colocasia esculenta (L.) Schott var. antiquorum (Purseglove, 1972). Colocasia is found throughout India with greater diversity in North-Eastern, Eastern and Southern India (Edison, 2006). Also, North-East India is thought to be one of the centers of origin for Colocasia (Lakhanpaul et al., 2003; Hirai et al., 1993).
The physicochemical properties of taro starch vary with location and variety (Jane et al., 1992; Sefa-Dedeh and Sackey, 2002; Moorthy et al., 2003; Lu et al., 2008; Nand et al., 2008). The starch content of taro varies from 12 – 25% for different varieties available in India (Edison, 2006). Starch granules of taro are smaller in size and the starch have lower viscosities compared with other tuber starches with lesser breakdown at higher temperatures and could be used as thickeners in products where prolonged heating and stirring is required like sauce, soups, baby foods etc. (Lakhanpaul et al., 2003; Matsunaga and Seib, 1997). Taro starch can act as a good filling agent for biodegradable polyethylene film (Griffin and Wang, 1983; Lim et al., 1992) and as a fat substitute due to its small granule size. They can also be used for entrapment of flavoring compounds (Zhao and Whistler, 1994; Tari and Singhal, 2002). Due to the small granule size of taro starch it has been considered to be easily digestible; hence it is widely used in baby foods and the diets of people allergic to cereals and children sensitive to milk. The in vivo digestibility of taro starch was comparable with corn starch (Moorthy, 2002) and was found to be more susceptible to pancreatin hydrolysis than other tuber and root starches (Sugimoto et al., 1979). Starches from different sources differ in their physical and chemical properties (Nwokocha et al., 2009). Factors such as farming practices and differences in cultivar among taro may affect their chemical composition and hence, the physicochemical properties of the starches (Mepba et al., 2009).
Taro is abundantly produced in North-Eastern region of India. The crop is underutilized and storage of the tubers is also difficult. If starch is extracted from taro tubers, problem of storage will be alleviated and it may gain commercial importance. Therefore, the present study was taken up to investigate the physicochemical properties of starches from two popular varieties of taro from North-Eastern region of India and was compared with starches from local variety of potato and rice which are commonly consumed in this region, so that their application in food and other industry may be explored.
Materials and Methods
Sample collection Tubers from two local cultivars belonging to two varieties of Colocasia esculenta viz. Colocasia esculenta var. esculenta (locally known as Garu) and Colocasia esculenta var. antiquorum (locally known as Kani) were collected from research farm of Assam Agricultural University, Jorhat, Assam, India. Potato variety Chandramukhi (Solanum tuberosum) and rice variety Mahsuri (Oryza sativa), locally known as Aijong rice were purchased from local farm near Tezpur University, Assam, India and were used for comparison. The starch content of the fresh Kani, Garu and potato tubers, and the rice grains were 16.2, 17.8, 15.9 and 76.1%, respectively.
Starch isolation Starch from taro and potato was extracted as per the method described by Benesi et al. (2004) with some modifications. Tubers were washed under tap water, peeled and cut into cubes of approximately 1 cm. The cubes were ground using a high speed laboratory blender (Philips HL 1632, India) for two minutes. The resulting slurry was suspended in 10 times its volumes of distilled water and stirred for 5 min. The suspension was filtered through double fold cheese cloth and the filtrate was kept for sedimentation for 6 h. The supernatant was discarded and the sediment thus obtained was washed with distilled water for two times. The final sediment was dried at 45°C for 24 h in drying oven. The dried starch was ground and passed through 100 mesh sieve and kept in air tight plastic containers for further analysis. Starch from rice was extracted as per method described by Wang and Wang (2001). The yield of starch from Kani and Garu taro, and potato were 9.2, 11.6, and 12.9 g, respectively per 100 g fresh tubers, whereas for rice starch the yield was 64.4 g per 100 g rice grains. The lower starch yield of taro tubers compared to that of potato might be due to the presence of mucilaginous materials in taro tubers which resisted settling of the starch granules.
Chemical analysis and amylose content The moisture, fat, ash and crude fiber content of the isolated starches were determined by AOAC methods (AOAC, 1990). Protein content was determined by Kjeldahl method (AACC, 1990). The amylose content was determined using the colorimetric method described by McGrance et al. (1998). The standard curve was established using pure potato amylose type III (Himedia, India).
Granule size and shape using scanning electron microscope Shape and size of starch granules were evaluated using scanning electron microscope (SEM) (JEOL JSM 6390 LV, Singapore). A thin layer of starch granule was mounted on the aluminium specimen holder by double-sided tape. The samples were coated with platinum and examined under the microscope at an accelerating voltage of 15 kV with magnification of 4000X for taro and rice starches. As the starch granules of potato were much larger compared to rice and taro starches, micrographs of potato starch were taken with magnification of 1000X. Size of the starch granules were determined by measuring the diameters of 30 randomly selected granules from the micrographs.
X-ray diffraction analysis X-ray diffraction (XRD) analysis of the starch samples were carried out using X-ray diffractometer (Miniflex, Japan). The samples were exposed to X-ray beam at 15 mA and 30 kV. Data were recorded over a diffraction angle (2θ) range of 10° to 50° with a step angle of 0.05°. Percent crystallinity was determined by calculating the percentage ratio of diffraction peak area to the total diffraction area.
Solubility and swelling power Solubility and swelling power of the starches were determined by modified method of Torruco-Uco and Betancur-Ancona (2007). Starch (0.5 g) was dispersed in 20 ml distilled water in a pre-weighed 50 ml centrifuge tubes and kept in shaking water bath at 60, 70, 80 and 90°C for 30 min. The suspension was then centrifuged at 12,000 × g for 10 min. The supernatant was carefully decanted in a Petri dish and dried at 103°C for 12 h. After decantation the weight swollen granules were taken. The percentage solubility and swelling power were calculated using the following formulas:
Paste clarity and stability Paste clarity and stability of the starches were measured following the method described by Sandhu and Singh (2007). Aqueous starch suspension containing 1% starch was prepared by heating 0.2 g starch in 20 ml water in shaking water bath at 90°C for 1 h. The starch paste was cooled to room temperature. The starch pastes were stored at 4°C in refrigerator and the absorbance was measured at 640 nm in spectrophotometer (Spectrascan UV-2600, Thermo Fisher Scientific, India). The absorbance was measured after every 24 h for seven days to determine the stability of the pastes.
Pasting properties Pasting properties of the starches were evaluated using Rapid Visco-Analyzer (RVA), model StarcMaster2 from Newport Scientific, Australia. Viscosity profiles were recorded using 12.5% starch slurry in distilled water (total weight 28 g). A programmed heating and cooling cycle of 13 min was used where the samples were heated from 50°C to 95°C in 5 min, held at 95°C for 2 min, cooled from 95°C to 50°C in 4 min and held at 50°C for 2 min. Pasting temperature (PT), peak viscosity (PV), hold viscosity (HV), final viscosity (FV), breakdown viscosity (BV) and setback viscosity (SV) were recorded from the graph.
Differential scanning calorimetry Gelatinization properties of the starches were determined by differential scanning calorimetry (DSC) using a differential scanning calorimeter (DSC-60, Shimadzu, Singapore) as per method described by Jiranuntakul et al. (2011). Starch (3 mg) was weighed in the aluminum pans and water was added in the ratio of 1:3 for starch: water. The pans were sealed and allowed to stand for 12 h at 4°C for equilibration of moisture. The samples were scanned from 25 –120°C at 10°C/min. The equipment was calibrated with indium and an empty sealed pan was used as reference for all experiments. The onset temperature (To), peak temperature (Tp), conclusion temperature (Tc) and gelatinization temperature range (Tc-To) were noted from the graphs. The enthalpy of gelatinization was estimated by integrating the area between the thermograms and a base line under the peak and reported as joules per gram of dry starch.
Texture properties Starch pastes were prepared by heating a 2% aqueous suspension of starch (1 g starch in 50 ml distilled water) in a shaking water bath at 100°C for 30 min. The starch pastes were cooled to 25°C by keeping them in cooling water bath maintained at 25°C for 1 h. Textural properties such as firmness, consistency and cohesiveness of starch pastes were determined by back extrusion method in Texture Analyzer, TA.HDplus (Stable Micro Systems, UK) using a cylindrical probe (P-40). For measuring the textural properties, the cooled starch pastes were filled into the glass beakers provided by the manufacturer up to a height of 5 cm. The probe was allowed to penetrate 20 mm from the surface of the sample at a speed of 1 mm/s. Firmness, cohesiveness, consistency and index of viscosity were calculated from the graphs using the software Exponent Lite 32 provided with the instrument.
Fourier transform infra red analysis In order to determine the structure of the taro starches, Fourier transform infra red (FT-IR) spectra were obtained using FT-IR spectrometer (Spectrum 100, Perkin Elmer, USA). The spectra were recorded in absorbance mode from 4,000 to 400 cm−1 (mid-infrared region) at a resolution of 4 cm−1. Samples were thoroughly grounded with exhaustively dried pure KBr (1:100, w/w) and pellets were prepared by compression and analyzed. Background value from pure KBr was acquired before each sample was scanned.
Color of starch pastes Color parameters of the starch pastes containing 2% starch were measured using colorimeter (Ultrascan VIS, Hunterlab, USA). Results were expressed in CIELAB system. The starch pastes were filled in the sample container provided with the instrument and results were obtained in terms of L* (lightness), ranging from 0 (black) to 100 (white), a* (redness), ranging from +60 (red) to −60 (green), and b* (yellowness), ranging from +60 (yellow) to −60 (blue) values.
Color of starch (dry powder) Color of starch (dry powder) was measured using colorimeter (Ultrascan VIS, Hunterlab, USA). L, a* and b* values were noted. L is for lightness, a* for redness and b* yellowness.
Statistical analysis The data were subjected to single factor analysis of variance (ANOVA) using ‘Data Analysis Tool’ of ‘Microsoft Excel’. Fisher's ‘Least Significant Difference (LSD)’ method was used to determine the statistical difference between the results obtained.
Results and Discussion
Proximate composition and amylose content Analysis of proximate composition of the starches (Table 1) showed that the moisture content of the starches varied from 10.0 to 11.3% and were within safe limit for storage of starches without deterioration in quality of starches (Mweta et al., 2010). The protein content of rice starch was 1.3% which was significantly higher than taro and potato starches examined, as starch granules in rice grain are embedded in protein matrix which was difficult to separate from the granules and might have contributed to the protein content of rice starch. The fat and fiber content of the starches were very similar with slight differences existed between the samples. There were no significant differences between the ash content of the isolated starches from taro, potato, and rice.
Table 1.
Chemical composition and amylose content of starch samples.
| Sample1,2,3 |
Moisture |
Protein |
Fat |
Fibre |
Ash |
Starch |
Amylose |
| Kani |
11.3 ± 1.0a |
0.7 ± 0.2a |
0.3 ± 0.1ab |
0.2 ± 0.0bc |
0.7 ± 0.2a |
96.2 ± 1.2a |
16.2 ± 1.5c |
| Garu |
10.4 ± 0.9a |
0.5 ± 0.1a |
0.4 ± 0.1a |
0.2 ± 0.1ab |
0.6 ± 0.1a |
96.0 ± 1.3a |
13.2 ± 1.0c |
| Potato |
10.6 ± 1.2a |
0.4 ± 0.1a |
0.2 ± 0.1b |
0.1 ± 0.0c |
0.8 ± 0.4a |
97.1 ± 0.9a |
25.8 ± 2.1a |
| Rice |
10.0 ± 1.5a |
1.3 ± 0.3b |
0.3 ± 0.0ab |
0.2 ± 0.0a |
0.6 ± 0.1a |
95.7 ± 1.6a |
21.6 ± 2.1b |
1 Values reported as Mean ± Std. Dev. of three replications
2 Means followed by same small letter superscripts within a column are not significantly different (p > 0.05)
3 All values reported in % dry basis (db) except moisture which is reported as % wet basis (wb)
The purity of the isolated starches from taro varieties Kani and Garu were 96.2 and 96.0%, respectively which were less as compared to potato starch with a purity of 97.1% and rice starch with a purity of 95.7%. This might be due to high amount of mucilage in taro tubers compared to potato, and separation of starch from starch water containing mucilage become difficult, but the values are not significantly different from each other.
The amylose content of the taro starches were 16.2 and 13.2%, respectively for Kani and Garu variety of taro, which were significantly lower than potato and rice starch with amylose content of 25.8 and 21.6%, respectively. The amylose content of Kani taro were closer to Ahina and Mukakashi cultivars studied by the authors and that of Garu taro was closer to JCC37 and JCC57 cultivars investigated earlier (Sit et al., in press, a). This might be due to the fact that Kani, Ahina and Mukatakashi belonged to same variety i.e. antiquorum whereas Garu, JCC37 and JCC57 belonged to var. esculenta. The amylose content of all the six cultivars mentioned above were lower than another cultivar of North-East India studied by the authors locally known as Panchamukhi taro (Sit et al., in press, b). The results were in agreement with the findings of Mweta et al. (2010) for different varieties of taro starches which varied from 10.6 to 21.0%. Singh et al. (2004) reported amylose contents of native potato starches from 25.6 to 30.4% for several Indian varieties, whereas Talja et al. (2008) reported variation in amylose contents of native potato starches from 11.9 to 20.1% in Finland. For rice starch, amylose content varied from 21.9 to 31.6% (Ashogbon and Akintayo, 2012; Wang et al., 2010). Wickramasinghe and Noda (2008) reported variation in amylose content from 16.0 to 34.7% for Sri Lankan rice varieties and Chávez-Murillo et al. (2012) observed amylose contents from 18.4 to 22.9% for several Mexican rice cultivars.
Granule size and shape Scanning electron micrographs of the starches (Fig. 1) showed that starch granules from the two varieties of taro and that of rice are polygonal and irregular in shape while that of potato were oval or spherical in shape. The size of taro starch granules varied from 1.1 to 3.3 and 1.9 to 4.2 µm, respectively for Kani and Garu (Table 2). These observations agreed with the results obtained by Agama-Acevado et al. (2011) and Jane et al. (1992). The size of rice starch granules varied from 2.3 to 6.6 µm, while that of potato starch varied from 7.6 to 47.6 µm. It was evident from the micrographs that taro starch granules were much smaller than starch granules of potato with granules of Kani being the smallest, and were comparable with that of rice starch in size and shape of granules. It influences physicochemical and functional properties of starches like paste viscosity (Agama-Acevedo et al., 2011) and swelling volume and solubility (Moorthy et al., 2003; Torruco-Uco and Betancur-Ancona, 2007). Swelling of large granules was found to be higher compared to smaller granules which also affected the viscosity, as swelling is directly related to increase in viscosity.
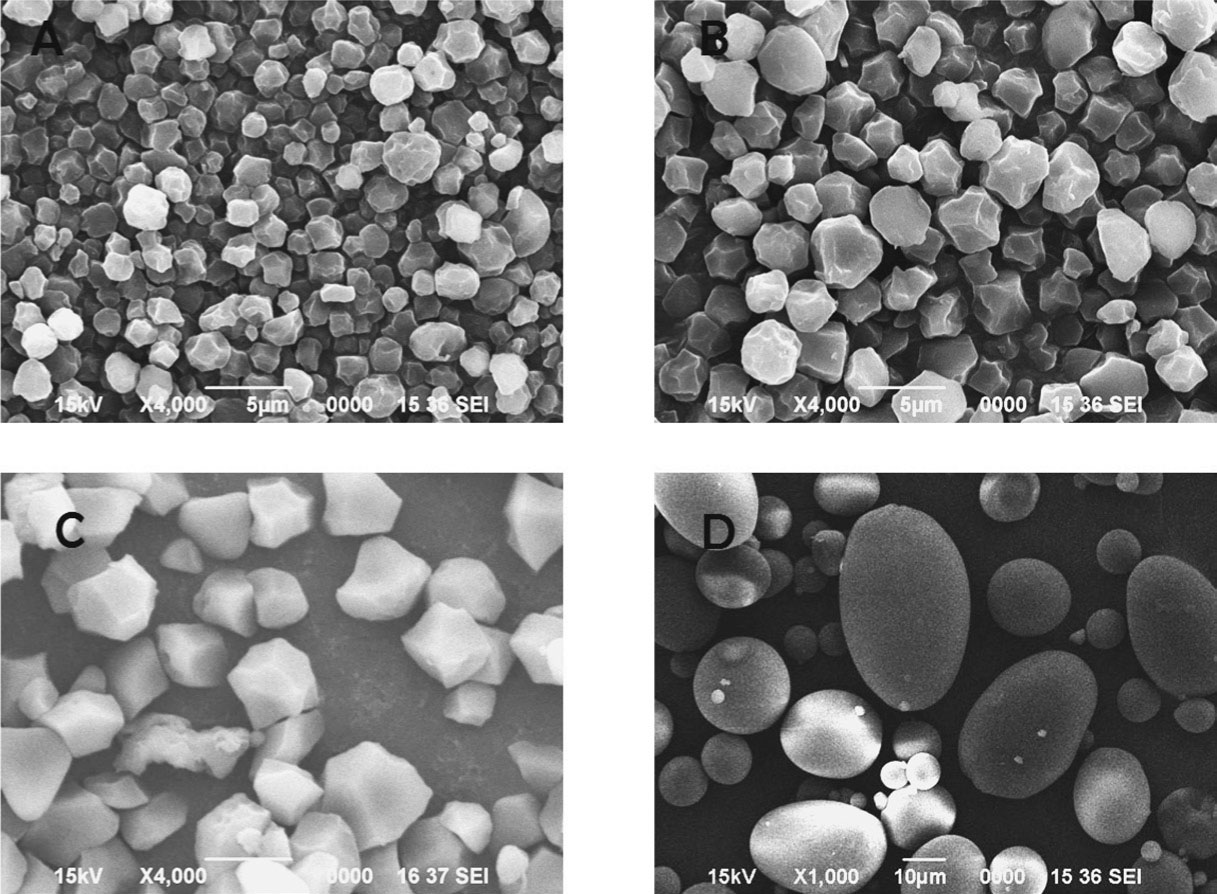
Table 2.
Granule size distribution, % crystallinity and position of peaks in X-ray diffractogram of starch samples
| Sample |
Grabule size distribution |
% Crystallinity |
Position of Strong Peaks (2θ) |
Position of Weak Peaks (2θ) |
| Range, µm |
Average Granule size1, 2, µm |
| Kani |
1.1 – 3.3 |
2.2 ± 0.7b |
40.3 |
15.4, 18.0, 23.4 |
30.4, 33.4 |
| Garu |
1.9 – 4.2 |
3.1 ± 0.8b |
39.1 |
15.45, 18.1, 23.3 |
31.1, 33.6 |
| Potato |
7.6 − 47.6 |
20.5 ± 11.6a |
23.6 |
17.2 |
11.6, 15.0, 22.3, 24, 34.4 |
| Rice |
2.3 – 6.6 |
4.3 ± 1.2b |
31.6 |
15.3, 18.0, 23.2 |
30.4, 34.0 |
1 Values of average granule size reported as Mean ± Std. Dev. of 20 granules
2 Avreage granule size followed by same small letter superscripts are not significantly different (p > 0.05)
X-ray diffraction pattern Percent crystallinity and diffraction angle of the strong and weak peaks are presented in Table 2. A-type XRD pattern was observed for taro starches and rice starch, and potato starch presented a B-type pattern (Fig. 2). Generally tuber starches have B or C-type pattern, but the taro starches investigated from both the varieties presented A-type pattern which is a characteristic of cereal starches. Properties like digestibility and retrogradation are affected by XRD pattern of the starches (Jane et al., 1992; Han and Bemiller, 2007) as A-type structure is more tightly packed and thought to be more stable than starches with B-type XRD pattern. Starches with A-type XRD pattern has also higher melting point compared to B-type starches (Gidley, 1987).

Fourier transform infra red spectra FT-IR spectra of the starch samples in the 4000–400 cm−1 region are shown in Fig. 3. The spectra obtained for the four starch samples were similar in the form and intensity of the major peaks, although the peaks in potato starch were not sharp. The spectra showed high absorption near the wave numbers 574, 930, 1016–1022, 1048, 1080, 1154, 1365, 1420, 1644, 2930 and 3380 cm−1 confirming the carbohydrate nature of the samples. The peaks at 3400 cm−1 and 2930 cm−1 could be attributed to O-H and H-C-H bond stretching, respectively while the peak at 1644 might be attributed to COO- stretching vibration in a carbohydrate group (Zeng et al., 2011; Fan et al., 2012). Peaks at 1420 cm−1 and 1365 cm−1 were attributable to the bending modes of H-C-H and C-H symmetric bending of CH3 (Zeng et al., 2011; Van Soest et al., 1994; Kauráková and Mathlouthi, 1996; Kizil et al., 2002). The FT-IR spectra obtained in the present work are not much different from the spectra obtained by the authors for the four cultivars of taro investigated earlier (Sit et al., in press, a), or for Cameroonian taro reported by Aboubakar et al. (2008) and rice starches reported by Fan et al. (2012).

Pasting properties The pasting properties of taro, potato and rice starches are shown in Table 3. It could be seen that starch from Kani was having the highest pasting temperature at 88.3°C, followed by Garu at 82.1°C and rice at 78.4°C. The pasting temperature of potato starch was found to be significantly lower at 68.8°C. The peak viscosity, hold viscosity and final viscosity of the taro starches were lower than that of rice starch and was not comparable with that of potato starch whose viscosities were much higher. The pasting properties of Kani taro was comparable to Muktakashi taro studied by the authors earlier, whereas that of Garu taro was similar to the other three cultivars investigated viz. Ahina, JCC37 and JCC57 (Sit et al., in press, a). Starch from Kani was more stable to shear thinning and had lower retrogradation when compared with starch from Garu or rice, which was evident from the lower values of breakdown viscosity and setback viscosity of Kani starch. The higher pasting temperature and lower values of final viscosity, breakdown viscosity and setback viscosity of Kani starch indicate that it could be used as stabilizers or thickeners in food products which are subjected to heating at higher temperature and change in viscosity is not desirable during heating and cooling.
Table 3.
Pasting properties of starches from taro, potato and rice.
| Sample1, 2 |
Pasting Temperature, °C |
Peak Viscosity, cP |
Hold Viscosity, cP |
Final Viscosity, cP |
Breakdown Viscosity, cP |
Setback Viscosity, sP |
| Kani |
88.3 ± 1.02a |
2129 ± 32.3d |
1575 ± 15.6d |
2203 ± 98.6d |
554 ± 46.3d |
628 ± 94.3b |
| Garu |
82.1 ± 1.15b |
4736 ± 45.6c |
2217 ± 23.2c |
2982 ± 103.2c |
2519 ± 54.3b |
765 ± 106.4b |
| Potato |
68.8 ± 0.96d |
10571 ± 29.2a |
6082 ± 16.3a |
6380 ± 156.3a |
4489 ± 78.2a |
298 ± 54.2c |
| Rice |
78.4 ± 1.06c |
5130 ± 36.4b |
2757 ± 21.1b |
4741 ± 69.4b |
2373 ± 36. 5c |
1984 ± 82.2a |
1 Values reported as Mean ± Std. Dev. of three replications
2 Means followed by same small letter superscripts within a column are not significantly different (p > 0.05)
Gelatinization properties The gelatinization properties of the starches are presented in Table 4. The peak gelatinization temperatures (Tp) of taro, potato and rice starches were significantly different from each other. The Tp of starches for the taro varieties were 74.7 and 74.1°C for Kani and Garu taro, respectively. The Tp for rice starch was 72.5°C, and for potato starch it was observed to be 65.6°C which was much lower compared to taro and rice starches. Park et al. (2007) and Wang et al. (2010) reported similar values for rice starches, Jiranuntakul et al. (2011) for rice and potato starches, and Mweta et al. (2010) for native taro starches of South Africa. The enthalpy of gelatinization (ΔH) of potato starch (15.3 J/g) was highest among the starches. The difference in the thermal behavior of the starches might be attributed to the amylose content (Bao et al., 2004) and crystallinity of the starch granules (Tester, 1997) as both taro and rice starches presented A-type XRD patterns. Wang et al. (2010) and Wickramasinghe & Noda (2008) observed variation in thermal behavior of rice varieties with variation in amylose contents and crystallinity. Potato starches exhibited broader range of gelatinization compared to taro and rice starches (Sandhu et al., 2005). The thermal properties of the starches were also found to be related to the granules size and degree of swelling of the starch granules. Potato starch being larger in size than taro and rice starch, swelled more and therefore had lower gelatinization temperature (Torruco-Uco and Betancur-Ancona, 2007). It was observed that the gelatinization behavior of the taro starches were comparable to rice starch, but were much different from potato starch.
Table 4.
Gelatinization properties of starch samples.
| Sample1, 2 |
To, °C |
Tp, °C |
Tc, °C |
Tc-To, °C |
ΔH, J/g |
| Kani |
66.1 ± 0.1b |
74.7 ± 0.1a |
77.9 ± 0.1b |
11.8 ± 0.1b |
13.4 ± 0.2b |
| Garu |
67.2 ± 0.1a |
74.1 ± 0.1b |
78.6 ± 0.1a |
11.3 ± 0.1c |
12.2 ± 0.3c |
| Potato |
58.6 ± 0.1c |
65.6 ± 0.1d |
71.3 ± 0.2c |
12.7 ± 0.2a |
15.3 ± 0.2a |
| Rice |
66.3 ± 0.2b |
72.5 ± 0.1c |
77.7 ± 0.1b |
11.4 ± 0.2c |
14.9 ± 0.2a |
1 Values reported as Mean ± Std. Dev. of three replications
2 Means followed by same small letter superscripts within a column are not significantly different (p > 0.05)
Swelling power and solubility The swelling power of Kani and Garu varied from 2.5 to 12.8 g/g and 2.3 to 13.7 g/g of starch, respectively when the temperature was increased from 60°C to 90°C. For potato and rice it varied from 2.5 to 36.8 and 3.3 to 12.6 g/g of starch, respectively with increase in temperature (Fig. 4). It was observed that at 60°C the differences in swelling power of all the starches were not significantly different. But as the temperature was increased potato starch swelled significantly higher compared to other starches investigated. Swelling of taro starches were not significantly different from each other at all temperatures and were comparable with that of rice starch. The reason for higher swelling power of potato starch might be attributed to the large size of the starch granules and higher amount of phosphate present in potato starch (Kim et al., 1996).

The solubility pattern of taro, potato and rice starches with temperature is shown in Fig. 4. The solubility of all the starches increased significantly with increase in temperature and the solubility of the starches at 90°C were much higher than at 80°C. The solubilities of the four starches were not significantly different at temperature up to 80°C, but at 90°C the solubility of the taro starches were significantly higher than those of potato and rice starch, which might be due to the very small size of the starch granules.
Starch paste clarity and stability The change in clarity of the starch pastes for a period of seven days was examined (Fig. 5). Potato starch showed highest light transmittance as compared to other starch pastes. The clarity of the rice starch paste was also significantly higher than the taro starches. Also, the stability of potato starch paste was higher than other starches as per cent light transmittance did not differ significantly for the storage period. Clarity of the taro starch pastes were lowest and were least stable. This might be due to the large size of the potato starch granules because of which less number of starch particles was present in the solution thereby scattering less amount of light (Singh et al., 2004). Taro starches being smaller in size scattered more amount of light. In addition, potato starch has B-type crystallinity and B-type starches exhibit better clarity than A-type starches (Moorthy, 2002). The lower stability of taro starch paste could be attributed to lower swelling of taro starch granules, as starch with higher swelling power are less susceptible to retrogradation which determines the stability of starch pastes (Nwokocha et al., 2009).

Texture properties The texture parameters of the starch pastes are shown in Table 5. The firmness of the taro starch pastes were 11.9 g for both the taro cultivars, while that rice starch paste was 11.38 g. The firmness of taro and rice starch pastes were not much different, but were significantly lower than potato starch paste with a firmness of 13.5 g. Similar trend was observed with consistency and cohesiveness of the starch pastes. The consistency of potato starch was 220.4 g.s which was significantly higher than the taro starches and rice starch. This might be due to larger granule size and higher viscosity of the potato starch as observed in SEM and pasting property analysis respectively. Lowest consistency was observed for rice starch. This might be attributed to higher setback viscosity of the rice starch as compared to other starches as observed earlier. The indexes of viscosity of all the starch pastes were low evincing that the viscosities of the starch pastes change rapidly with change in temperature. Taro starch pastes could be used in place of rice starch in many food applications as the texture properties of taro starch pastes were very similar to that of rice starch.
Table 5.
Texture and colour parameters of starch pastes.
| Sample1, 2 |
Texture properties |
Colour parameters |
| Firmness (g) |
Consistency (g.s) |
Cohesiveness (g) |
Index of viscosity (g.s) |
L* |
a* |
b |
| Kani |
11.9 ± 0.1b |
194.1 ± 1.2b |
7.2 ± 0.1c |
0.9 ± 0.2a |
22.3 ± 2.6c |
1.3 ± 0.5ab |
3.8 ± 0.8ab |
| Garu |
11.9 ± 0.6b |
195.3 ± 1.0b |
7.4 ± 0.2c |
0.9 ± 0.4a |
27.0 ± 3.2bc |
1.7 ± 0.1a |
5.0 ± 0.5a |
| Potato |
13.5 ± 0.2a |
220.4 ± 1.2a |
10.3 ± 0.1a |
1.0 ± 0.1a |
44.5 ± 5.0a |
1.1 ± 0.4ab |
5.0 ± 0.8a |
| Rice |
11.4 ± 0.1b |
191.6 ± 0.6c |
8.5 ± 0.1b |
1.2 ± 0.3a |
32.9 ± 1.9b |
0.8 ± 0.4b |
3.0 ± 0.7b |
1 Values reported as Mean ± Std. Dev. of three replications
2 Means followed by same small letter superscripts within a column are not significantly different (p > 0.05)
Color parameters The L*, a* and b* values of the starch pastes are shown in Table 5. It was observed that the lightness (L* value) of taro starch pastes were significantly lower than that of potato and were not significantly different from that of rice starch paste. The lightness of the pastes are related to granule size and swelling power of the starches (Moorthy, 2002; Nwokocha et al., 2009). The a* and b* values of all the starch pastes were not much significantly different from each other and were positive, indicating that the starch pastes were slightly reddish and yellowish in nature. Starch paste color is an important property of starch for industrial application and light colored pastes are preferred (Radley, 1976). The color quality of the starch pastes could be improved by application of certain chemicals which affects other functional properties of the starch (Rani et al., 1998). But in certain food applications where light color is not desirable like ketchups or sauces, taro starches might find useful application.
Color of starch (dry powder) Color is an important characteristic for determination of starch quality. The colour parameters of the starch (dry powder) samples are presented in Table 6. The isolated starches had high L* values and lower a* and b* values which confirm the high purity of the starches. The L* value of Kani (94.4) was the higher and Garu starch (93.3), but were lower than both potato (95.2) and rice (97.6) starch. Pérez Sira and Amaiz (2004) estimated that a value greater than 90 gives a satisfactory lightness for the purity of starch. Significant differences were not observed in the a* values. The higher b* values of taro starches indicated that they were slightly yellowish compared to rice or potato starches. The high L* values combined with low a* and b* values of the taro starches evinced that it could be conveniently used in products requiring clear and uniform color as with rice and potato starches.
Table 6.
Colour parameters of starch (dry powder) of different taro cultivars.
| Sample1, 2 |
L* |
a* |
b* |
| Kani |
94.4 ± 0.5c |
2.0 ± 0.4a |
4.3 ± 0.1b |
| Garu |
93.3 ± 0.6c |
1.9 ± 0.5a |
4.8 ± 0.1a |
| Rice |
97.6 ± 1.6a |
1.7 ± 0.4a |
2.7 ± 0.2c |
| Potato |
95.2 ± 0.3b |
1.7 ± 0.8a |
3.1 ± 0.2c |
1 Values reported as Mean ± Std. Dev. of three replications
2 Means followed by same small letter superscripts within a column are not significantly different (p > 0.05)
Conclusion
The present study reveals that taro starches examined have smaller granule size compared to potato starch and are closer to rice starch and make them suitable for many applications. The physicochemical properties of taro starches were found to be closer to that of rice starch and could be used as a substitute for rice starch and other cereal starches having similar properties in various food applications. Pasting property of taro starches particularly starch from Kani variety was found suitable for application where high paste temperature and, low and consistent viscosity was desirable.
Acknowledgement The authors acknowledge the financial grant received from MoFPI (Ministry of Food Processing Industries), New Delhi, India for carrying out the work.
References
- AACC. (1990). American Association of Cereal Chemists. Approved methods of the AACC (7th ed.). St. Paul, MN.
- Aboubakar, Njintang, Y. N., Scher, J., and Mbofung, C. M. F. (2008). Physicochemical, thermal properties and microstructure of six varieties of taro (Colocasia esculenta L. Schott) flours and starches. J. Food Eng., 86, 294-305.
- Agama-Acevedo, E., Garcia-Suarez, F. J., Gutierrez-Meraz, F., Sanchez-Rivera, M. M., Martin, E. S., and Bello-Pérez, L. A. (2011). Isolation and partial characterization of Mexican taro (Colocasia esculenta L.) starch. Starch/Stärke, 63, 139-146.
- AOAC. (1990). Official methods of analysis (15th ed.). Washington, DC: Association of Official Analytical Chemists.
- Ashogbon, A. O. and Akintayo, T. E. (2012). Isolation, composition, morphological and pasting properties of starches from rice cultivars grown in Nigeria. Starch/Stärke, 64, 181-187.
- Bao, J., Sun, M., Zhu, L., and Corke, H. (2004). Analysis of quantitative trait loci for some starch properties of rice (Oryza sativa L.): thermal properties, gel texture and swelling volume. J. Cereal Sci., 39, 379-385.
- Benesi, I. R. M., Labuschagne, M. T., Dixon, A. G. O., and Mahungu, N. M. (2004). Stability of native starch quality parameters, starch extraction and root dry matter of cassava genotypes in different environments. J. Sci. Food Agric., 84, 1381-1388.
- Chávez-Murillo, C. E., Méndez-Montealvo, G., Wang, Y-J., and Bello-Pérez, L. A. (2012). Starch of diverse Mexican rice cultivars: physicochemical, structural, and nutritional features. Starch/Stärke, 64, 745-756.
- Edison, S., Unnikrishnan, M., Vimala, B., Pillai, S. V., Sheela, M. N., Sreekumari, M. T., and Abraham, K. (2006). Biodiversity of tropical tuber crops in India. NBA Scientific Bulletin Number - 7. National Biodiversity Authority, Chennai, TamilNadu, India, 60.
- Fan, D., Ma, W., Wang, L., Huang, J., Zhao, J., Zhang, H., and Chen, W. (2012). Determination of structural changes in microwaved rice starch using Fourier transform infrared and Raman spectroscopy. Starch/Stärke, 64, 598-606.
- Gidley, M.J. (1987). Factors affecting the crystalline type (A-C) of native starches and model compounds: a rationalisation of observed effects in terms of polymorphic structures. Carbohydr. Polym., 161, 301-304.
- Griffin, G. and Wang, J-K. (1983). Industrial uses. In: Taro: A Review of Colocasia esculenta and Its Potentials. J.-K. Wang, ed. University of Hawaii Press: Honolulu. pp.301.
- Han, J. A. and Bemiller, J. N. (2007). Preparation and partial characteristics of slowly digestion modified food starches. Carbohydr. Polym., 67, 366-374.
- Hirai, M., Nakamura, K., Imai T., and Sato, T. (1993). cDNAs encoding for storage proteins in the tubers of taro (Colocasia esculenta Schott). Jpn. J. Gen. 1993, 68, 229-236.
- Jane, J., Shen, L., Chen, J., Lim, S., Kasemsuwan, T., and Nip, W. K. (1992). Physical and chemical studies of taro starches and flours. Cereal Chem., 69, 528-535.
- Jiranuntakul, W., Puttanlek, C., Rungsardthong, V., Punchaarnon, S., and Uttapap, D. (2011). Microstructural and physicochemical properties of heat-moisture treated waxy and normal starches. J. Food Eng., 104, 246-258.
- Kauráková, M. and Mathlouthi, M. (1996). FTIR and laser-Raman spectra of oligosaccharides in water: Characterization of the glycosidic bond. Carbohydr. Res., 284, 145-157.
- Kim, Y. S., Wiesenborn, D. P., Lorenzen, J. H., and Berglund, P. (1996). Suitability of edible bean and potato starch noodles. Cereal Chem., 73, 302-308.
- Kizil, R., Irudayaraj, J., and Seetharaman, K. (2002). Characterization of irradiated starches by using FT-Raman and FTIR spectroscopy. J. Agric. Food Chem., 50, 3912-3918.
- Lakhanpaul, S., Velayudhan, K.C., and Bhat. K.V. (2003). Analysis of genetic diversity in Indian taro [Colocasia esculenta (L.) Schott] using random amplified polymorphic DNA (RAPD) markers. Gen. Reso. and Crop Evolu., 50, 603-609.
- Lim, S., Jane, J., Rajagopalan, S., and Seib, P. A. (1992). Effect of starch granule size on physical properties of starch-filled polyethylene film. Biotechnol. Progr., 8, 51-57.
- Lu, T., Lin, J., Chen, J., and Chang, Y. (2008). Characteristics of taro (Colocasia esculenta) starches planted in different seasons and their relations to the molecular structure of starch. J. Agric. Food Chem., 56, 2208-2215.
- Matsunaga, N. and Seib, P. A. (1997). Extraction of starch with aqueous sodium hydroxide. Cereal Chem., 74, 851-857.
- McGrance, S. J., Cornell, H. J., and Rix, J. C. (1998). A simple and rapid colorimetric method for the determination of amylose in starch products. Starch/Stärke, 50, 158-163.
- Moorthy S.N., Thankamma Pillai, P.K., and Unnikrishnan M. (2003). Variability in starch extracted from taro. Carbohydr. Polym., 20, 169-173,
- Moorthy, S. N. (2002). Physicochemical and Functional Properties of Tropical Tuber Starches: A Review. Starch/Stärke, 54, 559-592.
- Mweta D. E., Labuschagne, M. T., Bonnet S., Swarts J., Saka J. D. K., Isolation and physicochemical characterization of starch from cocoyam (Colocasia esculenta) grown in Malawi. J. Sci. Food Agric., 90, 1886-1896.
- Nand, A. V., Charan, R. P., Rohindra, D., and Khurma, J. R. (2010). Isolation and properties of starch from some local cultivars of cassava and taro in Fiji. The South Pacific J. Nat. Sc. 2008, 26, 45-48.
- Nwokocha, L. M., Aviara, N. A., Senan, C., and Williams, P. A. (2009). A comparative study of some properties of cassava (Manihot esculenta, Crantz) and cocoyam (Colocasia esculenta, Linn) starches. Carbohydr. Polym., 76, 362-367.
- Park, I-M., Ibáñez, A. M., Zhong, F., and Shoemaker, C. F. (2007). Gelatinization and pasting properties of waxy and non-waxy rice starches. Starch/Stärke, 59, 388-396.
- Pérez Sira, E. E. and Amaiz, M. L. (2004). A laboratory scale method for isolation of starch from pigmented sorghum. J. Food Eng., 64, 515-519.
- Purseglove, J.W. (1972). Tropical crops- Monocotyledons. Longman London.
- Radley, J. (1996). Examination and analysis of starch and its derivatives, Applied Science Publishers Ltd, London.
- Rani, V. S., John, J. K., Moorthy, S. N., and Raja, K. C. M. (1998). Effect of pre-treatment of fresh Amorphophallus paeoniifolius tubers on the physicochemical properties of starch. Starch/Stärke, 50, 72-77.
- Sandhu, K. S. and Singh, N. (2007). Some properties of corn starches II: Physicochemical, gelatinization, retrogradation, pasting and gel textural properties. Food Chem., 101, 1499-1507.
- Sandhu, K. S., Singh, N., and Malhi, N. S. (2005). Physicochemical and thermal properties of starches separated from corn produced from crosses of two germ pools. Food Chem., 89, 541-548.
- Sefa-Dedeh, S. and Sackey, E. K. (2002). Starch structure and some properties of cocoyam (Xanthosoma sagittifolium and Colocasia esculenta) starch and raphides. Food Chem., 79, 435-444.
- Singh, J., Kaur, L., and Singh, N. (2004). Effect of acetylation on some properties of corn and potato starches. Starch/Stärke, 56, 586-601.
- Sit, N., Misra, S., and Deka, S. C. (in press, a). Physicochemical, functional, textural and colour characteristics of starches isolated from four taro cultivars of North-East India. Starch/Stärke, DOI: 10.1002/star.201300033.
- Sit, N., Misra, S., Baruah, D., Badwaik, L. S., and Deka, S. C. (in press, b). Physicochemical properties of taro and maize starch and their effect on texture, colour and sensory quality of tomato ketchup. Starch/Stärke, DOI: 10.1002/star.201300120.
- Sugimoto, Y., Ohnishi, K., Takaya, T., and Fuwa, H. (1979). Comparative susceptibility to pancreatin of starch granules from different plant species. J. Jpn. Soc. Starch Sci., 26, 182-190.
- Talja, R. A., Peura, M., Serimaa, R., and Jouppila, K. (2008). Effect of amylose content on physical and mechanical properties of potato-starch-based edible films. Biomacromol., 9, 658-663.
- Tari, A. T. and Singhal, R. S. (2002). Starch based spherical aggreghates: stability of a model flavoring compound, vanillin entrapped therein. Carbohy. Polym., 50, 417-421.
- Tester, R. F. (1997). Starch: the polysaccharide fractions. In Frazier P. J., Richmond P. and Donald A. M. (Eds.), Starch, structure and functionality. Royal Society of Chemistry, pp.163-171.
- Torruco-Uco, J. and Betancur-Ancona, D. (2007). Physicochemical and functional properties of makal (Xanthosoma yucatanensis) starch. Food Chem., 101, 1319-1326.
- Van Soest, J., De Wit, D., Tournois, H., and Vliegenthart, J. (1994). Retrogradation of potato starch as studied by FTIR. Starch/Stärke, 46, 453-457.
- Wang, L. and Wang, Y-J. (2001). Comparison of protease digestion at neutral pH with alkaline steeping method for rice starch isolation. Cereal Chem., 78, 690-692.
- Wang, L., Xie, B., Shi, J., Xue, S., Deng, O., Wei, Y., and Tian, B. (2010). Physicochemical properties and structure of starches from Chinese rice cultivars. Food Hydrocolloid., 24, 208-216.
- Wickramasinghe H. A. M. and Noda, T. (2008). Physicochemical properties of starches from Sri Lankan rice varieties. Food Sci. Technol. Res., 14, 49-54.
- Zeng, J., Li, G., Gao, H., and Ru, Z. (2011). Comparison of A and B starch granules from three wheat varieties. Molecules, 16, 10570-10591.
- Zhao, J. and Whistler, R. L. (1994). Spherical aggregates of starch granules as flavor carriers. Food Technol., 48, 104-105.
