Original papers
Effects of Cellulose, Lignin and Hemicellulose on the Retrogradation of Rice Starch
2014 年 20 巻 2 号 p. 375-383
詳細
2014 年 20 巻 2 号 p. 375-383
Effects of cellulose, lignin and hemicellulose on the retrogradation of rice starch were investigated by RVA, Texture profile analysis, FTIR, XRD and SEM. Results showed that those three elements all delayed the retrogradation of rice starch. Among them, the best effect was hemicellulose, cellulose second, and lignin was the worst. RVA expressed that the addition group had lower but more stable pasting temperature and setback. Texture profile analysis demonstrated that the addition group had a lower hardness but higher adhesiveness. XRD analysis indicated that the addition group had no change in crystalline structure but had a lower degree of crystallinity being compared with the control group. FTIR revealed that addition of them had an interaction with starch by hydrogen-bond and a lower absorbance ratio (A1047/A1022). SEM confirmed that cellulose, lignin and hemicellulose will associate with starch, through reducing the chances of starch chains combining with themselves so as to retard staling.
Rice is a staple food for nearly one-half of the world's population. Milled rice contains 90% of starch and the properties of starch will deeply affects the quality of rice and its products. Similarly to other cereal starch, there are some negative aspects such as gel retrogradation and easily producing undesirable weak-bodied, cohesive, rubbery pastes or gels under cooking, high shear or acidic conditions (BeMiller, 2007). It is commonly undesirable and it can be controlled by chemical modifications (Wurzburg, 1986). However, chemical modifications are very expensive. Another substitute for the expensive chemical modification is the blending of native rice starch with polysaccharide hydrocolloids (Appelqvist and Debet, 1997).
It was reported that the pasting and rheological properties of starch or flour dispersions (Bonnand-Ducasse et al., 2010) and textural characteristics of starch goods (Girhammar et al., 1986) were evidently affected by the presence of non-starchpolysaccharides. Dietary fiber (DF) is a non-starch polysaccharide complex that comes from the edible parts of plants or analogous carbohydrates. It is resistant to digestion and absorption in the human small intestine, but undergoes complete or partial fermentation in the large intestine. Recently, increasing interest in dietary fiber between health and nutrition has driven a wide range of research and has gained extensive public attention (Abdul and Luan, 2000). Dietary fibers can give a wide range of functional properties when they are incorporated in food systems. Due to fiber's water-binding capacity, gel-forming ability, fat mimetic, anti-sticking, anti-clumping, texturising and thickening effects, it contributes to the modification and improvement of texture, sensory characteristics and shelf-life of foods (Cho and Dreher, 2001; Thebaudin et al., 1997). Studies on the addition of Dietary fiber to bread indicate that bread with DF gives a longer shelf life, higher water content and a softer crumb which could be the possible interaction between fiber and starch that would slow down starch retrogradation(Gomez et al., 2003; Moazzezi et al., 2012).
Dietary fiber can be classified into two major parts on the basis of solubility: soluble components, such as pectins, gums, and β-glucans; and insoluble components, which include cellulose, lignin, and hemicelluloses (Happi et al., 2008; Nawirska and Kwa, 2005; Vergara et al., 2007). There are some reports about the effect of these soluble components on gelatinization(Jung et al., 2011., Funami et al., 2008., Sripattra and Manop, 2007; Rawiwan and Manop, 2009) and retrogradation (Sripattra and Manop, 2007; Rawiwan and Manop, 2009; Angioloni and Collar, 2011) properties of starch. However, the main fibers in which nutritionists and health scientists are interested in cellulose, hemicellulose and lignin (Kelsay, 1978). In addition, as we know, only a few studies on the effects of cellulose, hemicellulose and lignin on retrogradation properties of rice starch had been investigated.
The aim of this study was to investigate the effects of cellulose, hemicellulose and lignin on the retrogradation of rice starch with a limited level of added cellulose, hemicellulose and lignin (5 wt. % on starch basis) (Lai et al., 2011) by RVA, Texture profile analysis, FTIR, XRD and SEM.
Materials Cellulose (Sigma, USA, S3504); lignin, alkali (Sigma-Aldrich, USA, 370959); hemicellulose extracted from rice bran with purity of 92.24%; rice starch (Puer Yongji Biological & Technique Co.,Ltd., China, 201181801) contained 12.9% amylase and all the chemicals used were of analytical grade.
Preparation of gelatinization and retrogradation of rice starch It was performed according to (Huang et al., 2007) with some modification. Three beakers and three plastic cups were taken each time; 30 g of rice starch was weighed in each beaker and 10 g rice starch was weighed in each plastic cups (It was prepared for Textural analysis). Cellulose, lignin or hemicellulose (at 5 wt. % on dry starch basis) was placed into the weighed rice starch respectively and a certain amount of water (1: 2; w/v) was added. An additional sample with no dietary fiber composition was also prepared as a control group. These samples were immersed in the water of 100°C for 30 minutes and then all samples were placed into the refrigerator at 4 for 0d, 1d, 3d, 7d and 12d. Lastly, they were freeze-dried except those samples for Textural analysis.
Extract of hemicellulose from rice bran The extraction of hemicellulose was performed according to Gremli et al. (1970). Rice bran (270 g) was repeatedly mixed and rinsed with water, suspended in boiling water for 20 min and cooled. The washed residue was digested with α-amylase (Wallerstein Co., Staten Island, N. Y., negative for pentosanase). Thus, the orcinol reagent estimated that the starch-free residue (70 g) contained 14% of pentosans. Using 0.5 M NaOH under nitrogen, this basic preparation was extracted thrice. The combined extract was neutralized with glacial acetic acid and centrifuged. Lastly, trichloroacetic acid was used to treat the supernatant to a final pH of 3.7 and centrifuged. In order to precipitate the hemicelluloses, the resulting supematant was neutralized with NaOH and treated with ethanol.
Textural analysis The aged rice starch sample which was prepared in the plastic cups was taken out and thawed at room temperature (25 ± 2°C) for 120 min. After thawing, the textural analysis of rice starch was performed according to (Charoenrein and Preechathammawong, 2010) with some modification. The thawed rice starch gel was transferred into a rectangular mold (about 150 × 40 mm and 30 mm deep which had a gap for sample cutting) and the middle of the gel was cut into a sample 20 mm in length. With a Stable Micro System (TA-XT plus) Texture Analyzer (Surrey, UK), the texture was determined by using Texture Profile Analysis method (three replicates per treatment). By compressing the samples with a probe (P0.5R) using a test speed of 0.5 mm/s, the deformation level was 40% of the original sample height when the gels were compressed twice. Hardness was expressed as the maximum force applied during the first compression cycle.
RVA analysis To analyze the retrogradation properties of aged rice starch, frozen and dried samples were ground by over 100 griddles. The pasting and retrogradation properties of the various samples were determined with a rapid visco analyser (Newport Scientific, Warriewood, NSW, Australia). After examining sample masses in the range from 2.0 to 3.5 g, the conditions of sample mass and temperature profile were determined as optimum. Rice flour (2.8 g; 12% moisture) was slurried with distilled water (25 mL). The temperature profile involved an initial 10 s high-speed (960 rotations min-1) stir that dispersed the sample prior to the beginning of the measuring phase at 160 rotations min−1. Temperature was held at 50°C for 1 min and raised to 95°C after 3.75 min, next, held for 2.5 min and cooled to 50°C within 3.75 min and held for another 5 min (Ross et al., 1987).
X-Ray diffraction Approximately 1 g of sample was pressed into a 10 – 25 mm pellet with a hydraulic press. Using a Siemens D5000 X-ray diffraction instrument (Rigaku Corporation, Japan), X-ray diffraction pattern was obtained. Under conditions of 40 KV, 30 mA, with the scanning angle 2 q set from 2° to 36° at a scanning rate of 0.6 °/min, X-ray diffractograms were obtained. Using the method of (Hermans and Weidinger, 1948) the Relative crystallinity (RC) of starch was determined, the area of the crystalline fraction (ac) is divided by the diffraction area for a 100% crystalline substance (Ac) as described by (Nara et al. 1978). In this study, the area of the crystalline fraction in raw commercial starch XRD pattern was used as the value of Ac at 100% (Dragsdorf and Varriano, 1980).
FTIR measurement In order to analyze the infrared, frozen and dried aged rice starch samples were grinded by over 100 griddles. Information on the structural order of starch chains near t he granule surface was provided by FTIR, since the infrared beam penetrates only to a depth of 2 µm into the granule (Sevenou et al., 2002). All infrared spectra were obtained on a Nicolet Nexus 470 spectrometer (Thermo Electron Corporation, Waltham, MA, USA) equipped with a deuterated triglycine sulphate (DTGS) detector using the Digilab attenuated total reflectance (ATR) accessory at 4 cm−1 resolution by 64 scans. Using an empty cell as background, each spectrum was recorded and was subtracted from the spectrum of air. Spectra were baseline-corrected and deconvoluted by drawing a straight line at 1200 cm−1 and 800 cm−1 (using Omnic version 6.2 software). The absorbance ratio of 1047 cm−1/1022 cm−1 was obtained from the deconvoluted spectra.
Scanning electron microscopy (SEM) To analyze the electronic microscope analysis, frozen and dried aged rice starch samples were grinded by over 100 and were mounted on aluminum nails. The microstructural images were obtained using a scanning electron microscope (FEI Company, Hillsboro, Oregon, USA) at 2500 magnification and at an accelerating voltage of 20 kV.
Statistical analysis Data reported are means of duplicate determinations. The data were analyzed using the SPSS (SPSS Inc., 1998, Chicago, IL, USA) version 9.0 for Windows (Duncan's test). Significance differences were used at p < 0.05.
Textural properties In the process of storage, the hardness and adhesiveness of starch effectively reflects the extent of retrogradation. If the degree of retrogradation is greater, the hardness will be higher and the adhesiveness will be lower. (Devesa and Anaya, 2003). The hardness and adhesiveness of rice starch pastes with and without lignin, cellulose or hemicellulose are presented in Table 1, we can find that rice starch gelatinization (0 days) in control, lignin(SL), cellulose(SC) and hemicelluloses(SH), their hardness were: 212.64, 265.56, 242.21 and 222.11, while adhesiveness were: 74.13, 66.53, 64.65 and 68.31. In contrast, hardness and adhesiveness of addition group increased in different degrees, because cellulose, hemicellulose, and lignin had effect on the gelatinization of rice starch.
| Days | Hardness (N) | Adhesiveness (N·s) | ||||||||
|---|---|---|---|---|---|---|---|---|---|---|
| 0 | 1 | 3 | 7 | 12 | 0 | 1 | 3 | 7 | 12 | |
| None (control) | 212.64 ± 1.65a | 375.13 ± 2.91c | 421.85 ± 1.87c | 468.15 ± 5.01d | 476.28 ± 5.46d | 74.13 ± 0.06d | 46.65 ± 0.33c | 22.21 ± 2.83b | 6.33 ± 0.02a | 3.31 ± 0.78a |
| Lignin | 265.56 ± 1.26b | 323.79 ± 2.99c | 389.32 ± 1.35c | 436.12 ± 4.39c | 442.12 ± 2.89c | 66.53 ± 0.13d | 44.34 ± 2.99c | 28.31 ± 2.88b | 18.21 ± 0.92b | 17.02 ± 0.01b |
| Cellulose | 242.21 ± 0.32c | 288.34 ± 2.81b | 332.12 ± 2.75b | 371.31 ± 0.25a | 376.19 ± 0.07a | 64.65 ± 3.99cd | 44.12 ± 2.70c | 31.32 ± 0.06a | 23.83 ± 0.37c | 23.15 ± 0.47c |
| Hemicellulose | 222.11 ± 1.50a | 248.34 ± 4.24a | 284.21 ± 1.44a | 320.12 ± 0.23b | 323.31 ± 0.21b | 68.31. ± 1.34c | 51.12 ± 2.81b | 41.10 ± 0.10c | 36.18 ± 0.50d | 35.85 ± 0.59d |
Values are the means of duplicate ± standard deviation. Significant differences in each column are expressed as different letters (p < 0.05).
After storing the samples for 1 day, the hardness of control, SH, SL and SC increased while adhesiveness reduced, a similar result was also reported by Yu et al. (2009). The widest range of changes in hardness and adhesiveness was control, SL second, SC third and the narrowest was SH. As storage time continued to increase, the hardness of the four groups continued to rise while adhesiveness decreased, during the first 7 days, changes were obvious and tend to be stable afterwards. At the 12th day, hardness of control, SL, SC and SH were: 476.28, 442.12, 376.19 and 323.31 while adhesiveness was: 3.31, 17.02, 23.15 and 35.85. We found that they had a certain retarding effect on the retrogradation of rice starch in the following decreasing order: SH > SC > SL. It might be that hemicellulose, cellulose and lignin interact with starch, moisture loss is reducing. Moisture is lower, hardness is higher and adhesiveness is lower (Sharadanant, and Khan 2003). Similar results were obtained when some hydrocolloids were put into bread (Guarda et al., 2004).
RVA In the analysis of RVA, low pasting temperature means faster swelling, while high setback means great degree of aging (Wu et al., 2010; Liang et al., 2002). In Table 2, the gelatinization temperature and the setback of control were respectively 81.50 (°C) and 1188.00 (mpa·s) at “0” day. After the addition of hemicellulose, cellulose and lignin, the temperature of starch gelatinization respectively increased to 89.80, 87.65 and 85.00, but setback decreased to 1136.00, 1164.00 and 1178.00. The pasting temperature also rose when insoluble dietary fiber was added into noodle (Aravind et al., 2012).
| Days | Pasting temperature(°C) | Setback(mpa·s) | ||||||||
|---|---|---|---|---|---|---|---|---|---|---|
| 0 | 1 | 3 | 7 | 12 | 0 | 1 | 3 | 7 | 12 | |
| None (control) | 81.50 ± 0.42a | 87.70 ± 0.14b | 89.70 ± 0.50c | 91.55 ± 0.62d | 91.80 ± 0.13d | 1188.00 ± 0.70a | 1464.00 ± 0.37b | 1629.00 ± 1.02c | 1870.00 ± 0.66d | 1899.00 ± 0.18e |
| Hemicellulose | 89.80 ± 0.80b | 91.70 ± 0.65c | 90.25 ± 0.01bc | 89.35 ± 0.11b | 87.74 ± 0.19a | 1136.00 ± 0.67a | 1141.00 ± 1.42b | 1147.00 ± 0.49c | 1139.00 ± 0.8a | 1151.00 ± 0.12d |
| Cellulose | 87.65 ± 0.16b | 89.35 ± 0.28b | 87.45 ± 0.01a | 87.20 ± 0.29a | 87.04 ± 1.16a | 1164.00 ± 0.71c | 1172.00 ± 1.41d | 1158.00 ± 1.42ab | 1154.00 ± 0.35a | 1159.00 ± 0.70b |
| Lignin | 85.00 ± 0.11b | 86.20 ± 0.49b | 85.47 ± 0.48a | 84.72 ± 0.11a | 85.01 ± 0.23a | 1178.00 ± 2.12c | 1188.00 ± 1.42d | 1174.00 ± 0.69c | 1168.00 ± 0.46b | 1154.00 ± 2.11a |
Values are the means of duplicate ± standard deviation. Significant differences in each column are expressed as different letters (p < 0.05).
In the first day of storage, the setback and pasting temperature of control both rose in a different range, It indicated that aging occurred in the process. As the storage time increased, the Setback and pasting temperature of control gradually rose.
However, after addition with hemicellulose, lignin and cellulose, the gelatinization temperature and Setback fluctuated, but the range was very small, basically in a stable state. Generally speaking, the Setback and gelatinization temperature of the addition group (SL, SC and SH) were lower than the control group. Because of starch's interaction with hemicellulose, lignin and cellulose, it forms a membrane structure on the surface of the starch paste and separates water and starch molecules, so that it avoids the heating process of starch hydrolysis to strengthen the stableness of setback and gelatinization temperature of the addition group. Some reports showed similar findings, lignin structure has a certain amount of phenolic hydroxyl and carboxyl, and they made lignin have strong chelating and colloidal properties enabling them to associate with starch (Maximova, 2004; Mousavioun, 2011). Hemicellulose has good adhesivity and absorbing properties. At the same time, it is a kind of high branched arabinoxylan, is able to interact with starch to form a stable complex (Aguilea et al., 2011). Cellulose has a strong tendency to form intra- and intermolecular hydrogen bonds, which can adhere to starch chain (Vitale, 1988).
XRD The XRD was used to present characteristics of crystalline structures of starch (Wu, and Sarko, 1978). We can know that there were no change in the crystalline structures of addition group in Fig. 1. At the “0” day of storage in Table 3, in contrast to control (3.63%), starch crystallinity with SH, SL and SC respectively increased to 5.48%, 5.03% and 4.93%. This phenomenon may be ascribed to the association of cellulose, hemicellulose, and lignin with starch, inhibiting the swelling of starch and leading to a rise in relative crystallinity.

X-ray diffraction spectra of rice starch retrograded for 7 days in control, lignin, cellulose and hemicellulose (top to bottom).
| Days | Crystallinity(%) | |||
|---|---|---|---|---|
| 0 | 1 | 7 | 12 | |
| None (control) | 3.63 ± 0.28a | 10.05 ± 0.25b | 16.65 ± 0.42a | 17.08 ± 0.20c |
| Hemicellulose | 5.48 ± 0.19b | 8.55 ± 0.28a | 11.83 ± 0.77b | 11.98 ± 0.26b |
| Cellulose | 5.03 ± 0.29b | 11.14 ± 0.07b | 14.15 ± 0.57c | 14.46 ± 0.66d |
| Lignin | 4.93 ± 0.27a | 11.07 ± 0.33b | 15.04 ± 0.04c | 15.57 ± 0.15c |
Values are the means of duplicate ± standard deviation. Significant differences in each column are expressed as different letters (p < 0.05)
During the following process of storage, the crystallinity of starch in control gradually rose. It increased at a fast speed in the first 7 days but changed slowly afterwards, a similar result was also reported by Fama et al. (2007). At the 12th day of storage, the crystallinity was 17.08%. Similarly, the crystallinity of SL, SC and SH gradually improved as storage days increased. Being compared with the control, the crystallinity of samples increased more slowly during the storage of 12 days. The degrees of crystallinity at 12th day were 11.98%, 14.46% and 15.57%, respectively. We knew that the degrees of crystallinity were lower than the control, it indicated that cellulose, hemicellulose and lignin could retard the recrystallization of starch. Because they might associate with starch and the chances of starch chains combining with themselves would be reduced so as to retard recrystallization. Hydroxypropyl methylcellulose possible inhibition of the amylopectin retrogradation, since HPMC prefer binding to starch (Collar, 2001), and in consequence avoid starch-gluten interactions, retard the recrystallization of starch (Guarda et al., 2004).
FTIR The absorbance ratio (A1047/A1022) can reflect the process of starch aging, because 1047 cm−1 is starch crystalline region while 1022 cm−1 is starch non-crystalline region (Morales et al., 2012; Sevenou et al., 2002). Similarly, the larger the absorbance ratio (A1047/A1022), the greater the degree of aging (Soest et al., 1994). In Table 4, during the storage of “0” day, the absorbance ratio (A1047/A1022) of SC, SH and SL rose slightly in comparison with that of the control, the order of the increase was lignin < cellulose < hemicellulose. In the process of storage, the absorbance ratio (A1047/A1022) of control rose gradually to 0.42, 0.78, 1.22 and 1.28 respectively, the changes in the first 7 days were obvious and had a slight increase in the last 5 days. A similar result was also reported by Smits et al. (1998).
| Days | A1047/A1022 | |||
|---|---|---|---|---|
| 0 | 1 | 7 | 12 | |
| None (control) | 0.42 ± 0.028a | 0.78 ± 0.014b | 1.22 ± 0.042c | 1.28 ± 0.014c |
| Hemicellulose | 0.49 ± 0.013b | 0.60 ± 0.043a | 0.90 ± 0.071b | 0.91 ± 0.057b |
| Cellulose | 0.48 ± 0.029c | 0.65 ± 0.007c | 1.04 ± 0.057d | 1.07 ± 0.070b |
| Lignin | 0.45 ± 0.014a | 0.68 ± 0.03c | 1.08 ± 0.040d | 1.12 ± 0.015d |
Values are the means of duplicate ± standard deviation. Significant differences in each column are expressed as different letters (p < 0.05).
At the 7th day, the absorbance ratio (A1047/A1022) of SL, SC and SH were 1.08, 1.04 and 0.90, which was in agreement with data from FTIR (Fig. 2). As the storage time increased, absorbance ratio (A1047/A1022) of SC, SH and SL also increased gradually, but the rate of rising was at a lower rate compared with control. At the 12th day of storage, their absorbance ratio (A1047/A1022) were 0.91, 1.07 and 1.12, but they were lower than the control (1.28). It showed that they had some effect on retarding the retrogradation of starch. The smallest absorbance ratio was SH, SC second, SL third, and control was the highest (A1047/A1022).

FTIR spectra of rice starch retrograded for 7 days in hemicellulose, cellulose, lignin and control (top to bottom).
It also accord with the result from Fig. 3. It showed that each addition group had a broader and stronger band between 3200 cm−1 and 3550 cm−1, which was attributed to the complex vibrational stretches of intermolecular hydroxyl groups (Li, 2004). At the same time, with the addition of hemicellulose, cellulose and lignin in rice starch, comparing with control (3447.87 cm−1), their peak decreases to a lower rate being 3415.01 cm−1, 3421.24 cm−1 and 3423.19 cm−1, the stronger the hydrogen bonds, the greater the displacement (He, 1992). It indicated that hydrogen bonding was among hemicellulose, cellulose and lignin with starch so that it reduced inter linking of starch to retard retrogradation. The best effect is hemicellulose, cellulose second and lignin is the worst.
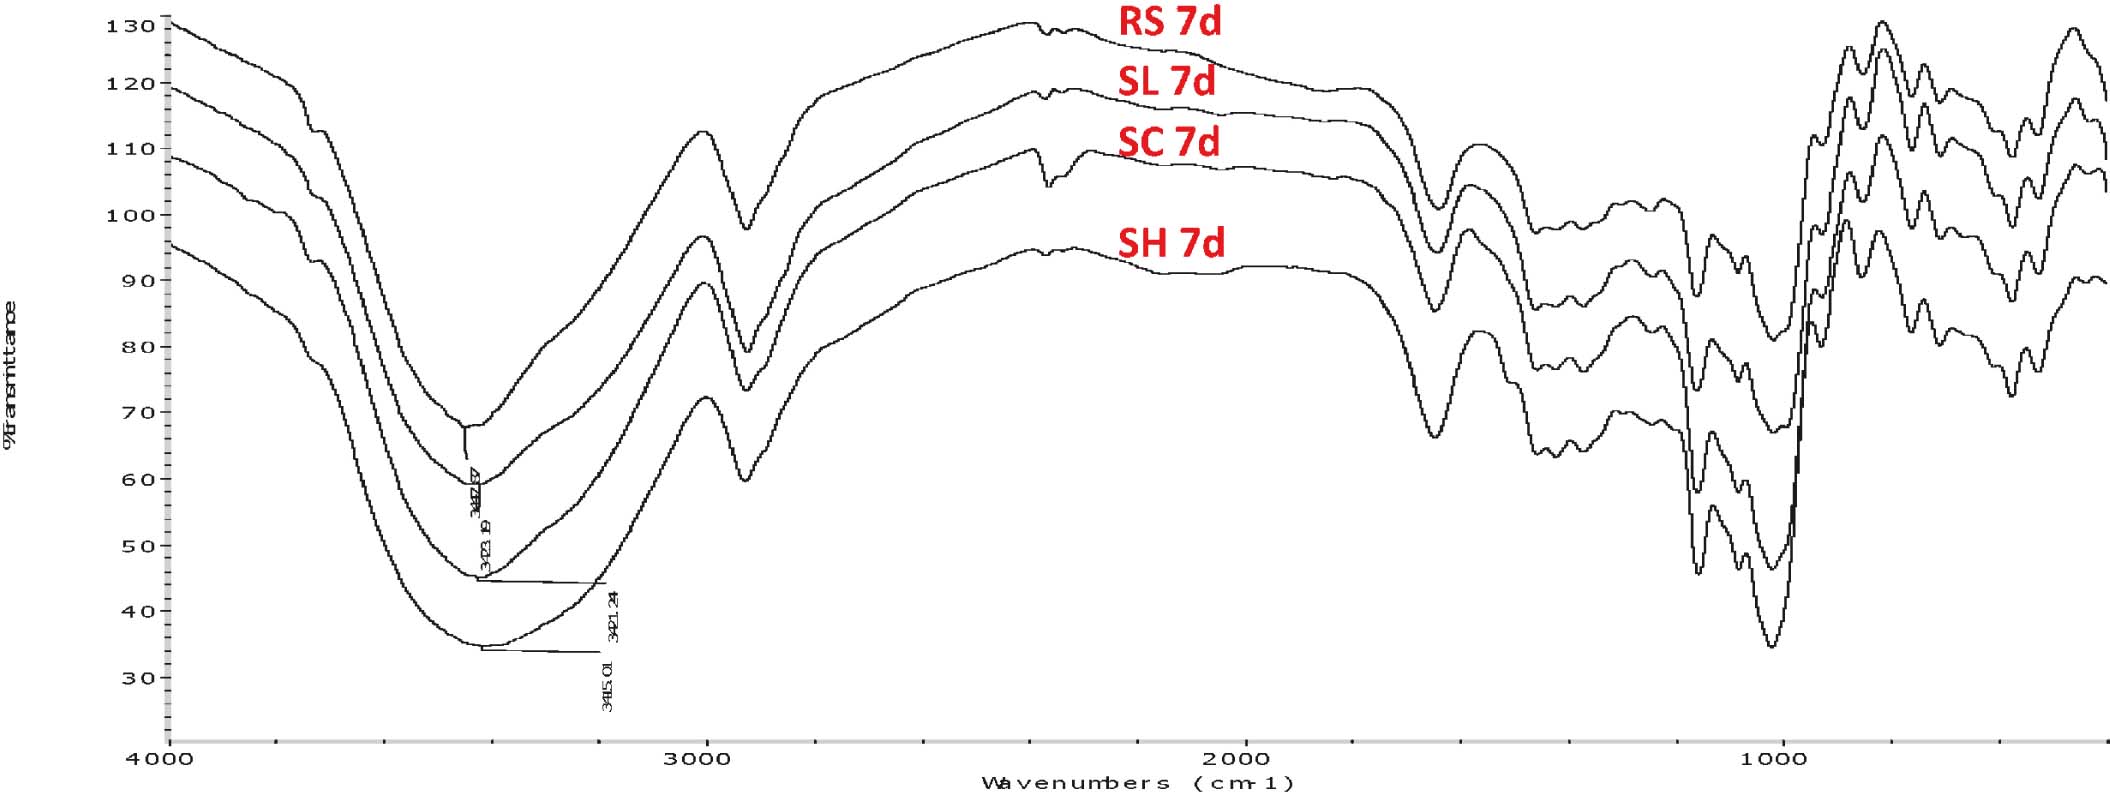
FTIR spectra of rice starch retrograded for 7 days in control, lignin, cellulose and hemicellulose (top to bottom).
SEM Samples were analyzed through SEM. In Fig. 4A, without any material being added to the rice starch, its structure was coarser and it had a discontinuous structure with a fine stripe appearance. At the same time, starch appeared to be swollen and irregular in size and shape.

SEM micrographs of rice starch retrograded for 7 days in control, lignin, hemicellulose and cellulose
However, slightly swollen starch with lignin, hemicellulose and cellulose (Fig. 4B, C and D) showed a continuous surface and compact in size and shape, similar to results from RVA. At the same time, the surface of starch was all wrapped tightly by adhering lignin, hemicellulose or cellulose. It testified that lignin, hemicellulose and cellulose were able to interact with starch which were similar with the result from FTIR (Fig.3) and also support the assumptions made in XRD and texture analysis on retrogradation of starch. Due to the association of cellulose, hemicellulose and lignin with starch, they could retard starch gel aging in the storage process. Some reports showed similar findings, konjac hydrocolloid may act as a physical barrier to prevent amylopectin chain linkages during storage. It was extremely effective at retarding ‘long-term’ retrogradation of starch (Khanna and Tester, 2006). The possible interaction between fiber and starch that would slow down starch retrogradation (Gomez et al., 2003; Moazzezi et al., 2012) .
This work clarified the retrogradation characteristics of rice starch in the presence of hemicellulose, cellulose and lignin. In the aging process, RVA measurement showed that the interaction of starch with cellulose, lignin and hemicellulose, caused the addition group having a lower and stable pasting temperature and setback. Texture profile analysis, FTIR and XRD analysis indicated that addition of cellulose, lignin or hemicellulose decreased hardness, degree of crystallinity and absorbance ratio (A1047/A1022), but it increased adhesiveness. These data changed quickly in the first 7 days while stabilizing at the remaining days. At the same time, rice starch with hemicellulose, cellulose or lignin was observed to have a lower change rate on these data compared with pure rice starch in the following decreasing order: Control > SL > SC > SH. It illustrated that they had a certain retarding effect on the retrogradation of rice starch and hemicellulose had the best effect, followed by cellulose, and lignin being the worst in these three. The microstructure analysis revealed that hemicellulose, cellulose and lignin can interact with starch, which could partially explain their antistaling effect.
Acknowledgement The authors thank Center of Analysis and Testing, Nanchang University and State Key Laboratory of Food Science and Technology for expert technical assistance. The study was supported financially by the National Natural Science Foundation of China (Nr 31271953), the “Twelfth Five-Year” National Science and Technology Pillar Program (2012BAD37B02-02), the Research Program of State Key Laboratory of Food Science and Technology, Nanchang University (SKLF-TS-200816) and the project “Gan Po ying cai 555” (18000007).