Materials and Methods
Plant materials and reagents Apple (cultivar, sanfuji) was obtained from a local market. Chlorogenic acid, (+)-catechin, and (−)-epicatechin were obtained from Sigma-Aldrich Japan (Tokyo). Procyanidin B2 was obtained from Extrasynthese (Genay, France). 1-Hydroxy-2-oxo-3-(N-methyl-3-aminopropyl)-3-methyl-1-triazene (NOC 7) (purity > 90%) was from Dojindo (Kumamoto, Japan). Griess-Romijn nitrite reagent was from Wako Pure Chemical Ind. (Osaka, Japan).
Analytical HPLC HPLC was performed using a Shim-pack VP-ODS column (15 cm Ü 4.6 mm i.d.) combined with a LC-10AS pump (Shimadzu, Kyoto, Japan). Separated components were detected using a spectrophotometric detector with a photodiode array (SPD M10Avp) (Shimadzu). The mobile phase was a mixture of methanol and 25 mM KH2PO4 (2:7, v/v), and the flow rate was 1 mL min−1.
Extraction procedures An apple was vertically divided into eight pieces. After peeling of one segment, 1.0 g of the flesh was cut from the middle part and 4.0 mL of methanol was added to the 1.0 g sample. After homogenizing with a pestle and mortar, the homogenate was centrifuged at 3,000 g for 3 min. The supernatant was referred to as apple extract.
Reactions of polyphenols with nitrite Apple extract (0.1 mL) was added to 0.9 mL of 50 mM KCl-HCl (pH 2.0). The acidic solution was incubated for 10 min at about 25°C after addition of 0, 2, 5, or 10 µL of 100 mM sodium nitrite, and then an aliquot (0.1 mL) of the incubated reaction mixture was applied to the above HPLC column. Chlorogenic acid was quantified at 320 nm, and (+)-catechin, procyanidin B2, and (−)-epicatechin were quantified at 210 nm from the area under the peak.
When required, reactions of polyphenols with nitrite were studied in acidified saliva. Saliva (about 10 mL) was collected from two volunteers at about 10 a.m. by chewing parafilm after their informed consent had been obtained. Each collected saliva sample was centrifuged at 20,000 g for 5 min, and the supernatant was used for experiments. The pH of a saliva supernatant sample was decreased to 2.0 by adding 10 – 20 µL of 2 M HCl, then immediately 0.1 mL of apple extract was added to 0.9 mL of the acidified saliva, and the mixture was incubated for 20 min at about 25 . One mL of methanol was added to the incubated mixture, then the mixture was passed through a membrane filter (DISMIC-13HP, 0.45 µm pore size; Toyo Roshi Kaisha, Ltd., Tokyo, Japan). An aliquot of the filtrate (0.1 mL) was applied to the HPLC column to quantify chlorogenic acid, procyanidin B2, and (−)-epicatechin as described above.
The salivary concentration of nitrite was determined using Griess-Romijn reagent (Takahama et al., 2002b). The concentration was dependent on each saliva preparation, with the minimal and maximal concentrations being 0.05 and 0.9 mM, respectively. Its typical concentration was 0.2 – 0.4 mM in this study.
Spectrophotometric studies Spectrophotometric studies were performed with a spectrophotometer (UV-2450; Shimadzu) equipped with an integrating sphere (ISR-240A: Shimadzu). The light path of the measuring beam was 4 mm. The reaction mixture (1.0 mL) contained 0.1 mM chlorogenic acid, procyanidin B2, or (−)-epicatechin in 50 mM KCl-HCl (pH 2.0). Reactions were initiated by adding 2 µL of 100 mM sodium nitrite. Nitrite-induced changes in the absorption spectra were recorded by repeat scanning from 800 to 240 nm at 1.0 min intervals. The scanning was repeated ten times. Immediately after the tenth scan, 0.1 mL of the reaction mixture was analyzed on the HPLC system to determine the reaction products.
NO production NO production in the nitrite/polyphenol systems was studied at 30°C using a Clark-type electrode with a polarization voltage of −0.7 V under an argon atmosphere (Takahama and Hirota, 2012; Volk et al., 2009; Zimmer et al., 1985). The reaction mixture (2.0 mL) contained 50 µM chlorogenic acid, procyanidin B2, or (−)-epicatechin in 50 mM KCl-HCl (pH 2.0). Reactions were initiated by adding 10 µL of 100 mM sodium nitrite after removing air from the reaction mixture by bubbling argon gas. The amount of chlorogenic acid, procyanidin B2, or (−)-epicatechin oxidized during the NO production reaction was estimated using the above HPLC system. Nitrite-induced changes in absorption spectra during NO production were studied under anaerobic conditions using the spectrophotometer.
Nitric oxide production was also studied using apple extract. Because methanol affected the measurement of NO concentration, methanol in the apple extract was removed with a rotary evaporator; from 1 mL of apple extract, 0.16 mL of concentrated extract was obtained. The reaction mixture contained 33 µL of the concentrated extract and 0.5 mM sodium nitrite in 2 mL of 50 mM KCl-HCl (pH 2.0) or a mixture of 1 mL of 50 mM KCl-HCl (pH 1.5) and 1 mL of saliva (final pH, 1.9 – 2.1). Reactions were initiated by adding nitrite or the concentrated extract after removing air from the reaction mixture by bubbling argon gas.
The amounts of NO produced in the above systems were calculated by measuring NO production in ascorbic acid/nitrite systems. In the ascorbic acid/nitrite system, one molecule of ascorbic acid produces two molecules of NO by the following reaction if the concentration of nitrite is more than two times that of ascorbic acid (Licht et al., 1988; Takahama and Hirota, 2012),
The amount of NO produced by the addition of 50 µM ascorbic acid in the presence of 500 µM nitrous acid was essentially the same as that of NO produced by 50 µM NOC 7, one molecule of which produces two molecules of NO (Dojindo catalogue), indicating the usefulness of an ascorbic acid/nitrite system to calibrate the amounts of NO produced.
Presentation of data Each experiment was repeated at least twice. Typical data or means with SDs are presented.
Results and Discussion
Polyphenols in apple Figure 2 (top) shows a typical HPLC profile of apple extract. The retention times of peaks 1, 2, 3, and 4 were identical with those of standard chlorogenic acid, (+)-catechin, procyanidin B2, and (−)-epicatechin, respectively. In addition, the absorption spectra of peaks 1, 2, 3, and 4 were identical with those of standard chlorogenic acid, (+)-catechin, procyanidin B2, and (−)-epicatechin, respectively (Fig. 2, middle). From these data, the components of peaks 1, 2, 3, and 4 were identified to be chlorogenic acid, (+)-catechin, procyanidin B2, and (−)-epicatechin, respectively. The presence of these polyphenols in apple fruits has been reported previously (Lu and Foo, 2000; Wegrzyn et al., 2008; Yanagida et al., 1999). Their amount per g of fresh weight followed the order (+)-catechin < procyanidin B2 < (−)-epicatechin < chlorogenic acid (Fig. 2, bottom).

Reaction of polyphenols with nitrous acid Figure 3 shows nitrite-induced changes in the concentrations of chlorogenic acid, procyanidin B2, and (−)-epicatechin contained in apple extract in 50 mM KCl-HCl (pH 2.0). Nitrous acid decreased the concentrations of procyanidin B2 and (−)-epicatechin, but a decrease in the concentration of chlorogenic acid was not clearly evident when the nitrite concentration was low. One of the reasons for the lack of clarity in the decrease of chlorogenic acid was the formation of brown oxidation products, which eluted with a similar retention time as chlorogenic acid. The formation of brown components, which absorbed light shorter than 420 nm (with a peak around 350 nm), was confirmed spectrophotometrically when 0.1 mL of apple extract was reacted with 1.0 mM nitrite in 0.9 mL of 50 mM KCl-HCl (pH 2.0). The changes in the concentration of (+)-catechin were unclear because of its low concentration (data not shown).

Table 1 shows nitrite-induced decreases in the concentrations of chlorogenic acid, procyanidin B2, and (−)-epicatechin in 50 mM KCl-HCl (pH 2.0). The rate of the decrease was in the order chlorogenic acid < (−)-epicatechin < procyanidin B2, as in Fig. 3. Thus, the difference in the consumption of polyphenols shown in Fig. 3 could be explained by the difference in the reaction rates of nitrous acid with chlorogenic acid, procyanidin B2, and (−)-epicatechin. The rate constants of these reactions with nitrous acid were calculated (Table 1). The values indicate that the rate constant for chlorogenic acid is comparable to the rate constant of the reaction between rutin and nitrous acid [(1.51 ± 0.20) × 102 M−1 min−1] (Takahama and Hirota, 2012). The rate constant of the reaction between quercetin and nitrous acid was (15.0 ± 3.6) × 102 M−1 min−1 (unpublished data). The data indicate that procyanidin B2 can react with nitrous acid as rapidly as quercetin. The higher reactivity of procyanidin B2 compared to (−)-epicatechin with nitrous acid coincides with reports that the antioxidative activities of catechin dimers and polymers are greater than those of catechin monomers (Ariga et al., 1988; Kurihashi et al., 2003).
Table 1.
Nitrite-induced consumption of polyphenol reagents.
|
Concentrations of polyphenols after incubation (µM) |
Rate constant (M−1 min−1) |
|
2 min |
5 min |
|
| CGA |
42.0 ± 1.4 |
25.0 ± 1.6 |
(1.60 ± 0.28) × 102 |
| Pro B2 |
5.2 ± 0.7 |
− |
> (8.96 ± 0.14) × 102 |
| Epicat |
20.9 ± 0.8 |
6.4 ± 1.6 |
(5.82 ± 0.16) × 102 |
Reaction mixture contained 50 µM the respective polyphenol in 1 mL of 50 mM KCl-HCl (pH 2.0). Reactions were initiated by addition of 5 µL of 100 mM sodium nitrite. −, below detection limit. Rate constants were calculated from the decrease in concentration during 2 min incubation, postulating that the reactions proceeded as Eq. 1. CGA, chlorogenic acid; Pro B2, procyanidin B2; Epicat, (−)-epicatechin. Each result represents the mean with SD (n = 3 − 4).
When acidified saliva (pH 2.0), the nitrite concentration of which was adjusted to 0.4 mM by adding several µL of 100 mM sodium nitrite, was incubated with apple extract for 20 min, the concentrations of chlorogenic acid and (−)-epicatechin decreased to 87 ± 8% (n = 3) and 64 ± 14% (n = 3), respectively, of the original values, which were determined immediately after preparation of the mixture of acidified saliva and apple extract. Almost all the procyanidin B2 was consumed during 20 min incubation. Since the concentration of nitrite in saliva ranges from 0.05 to 1 mM (Ferguson, 1989), the above results suggest that the rate of consumption of apple polyphenols in the stomach is dependent on their reactivity with nitrous acid.
Reaction products of procyanidin B2 and (−)-epicatechin Figure 4 (top, I) shows the HPLC profile of the reaction mixture, which contained apple extract in 50 mM KCl-HCl (pH 2.0), at 320 nm. Chlorogenic acid (retention time, about 4.5 min) and an unknown component (retention time, about 10 min) were detected as peaks. Procyanidin B2 and (−)-epicatechin, which were detected at 280 nm, were eluted at the times indicated by white downward arrows. The concentrations of chlorogenic acid, procyanidin B2, and (−)-epicatechin in the reaction mixture were calculated to be 8.0, 2.4, and 3.6 µM, respectively, from the data in Fig. 2. The above mixture was incubated for 10 min after addition of 1 mM nitrite, and then HPLC was performed (top, II). In addition to the peaks due to chlorogenic acid and the unknown compound, small peaks A and B were detected with retention times of 3.9 and 10.1 min. The peak heights increased during incubation for 20 min. Nitrite was detected at a retention time of 6.1 min. The components of peaks A and B had absorption maxima at 274 and 331 nm and 280 and 320 nm, respectively, in the mobile phase (Fig. 4, bottom). Because the formation of peaks A and B accompanied the consumption of procyanidin B2 and (−)-epicatechin as shown Fig. 3, and because the components had absorption peaks around 280 nm and 330 nm, we postulated that peaks A and B were nitroso compounds of catechins. The formation of nitroso catechins in catechin/nitrite systems under acidic conditions has been reported (Lee et al., 2006; Panzella et al., 2005).

When acidified saliva (0.9 mL), which contained 0.4 or 0.9 mM nitrite, was incubated with 0.1 mL of apple extract for 1 or 20 min, components corresponding to peaks A and B were formed but their amount was too small to be separated clearly from chlorogenic acid and the unknown component. This was due to the presence of salivary components in the filtrate, which absorbed UV light. Next, 50 or 100 µM procyanidin B2 and (−)-epicatechin were added to the acidified saliva in addition to apple extract, and the acidified saliva was incubated for 5 − 10 min. The formation of components corresponding to peaks A and B was confirmed by HPLC using the mobile phase in Fig. 4. When a mixture of methanol and 0.2% formic acid (1:4, v/v) was used as the mobile phase, a component of peak A (retention time, 4.6 min) was separated completely from chlorogenic acid (retention time, 10.4 min).
Since nitrite seemed to react with procyanidin B2 and (−)-epicatechin producing their nitroso compounds in acidified saliva as well as in an acidic buffer solution, the reactions of nitrite with the above polyphenols were studied further under acidic conditions. Figure 5 shows nitrite-induced changes in the absorption spectra of procyanidin B2 and (−)-epicatechin. Nitrite increased the absorbance at wavelengths shorter than 500 nm as a function of incubation time. The absorbance increases indicated faster reaction of nitrite with procyanidin B2 than with (−)-epicatechin. The insets show that the reaction products of procyanidin B2 and (−)-epicatechin were not affected significantly by the incubation period, and that the reaction products had absorption peaks around 320 nm.

After the incubation of procyanidin B2 and (−)-epicatechin for 10 min under the conditions of Fig. 5, the reaction mixtures were analyzed by HPLC (Fig. 6, top). Components of peaks A and B with retention times of 3.9 and 10.0 were generated from procyanidin B2 and (−)-epicatechin, respectively, and the components had absorption peaks at 274 and 328 nm and 280 and 324 nm, respectively (Fig 6, bottom). During the incubation, most of the procyanidin B2 and about 80% of the (−)-epicatechin was consumed.
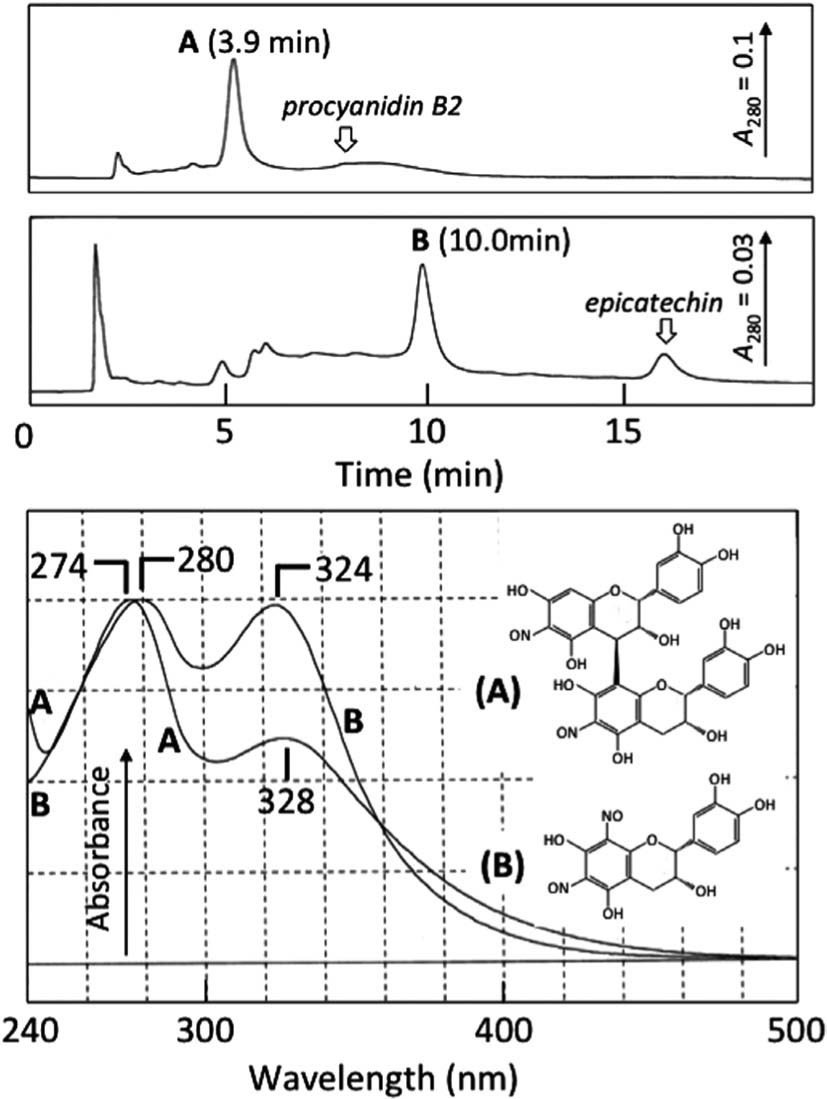
The retention times and absorption spectra of peaks A and B in Fig. 6 coincided with those of peaks A and B in Fig. 4, respectively. This result suggests that the components giving rise to peak A in Fig. 4 was produced from procyanidin B2 and that the component giving rise to peak B was from (−)-epicatechin in apple extract. It has been reported that major reaction products formed by the reaction of nitrous acid with procyanidin B2 and (−)-epicatechin are dinitrosoprocyanidin B2 and 6,8-dinitrosoepicatechin, respectively (Lee et al., 2006). Thus, we concluded that the component of peak A was nitroso procyanidin B2 and that the component of peak B was 6,8-dinitrosoepicatechin. It has been reported that 6,8-dinitrosoepicatechin (M W = 348) isomerizes to 6,8-dinitrosocatechin. Dinitrosocatechin generated in the (+)-catechin/nitrous acid system was isolated. Two components corresponding to dinitrosocatechin and dinitrosoepicatechin were found in the isolate by HPLC. Liquid chromatography-mass spectra of the two compounds showed a molecular ion at m/z 347 ([M − H]−), supporting that a mutual alternation was possible for these two isomers, and that the component produced from (−)-epicatechin was dinitrosoepicatechin (unpublished data).
Mechanism of nitroso compound formation Figure 7 (left) shows time-courses of NO production in ascorbic acid/nitrite and polyphenol/nitrite systems in acidic buffer solution (pH 2.0). The slow NO production induced by nitrite is due to self-decomposition of nitrous acid (McKnight, 1997),
Ascorbic acid enhanced the NO production by Eq. 2, and the amount of NO produced by 50 µM ascorbic acid was corresponded to 100 µM NO (see Materials and Methods).
Chlorogenic acid, procyanidin B2, and (−)-epicatechin also enhanced the production of NO (Fig. 7 left). The rate of NO production by chlorogenic acid decreased during incubation, and the oxidation of chlorogenic acid also slowed during incubation (Fig. 7 right, top). Therefore, the decrease in the rate of NO production was likely due to the slowing of the reaction between chlorogenic acid and nitrous acid. NO production in the presence of procyanidin B2 decreased to nearly zero during incubation. This decrease might be due to rapid consumption of procyanidin B2 (Fig. 7 right, middle). A gradual decrease in the NO production in the presence of (−)-epicatechin accompanied the gradual decrease in (−)-epicatechin oxidation (Fig. 7 left, bottom). The above data indicate that NO production is related to the rate of reaction between polyphenols and nitrous acid.
Figure 8 shows the relation between NO production and consumption of ascorbic acid or polyphenols by ascorbic acid/nitrous acid or polyphenol/nitrous acid systems, respectively. In the presence of ascorbic acid, all ascorbic acid was oxidized and the amount of NO produced was twice the amount of ascorbic acid oxidized (Eq. 2). In the presence of chlorogenic acid, the amount of NO produced accompanying chlorogenic acid oxidation was also about twice that of chlorogenic acid oxidized. This result suggests that chlorogenic acid radicals, which were produced by Eq. 1 (Peri et al., 2005), could be transformed to chlorogenic acid and the corresponding quinone by disproportionation, just as monodehydroascorbic acid radicals were transformed to ascorbic acid and dehydroascorbic acid by disproportionation. Ascorbic acid (2 mM), which was added to the reaction mixture after the tenth scan in Fig. 7 (right, top), decreased the absorbance at 400 nm by about 65%, and increased the absorbance at 322 nm to the absorbance observed before the addition of nitrite. This result indicates that the quinone is a major product in nitrous acid/chlorogenic acid systems. The formation of chlorogenic acid quinone has been reported in nitrite/chlorogenic acid systems at pH 2.0 (Peri et al., 2005; Takahama et al., 2007, 2008). The slower oxidation of chlorogenic acid in Fig. 8 (about 13 µM/5 min) than shown in Table 1 (about 25 µM/5 min) indicates that molecular oxygen can contribute to the nitrous acid-induced oxidation of chlorogenic acid.

The amounts of NO produced in procyanidin B2/nitrous acid and (−)-epicatechin/nitrous acid systems were approximately 50 and 100% of the amounts of procyanidin B2 and (−)-epicatechin consumed, respectively. If NO production was due to Eq. 1, the smaller NO production in procyanidin B2/nitrous acid and (−)-epicatechin/nitrous acid systems might be explained by taking the following reactions:
In these reactions, HOPhOH is procyanidin B2 or (−)-epicatechin, and HOPhO° is their radicals. The generation of radicals of procyanidin B2 and (−)-epicatechin during their reaction with nitrous acid is supported by the formation of (+)-catechin radicals in (+)-catechin/nitrite systems under acidic conditions (Peri et al., 2005). Eq. 7 consumes NO and produces mono-nitroso compounds (HOPhO-NO). Radicals produced by the oxidation of HOPhO-NO (°OPhO-NO in Eq. 8) will react with NO to produce dinitroso compounds (ON-OPhO-NO) (Eq. 9). The formation of mononitroso and dinitroso catechins in catechin/nitrous acid systems has been reported (Lee et al., 2006). Taking the above reactions into consideration, we can deduce that lower efficiency of NO production in the procyanidin B2/nitrite system compared to the (−)-epicatechin/nitrite system was due to faster reaction of NO with radicals derived from procyanidin B2 than radicals derived from (−)-epicatechin (Eq. 7 and 9). Ascorbic acid (2 mM), which was added to the reaction mixtures after the tenth scan in the presence of procyanidin B2 or (−)-epicatechin in Fig. 7 (right, middle and bottom), decreased the absorbance at 400 nm by 10−15%. The absorbance around 320 nm was decreased by about 10% and increased by about 5% in the presence of procyanidin B2 and (−)-epicatechin, respectively, by 2 mM ascorbic acid, suggesting that little amounts of quinones or quinone-like compounds were formed, even if the chemical species were formed.
NO production by apple extract Figure 9 shows NO production by apple extract/nitrous acid systems. The slow NO production induced by 0.5 mM nitrite in acidic buffer solution was enhanced by apple extract as reported previously (Peri et al., 2005). The amount of NO produced during 6 min incubation was calculated to be about 50 µM.

When 50 µM ascorbic acid was added to acidified saliva (pH 2.0), NO was produced and the rate was much faster than that in acidic buffer solution (compare traces 1 and 3). The faster NO production was due to the presence of thiocyanate in saliva, which reacted with nitrous acid to produce ONSCN (Licht et al., 1988). It is known that the concentration of thiocyanate in saliva ranges from 0.01 to 3 mM (Tsuge et al., 2000) and that ascorbic acid reacts with ONSCN much faster than with nitrous acid (Licht et al., 1988; Takahama et al., 2003). NO produced by addition of apple extract was calculated to be about 45 µM. There were no significant differences in NO production between traces 2 and 4, indicating that thiocyanate did not affect nitrite-induced NO production significantly. It has been reported that nitrous acid-dependent oxidation of polyphenols is little affected by thiocyanate (Peri et al., 2005; Takahama et al., 2003).
The sum of the concentrations of chlorogenic acid, procyanidin B2, and (−)-epicatechin in the above reaction mixtures was calculated to be about 14 µM from Fig. 2 (see above). This concentration of polyphenols can produce a maximum of 28 µM NO if these polyphenols reacted with a nitrous acid as chlorogenic acid did. The calculated value was smaller than the NO production induced by concentrated apple extract (about 50 µM), suggesting that components other than the above polyphenols contribute to NO production. These may be (−)-epigallocatechin, (−)-epigallocatechin 3-gallate, and quercetin glycosides (Bhagwat et al., 2011).
Concluding remarks The above results suggest that polyphenols in apple can react with salivary nitrite in the gastric lumen, producing NO and nitroso compounds of procyanidin B2 and (−)-epicatechin. The functions of NO generated in the stomach have been summarized (Lundberg, 2012) and include protection from gastritis and mucosal injury, stimulation of mucosal blood flow and mucus formation, mucosal defense, and antimicrobial activity. Nitroso compounds are reported to induce toxic effects in Caco-2 cells, which are cultured colon carcinoma cells (Lee et al., 2006). It has also been reported by Lee et al. (2006) that nitrous acid-induced N-nitrosodimethylamine formation from dimethylamine is inhibited by procyanidin B2 and (−)-epicatechin, with 50% inhibition observed at about 50 and 140 µM for procyanidin B2 and (−)-epicatechin, respectively. The different effects may be explained by the difference in reactivity between procyanidin B2 and (−)-epicatechin with nitrous acid (Table 1), if nitrosonium cation (NO+) generated from nitrous acid contributes to the nitrosoamine formation (ii, iii). Chlorogenic acid can also inhibit nitrosation of 2,3-diaminonaphthalene, with 50% inhibition observed at about 500 µM (Kono et al., 1995). Although the experimental conditions are different between the two reports, the reports suggest that the inhibition of N-nitrosoamine formation by polyphenols depends on their antioxidative activity, and that catechins appear to be useful for inhibiting N-nitrosoamine formation in the stomach.
The result of the present study also suggests that a significant amount of chlorogenic acid could be transported to the intestine when apple is ingested, because the polyphenol may react with salivary nitrite slowly in the gastric lumen. Chlorogenic acid itself and caffeic acid produced by its hydrolysis can be absorbed into the human body (Olthof et al., 2001; Plumb et al., 1999). On the other hand, some of the ingested (−)-epicatechin would also be transported to the intestine. (−)-Epicatechin can cross the jejunum of the small intestine (Lee et al., 2006). It has been reported that quercetin, which can rapidly react with nitrous acid (Takahama et al., 2002a), is not detected in plasma when quercetin is orally administrated (Hollman & Katan, 1998). The reports suggest that procyanidin B2 in apple appears not to be absorbed into the human body, because the compound can readily react with nitrite in the gastric lumen as quercetin. The above discussions suggest that the absorption of polyphenols into the human body can be affected by their reactions with nitrous acid in the gastric lumen as well as by their intestinal absorption.
Acknowledgements Part of this study was supported by Grants-in-Aid for Scientific Research (22500790 and 23500986) from the Ministry of Education and Science in Japan. The authors thank Professor R. Yamauchi (Gifu University) for measuring the mass spectra of dinitrosocatechin.


