Original papers
Comparison of Phenolic Compounds and Taste of Chinese Black Tea
2014 年 20 巻 3 号 p. 639-646
詳細
2014 年 20 巻 3 号 p. 639-646
Theaflavins (TF), thearubigins (TR) and theabrownins (TB) are the major polyphenols that determine the quality of black tea. These compounds were measured in black teas and their correlation with taste values and taste quality was investigated. TF, TR and TB in the black teas from Chinese markets averaged 0.24%, 4.07% and 7.59%, respectively. Correlation analysis showed that TF was positively and significantly correlated with astringency (r = 0.521, p < 0.05), aftertaste of astringency (r = 0.619, p < 0.01) and richness (r = 0.618, p < 0.01). TR was also positively correlated aftertaste of astringency (r = 0.530, p < 0.05), while TB was negatively correlated with bitterness (r = -0.486, p < 0.05). Taste score had a positive correlation with TF (r = 0.691, p < 0.01) and TR (r = 0.604, p < 0.05). Meanwhile, taste score correlated positively with astringency (r = 0.483, p < 0.05) and aftertaste of astringency (r = 0.518, p < 0.05). The result showed that black teas can be partially classified by cluster analysis using PCA components.
Teas are usually classified as black tea, green tea, Oolong tea, yellow tea, white tea and dark compressed tea in China. Black tea is the most important one consumed across the world & its production accounted for about 75% of global tea production, with China as both the major producer as well as larger consumer. In 2012 the total output of Chinese black teas was over 100 thousand tons. Black tea is mainly divided into Xiaozhong Black tea, Congou, broken black tea (orthodox and CTC). Xiaozhong Black tea was the first black tea to be invented in the mid 17th century in Chongan country, Fujian province of China (Zhen, 2004). It has unique aroma taste of pine tree smoke, because the leaves were fumigated by the pine tree smoke. Xiaozhong Black tea was made in the Congou manner but coarser leaf. The processing step of Congou black tea was as follows. Fresh leaves are spread 15 20 cm deep and withered indoors at the temperature of 20 – 25°C. The leaves are turned over every 2 hrs and this process lasts for 12 hrs. The average moisture content of withered leaves is about 60%.
Then the leaves are rolled either by hand or by rolling machine. Fermentation is carried out at 20 – 30°C at the humidity over 90% for about 2 5 hrs according seasons. After fermentation, leaves are subjected to drying at 110 – 120°C for 10 – 15 min. After spreading the first drying leaves, another drying is carried out 60 – 90°C for 45 – 60 min. The processing of broken black tea is similar to Congou black tea. It needing the five stages: withering, maceration (leaf disruption), fermentation, drying and sorting. Withering is important for aroma development. The withered leaves are rolled and crushed, initiating fermentation of the tea polyphenols. The fermenting mass formed from rolling and used in black tea manufacture is referred to as dhool. The process used to macerate the leaf plays an important role in the final grade of tea. Two common methods are Orthodox and CTC. Orthodox rolling of the leaf is performed by mechanically applying weight or compression to the leaves. Orthodox processing is typically used for production of large-leaf finished tea products. CTC (crush, tear, curl) processing is a significant modern improvement of this procedure that minces the leaf in a continuous, high-yielding process and produces smaller-leaf teas (Harbowy & Balentine, 1997).
A cup of good quality black tea infusion is characterized by the bright reddish brown color, brisk, strong taste and rich flavour. A delicious cup of tea infusion is an ingenious balance of various taste sensations. Astringency in black tea is divided into two types: tangy and non-tangy (Sanderson et al., 1976). The tangy astringency which is tasteless, mouth-drying and mouth-coating, with a lingering (more than 60 seconds) after taste effect. The tangy astringency of black tea infusion is possibly related to the bitterness (Millin et al., 1969). It was noted that the compounds with a galloyl group, TF and caffeine are closely related to the tangy astringency (Sanderson et al., 1976). So, the caffeine together with the black tea polyphenols was necessary for the expression of reasonable amounts of tangy astringency. However, the caffeine does not contribute to the non-tangy astringency. Decaffeination may change the nature of astringency in black tea infusion from the tangy type to non-tangy type (Sanderson et al., 1976).
Experiments have demonstrated the relationship between individual polyphenolic compounds and the taste of black tea infusion. The gallated tea flavonols are related to the astringent and also to the bitterness taste; the non-gallated tea flavonols are related to the bitterness, however, are not related or only slightly related to the astringent taste of tea infusion. Among the theaflavins, theaflavin is less astringent. The contribution of TF-digallate and TF-monogallate to astringent is 6.4 and 2.2 times higher than that of theaflavin (Zhen, 2004). Sensory analysis revealed that theaflavins taste bitter and astringent with threshold concentrations of 300 – 1000 mg/L for bitterness and 125 – 800 mg/L for astringency (Sanderson et al., 1976). Theaflavins in solution are normally very astringent, but in tea the astringent is reduced due to an interaction with bitter caffeine. A recent study demonstrated that theaflavins contributed to less than 0.02% of the tea astringency, making their contribution to the overall taste less significant (Scharbert et al., 2004b). Thearubigins are also closely related to the taste of black tea. The TR1 contributes significantly to the dull colour of infusion and is negatively related to the briskness, while TR3 is positively related to briskness (Zhen, 2004).
Electronic tongue has been attempted to classify different tea categories. Seven varieties of Longjing tea were analyzed by the electronic tongue were successfully discriminated at different frequency segments (Tian et al., 2007). The application of electronic tongue technology to identify the tea grade level by different pattern recognition methods and different identification models was reported (Chen et al., 2008). The electronic tongue can be used to predict sensory characteristics and their relationship to the taste quality of tea measured by professional taster (He et al., 2009). A novel impedance-Tongue based on multi-electrode Electrochemical Impedance Spectroscopy is proposed for discrimination of Indian black tea (Bhondekar et al., 2010). A voltammetric electronic tongue with five working electrodes of noble metals in a three electrode setup has been employed to estimate the amount of theafla- vins and thearubigins (Ghosh et al., 2012). These studies mentioned above show that the electronic tongue can be performed for tea classification, but few of them discuss the relationship between chemical components with electronic tongue measurements and taste quality. The purpose of the present study was to explore the relationship of theaflavins, thearubigins and theabrownins with taste values and taste quality.
Tea samples and reagents Seventeen black teas with one bud and two or three leaves were collected from the major estates across China (Table 2). The taste-sensing system required special reference and washing solutions, which are similar to human saliva. The reference solution is 0.3 mM tartaric acid in 30 mM potassium chloride. The washing solution is 100 mM hydrochloric acid in 30% ethanol aqueous solution for the negatively charged artificial lipid membrane sensor probe, an aqueous solution of 100 mM potassium chloride and 10 mM potassium in 30% ethanol was used for the positive one. All the reagents above and others are analytically pure and purchased from Sigma Aldrich, USA & Changsha Chemical Company (Changsha, China). The internal solution for the lipid membrane sensor (3.3 M potassium chloride in saturated silver chloride solution) was provided by Intelligent Sensor Technology, Inc. (Atsugi-shi, Japan).
| Samples | TF (%) | TR (%) | TB (%) | TF/TR | Taste score | Information | Estate |
|---|---|---|---|---|---|---|---|
| 1 | 0.12 | 2.63 | 5.96 | 0.05 | 86.2 | Lapsang souchong | Fujian |
| 2 | 0.22 | 3.99 | 6.48 | 0.05 | 87.8 | Tanyang Congou | Fujian |
| 3 | 0.31 | 4.85 | 8.41 | 0.06 | 85.0 | Zhenghe Congou | Fujian |
| 4 | 0.29 | 4.09 | 7.52 | 0.07 | 88.2 | Bailin Congou | Fujian |
| 5 | 0.29 | 2.93 | 8.27 | 0.10 | 86.8 | Jin Junmei | Fujian |
| 6 | 0.22 | 2.87 | 6.65 | 0.08 | 77.8 | Keemun | Anhui |
| 7 | 0.20 | 4.88 | 10.51 | 0.04 | 84.3 | Dian Hong | Yunnan |
| 8 | 0.26 | 4.08 | 8.67 | 0.06 | 85.5 | Yihong Congou | Hubei |
| 9 | 0.21 | 3.92 | 8.09 | 0.05 | 84.3 | Chuanghong Congou | Sichuang |
| 10 | 0.28 | 4.50 | 6.27 | 0.06 | 87.2 | Taiwan Black tea | Taiwan |
| 11 | 0.33 | 5.95 | 7.65 | 0.06 | 90.0 | Hainan Congou | Hainan |
| 12 | 0.13 | 3.18 | 6.48 | 0.04 | 75.0 | Suhong Congou | Jiangsu |
| 13 | 0.22 | 3.92 | 6.38 | 0.06 | 81.7 | Jiu Qu Hong Mei | Zhejiang |
| 14 | 0.38 | 5.18 | 6.84 | 0.07 | 92.0 | Guihong Congou | Guangxi |
| 15 | 0.28 | 5.31 | 7.66 | 0.05 | 86.2 | Xianghong Congou | Hunan |
| 16 | 0.23 | 4.21 | 7.41 | 0.05 | 84.8 | Ninghong Congou | Jiangxi |
| 17 | 0.19 | 2.65 | 9.79 | 0.07 | 79.8 | Ying De Hong | Guangdong |
Sensory evaluation Three grammes of tea sample were infused with 150 mL freshly boiled water for 5 min. Perceived quality score was blindly assessed according to a standardized procedure by a tea-tasting panel consisted of six professional panelists (Liang et al., 2007; Wang & Ruan, 2009). Procedure of sensory evaluation is given as follows (Hui et al., 2004; Wang and Ruan, 2009). The grading system was based on taste score of 100.
Measurement of TF,TR and TBTF, TR and TB were measured using spectrophotometric method (Yao et al., 2006). This method is began with extraction of brewed tea liquor from 3gm of tea leaves stirred in 125 mL hot water at 90°C for 10 min, filtered and cooled to room temperature. The extracted brewed liquor is divided into four parts to measure absorbance values such as Ea, Eb, Ec and Ed by following process. 30 mL of the brewed tea liquor was mixed with 30 mL of ethyl acetate in a separating funnel. The mixture was shaken for 5 min. Part of the ethyl acetate layer (2 mL) was diluted to 25 mL with 95% (v/v) ethanol. The absorbance of this solution was measured using spectrophotometer and saved as Ea. 15 mL of the brewed tea liquor was mixed with 15 mL of n-butanol and shaken for 3 min in a separating funnel. 2 mL of this aqueous layer was mixed with 2 mL of saturated oxalic acid and 6 mL of distilled water and then diluted to 25 mL with 95% (v/v) ethanol. The absorbance of this solution is saved as Eb. Another 15 mL of ethyl acetate layer was mixed with15 mL of 2.5%(w/v) NaHCO 3 and shaken for 30 s. 4 mL of upper ethyl acetate layer was extracted and diluted with 21 mL of 95% (v/v) ethanol solution. The absorption of this ethanol solution was recorded as Ec. Again 2 mL of aqueous layer of Ea was mixed with 2 mL of saturated oxalic acid and 6 mL of water, and then diluted to 25 mL with 95% (v/v) ethanol. The absorbance of this solution was measured to obtain Ed. The absorbance of the above solutions was measured with a UV/Vis spectrophotometer (Shimadzu UV 2550, Kyoto, Japan) at 380 nm, with 95% (v/v) of ethanol as a blank. Measurement of TF, TR and TB was obtained through three formulae as following:
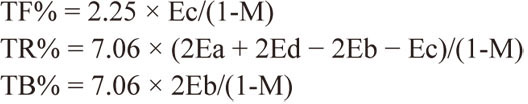 | Eq. 1 |
Where Ea, Eb, Ec and Ed are the absorbance values and M is the moisture content of tea sample. Tea moisture was measured using a vacuum oven based on an international standard method (ISO 1573, 1980). All above analyses were duplicated for each sample.
Electronic tongue measurements The infusion was prepared from three grams of leaf tea in 150 mL of freshly boiled water for 5 min. After tea infusion was filtered using filter paper and cooled to room temperature, the infusion was measured with electronic tongue. Each tea sample was measured using three replications. The taste of black tea was determined using the taste-sensing system TS-5000Z (Atsugi-shi, Japan), a type of intelligent sensor technology, which almost mimics the human gustatory system (Cui et al, 2013). When the sensor unit was dipped in the samples and reference solution, the electronic potential in the samples (Vs) and potential in the reference solution (Vr) were recorded, which was regarded as the zero point. After sample solution measurement, the sensor unit was rinsed briefly in the reference solution; then, the potential (Vr') was recorded when the reference solution was measured again. The difference (Vs — Vr) between the sample potential (Vs) and the reference potential (Vr) was the relative potential and used as the initial taste. The change in potential between before and after the reference solution (Vr' – Vr) was regarded as the aftertaste, which was regarded as the adsorption value. The sensor unit is used to evaluate two types of taste: initial taste (sourness, saltiness, bitterness, astringency, and umami) and aftertaste (bitter aftertaste, astringent aftertaste and richness), which represent the taste of food in the mouth and after swallowing the food or beverage, respectively (Toko, 1998; Kobayashi et al, 2010) (Table 1). Aftertaste is the stimulus insensity peeceived in the moments immediately following removal of the stimulus (to differentiate with adaptation, in which the stimulus is constantly present) (Neely and Borg, 1999). Aftertaste of astringency is the astringent aftertaste remained in mouth after the expectoration (Yau and Huang, 2000). Aftertaste of bitterness is the bitter aftertaste remained in mouth after the expectoration. Richness is the umami aftertaste remained in mouth after the expectoration.
| Sensor name | Taste sensitivity | Application and artificial lipid |
|---|---|---|
| AAE | Umami or Richness | Foodstuffs such as beverage, flavoring agents etc. Phosphoric acid di(2-ethylhexyl) ester |
| CT0 | Saltiness | Foodstuffs such as flavoring agents etc. Tetradodecylammonium bromide 1-hexadecanol |
| CO0 | Acidic bitterness or Aftertaste from acidic bitterness | Foodstuffs, medicine, and crude drugs, such as quinine etc. Tetradodecylammonium bromide |
| AE1 | Astringency or Astringent Aftertaste | Foodstuffs, medicine, crude drugs, such as toxic herbs etc. Tetradodecylammonium bromide |
Data analysis and statistics Analyses of pearson's linear correlation analysis, principal component (PCA) and cluster analysis were carried out by the XLSTAT (version 2010.3.06, Addinsoft, Paris, France) statistical software.
Theaflavins, thearubigins and theabrownins & their correlation with taste values and taste quality TF, TR and TB are complex phenolic compounds deriving from the oxidation of catechins and their gallates during the fermentation stage of black tea processing (Roberts, 1962). TF, bright orange-red, which comprise about 3 - 5% (wt/wt) of extract solids, are the first stable oxidation products formed by oxidative coupling of an appropriate pair of catechins (one with a vic-trihydroxyphenyl moiety and the other with an ortho-dihydroxyphenyl structure) in black tea fermentation (Harbowy and Balentine, 1997; Roberts, 1962). TR, red-brown or darkbrown, which comprise about 20% (wt/wt) of extract solids, are a heterogeneous mixture of oxidized products with high- molecular-mass (Harbowy and Balentine, 1997). TB are found to be polymerised thearubigins linked with proteins (Zhang, 1987). The content of TF, TR and TB are presented in Table 2. TF content of the tea samples varied from 0.12% to 0.38% with an average of 0.24%, TR content from 2.63% to 5.95% with an average of 4.07%, and TB from 5.96% to 10.51% with an average of 7.59%. B14 had the highest TF, B11 had the highest TR and B7 had the highest TB. B1 had the lowest TF, TR and TB. TF, TR and TR/TR in the black teabags from UK markets averaged 1.54%, 11.09% and 0.14 while in USA markets, they were 1.17%, 9.45% and 0.12, respectively (Lakenbrink et al., 2000). TF, TR and TF/TR in the black teabags from Australian markets averaged 0.77%, 8.90% and 0.09 (Yao et al., 2006). In this current study, black teas from UK, USA and Australian markets were compared with the black tea from Chinese markets. Results show that the black tea from Chinese markets has the lowest TF and TR content and the lowest TF/TR ratios. Accordingly, the black tea from Chinese markets should have a relatively softer taste than those consumed overseas because of the lower TF and TR contents and lower TF/TR ratios.
Pearson's linear correlation analysis showed that TF was positively and significantly correlated with astringency (r = 0.521, p< 0.05, Table 3), aftertaste of astringency (r = 0.619, p< 0.01) and richness (r = 0.618, p < 0.01). TR was also positively correlated aftertaste of astringency (r = 0.530, p < 0.05), while TB was negatively correlated with bitterness (r = -0.486, p < 0.05). The present finding confirmed the important contribution of TF and TR to taste quality of black tea (Sanderson et al., 1976; Zhen, 2004). Bitterness was positively and significantly correlated with after taste of bitterness (r = 0.953, p < 0.01). Astringency was positively correlated with after taste of astringency (r = 0.925, p < 0.01), umami (r = 0.673, p < 0.01), richness (r = 0.753, p < 0.01) and saltiness (r = 0.622, p < 0.01). After taste of astringency was also positively correlated with umami (r = 0.752, p<0.01), richness (r = 0.914, p<0.01) and saltiness (r= 0.735, p<0.01). Umami was positively correlated with richness (r = 0.781, p < 0.01) and saltiness (r = 0.754, p < 0.01) and richness correlated strongly with saltiness (r = 0.839, p < 0.01). Taste score had a positive correlation with TF (r = 0.691, p < 0.01) and TR (r = 0.604, p < 0.05). Meanwhile, taste score correlated positively with astringency (r = 0.483, p < 0.05) and after taste of astringency (r = 0.518, p < 0.05).
| Taste score | TF | TR | TB | Sourness | Bitterness | Astringency | Aftertaste-B | Aftertaste-A | Richness | Umami | |
|---|---|---|---|---|---|---|---|---|---|---|---|
| TF | 0.691** | ||||||||||
| TR | 0.604* | 0.687** | |||||||||
| TB | -0.037 | 0.084 | 0.126 | ||||||||
| Sourness | 0.044 | 0.000 | -0.212 | 0.454 | |||||||
| Bitterness | -0.049 | -0.214 | -0.037 | -0.486* | -0.276 | ||||||
| Astringency | 0.483* | 0.521* | 0.402 | -0.110 | -0.077 | 0.118 | |||||
| Aftertaste-B | -0.005 | -0.177 | -0.032 | -0.348 | -0.154 | 0.953** | 0.260 | ||||
| Aftertaste-A | 0.518* | 0.619** | 0.530* | 0.066 | -0.049 | -0.016 | 0.925** | 0.175 | |||
| Umami | 0.230 | 0.274 | 0.296 | -0.132 | -0.480 | -0.006 | 0.673** | 0.150 | 0.752** | ||
| Richness | 0.452 | 0.618** | 0.454 | 0.146 | 0.030 | -0.178 | 0.753** | 0.049 | 0.914** | 0.781** | |
| Saltiness | 0.241 | 0.261 | 0.192 | 0.193 | 0.138 | -0.389 | 0.622** | -0.149 | 0.735** | 0.754** | 0.839** |
Determination of black tea samples using a taste-sensing system The taste evaluations of black tea samples from the taste-sensing system considered as promising comprehensive information were investigated. The information of taste values included not only initial taste (sourness, bitterness, astringency, umami and saltiness) but also aftertaste (bitter aftertaste, astringent aftertaste and richness). As shown in Figure 1, the tested black samples showed significant changes in multifarious taste values consisting of five initial tastes (astringency, bitterness, sourness, saltiness and umami) as well as aftertastes of astringency and bitterness and richness. Eight taste values of different black tea samples showed different levels in Figure 1.. B16 had the strongest bitterness and astringency & the strongest aftertastes of astringency and bitterness. B13 had the weakest bitterness and the weakest aftertastes of bitterness. B12 had the weakest astringency and the weakest aftertastes of astrin- gency. B15 had the strongest umami while B12 had the weakest umami. B16 had the strongest richness and saltiness while B12 had the weakest richness and saltiness. B5 had the strongest sourness while B13 had the weakest sourness.
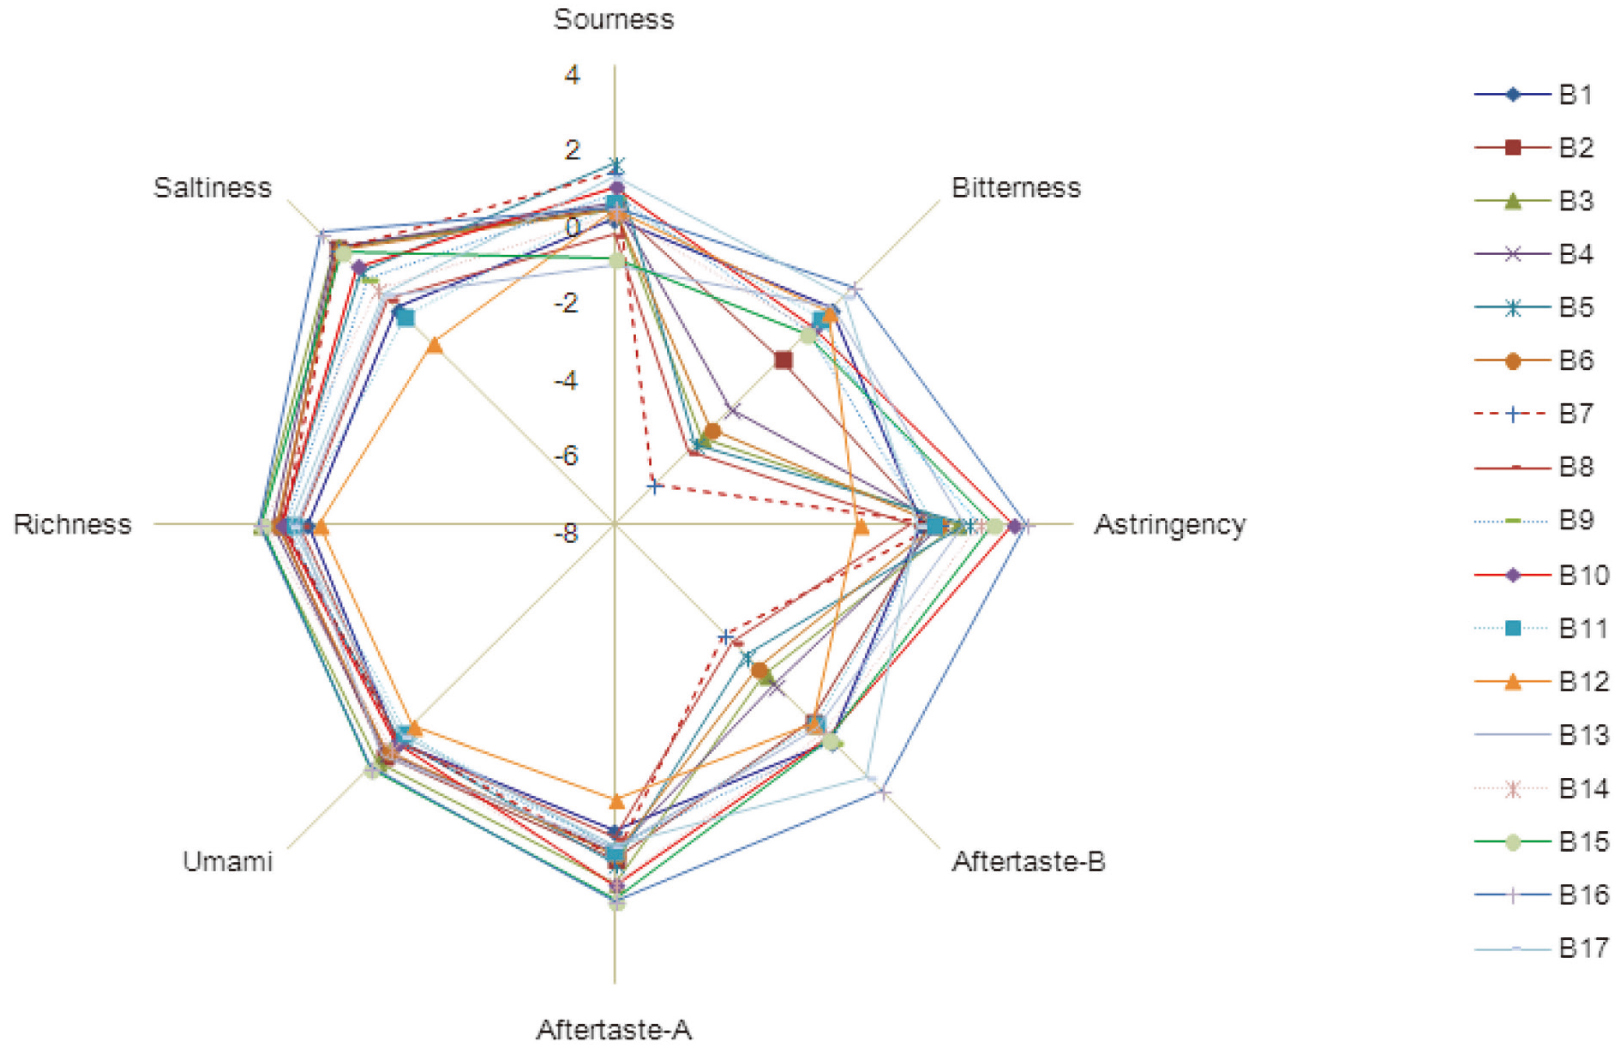
Spider plot for taste values of black tea samples.
Multivariate analysis on chemical components provides useful methodology to distinguish the origin, quality and category of teas (Liang et al, 2003, 2007; Le Gall et al, 2004; Wang et al, 2010). To select the most useful indicators, principal component analysis (PCA) was applied to screen the data set. The PCA with the taste values showed that the cumulative variance of the first two principal components accounted for 79.41% of the total variance of the data set (Figure 2). Cluster analysis was further performed on the 17 black tea samples based on the first two principal components (Figure 3). B3, B4, B5, B6, B7 and B8 were assorted to one group & B15 and B16 were assorted to one group. B1, B2, B9, B10, B11, B13, B14 and B17 were also assorted to one group. Adoption of more principal components did not give clearer classification of black teas. The result showed that black teas can be partially classified by cluster analysis using PCA components, but the interpretation of the results remains open to debate.
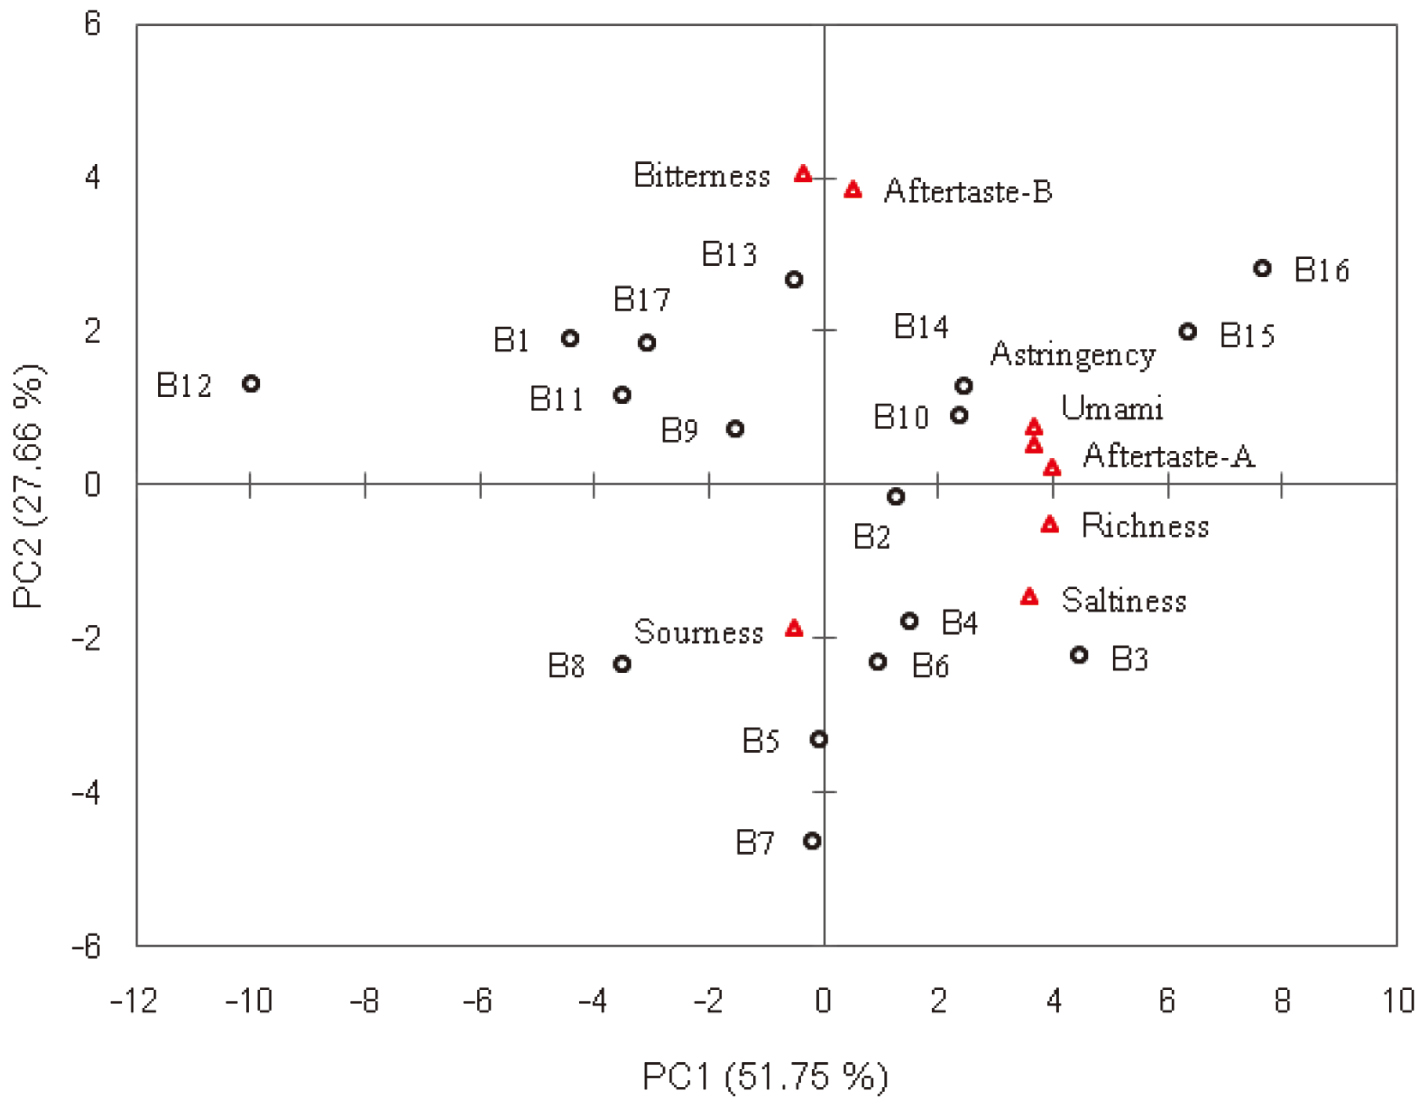
Biplot of PC scores and factor loadings in PCA for 17 black teas.
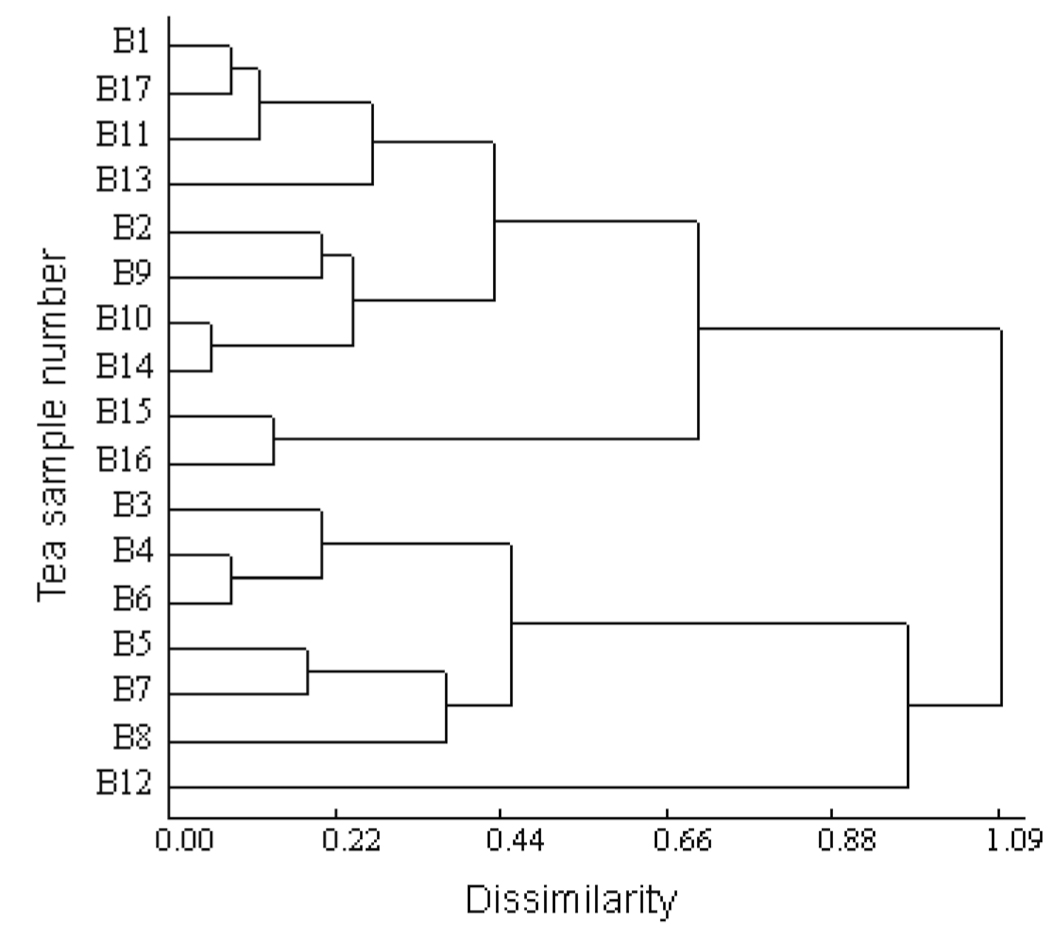
Dendrograms of cluster analysis on 17 black tea samples using the first two principal components.
In this investigation, we focused on 17 kinds of Chinese black tea. Differences in the taste values and taste quality of the infusions were reflected by differences in the amounts of TF, TR and TB. The content of TF, TR and TB in different black teas varied quite widely. This might be resulted from different varieties, processing method, maturity of tea leaves, cultivation practices and even small difference in processing conditions such as withering time. The family of tea cultivars used in producing B1 (Lapsang souchong), B2 (Tanyang Congou), B3 (Zhenghe Congou), B4 (Bailin Congo) and B5 (Jin Junmei) are Camellia sinensis var. bohea, var. tanyang- caicha, var. khenghe bai hao (Zhenghe Da Bai), var. fudin bai hao (Fuding Da Bai) and var. bohea, respectively. B6 (Keemun), B7 (Dian Hong), B10 (Taiwan black tea) and B17 (Ying De Hong) are made from Camellia sinensis var. Qimen indigenous Chuye Cultivar, Yunnandaye variety, Hongyu (Taicha No.18) and Ying Hong No.9, respectively. B1 is made from plucks each with one bud and two or three leaves, while B5 is made from plucks each with one bud. B1 and B5 are made in the Xiaozhong manner and other 15 black teas were made in the Congou manner. For the production of B1, tea leaves are withered indoors with pine tree smoke and dried by pine tree smoke. However, B5 was only withered indoors with pine tree smoke. Four major theaflavins, namely theaflavin, theaflavin-3-gallate, theaflavin-3-gallate, and theaflavin-3,3'-digallate have been identified from black tea (Scharbert et al., 2004b). TR could separate into three large groups, i.e. SI TRs, SIa and SII TRs according to their solubility in different solvents. SI TRs are extractable into ethyl acetate, whereas SIa and SII TRs, which are those that remain in the aqueous phase, are more soluble in diethyl ether (Roberts, 1958). Division of TR into many groups makes the elucidation of individual TR components' contribution to tea quality difficult (McDowell et al., 1995). Thus, the relationship four kinds of theaflavins and three groups of thearubigins with taste values and taste quality is needed to investigate in the near future.
Correlation analysis showed that TF was positively and significantly correlated with astringency (r = 0.521, p < 0.05) in this study. However, application of taste dilution analyses on freshly prepared black tea infusions revealed neither the high molecular weight thearubigen-like polyphenols nor the catechins and theaflavins, but a series of 14 flavon-3-ol glycosides as the main contributors to the astringent taste perceived upon black tea consumption (Scharbert et al., 2004a). More experiments are needed to evaluate other active compounds (catechins, flavon-3-ol glycosides, sugars, amino acids and alkaloids) that contribute importantly to taste properties for black teas by combination of electronic tongue and taste dilution techniques. There are interactions between taste substances, such as the synergistic effect and the suppression effect (Toko, 1998). It is necessary to measure those effects and to classify a great variety of black tea chemical substances into several groups.
The work was financially supported by the Ministry of Science and Technology of China (project no. NCET-11-0969). We thank Beijing Ensoul Technology Ltd. (China) for making the taste test of black teas.