Original papers
Effect of Sorbitol on Rheological, Textural and Microstructural Characteristics of Peanut Butter
2014 Volume 20 Issue 4 Pages 739-747
Details
2014 Volume 20 Issue 4 Pages 739-747
Sorbitol could lower the viscosity, yield stress, flow behavior index, storage modulus, loss modulus, and elevated the consistency index, loss tangent of peanut butter. It made peanut butter have greater mobility and more obvious liquid characteristic. Sorbitol could reduce the hardness and stickiness of peanut butter, thereby solving the problem of poor spreadability of traditional (stability) peanut butter. The microstructure of the sorbitol added peanut butter system was well-distributed and more compact. It had a higher degree of adhesion, a stronger shear resistance and anti-thixotropy. Sorbitol could enhance color and aroma of peanut butter, make its texture condition more uniform and taste more delicate. More importantly, the peanut butter with sorbitol was easier to spread on the food, and the coating was more smooth and uniform. On the whole, the peanut butter sample with 9% sorbitol added had the best sensory quality.
Peanut butter is a viscoelastic food material that exhibits both solid like and fluid like behavior. It is grinded by peanut particles with water, sugar (sucrose), salt, wheat fiber, and other ingredients (preservative, emulsifier and flavoring materials). It has a broad consumer market because of its unique roasted peanut fragrance and be rich in nutrients such as protein (Xiong et al., 2013; Huang, 2011), especially unsaturated fatty acids (Ozcan and Seven, 2003). The pure peanut butter is an unstabilized suspension consisting of solid peanut particles in peanut oil (Zhang and Liu, 2006), in order to increase its stability, traditional peanut butter tend to add some stabilizers such as hydrogenated oil, vegetable protein powder and fiber material to make it stable, but the strong repulsive force induced by these stabilizers brings high hardness and low liquidity (Citerne et al., 2001). Not only decrease the spreadability of peanut butter, but also increase the production cost of enterprise, influence its economic benefits. Therefore the rheological characteristics and spreadability of peanut butter plays an important role in improving the comprehensive quality of peanut butter and the economic benefits of enterprises. Sorbitol is a kind of polyhydroxy alcohols with 6 hydroxyl groups. Because of its sweetness and low calorie characteristics, sorbitol is widely used in food industry for sweetener and water retaining agent (Zoulias et al., 2002). Some research showed that the sorbitol can reduce the hardness, storage modulus (G') and loss modulus (G'') of mango jam (Basu et al., 2011), therefore improve its spreadability. One study showed that the sorbitol can change the textural properties (Iseya et al., 2000) to improve product quality of squid meats during curing and drying processes. Likewise, it was proved that the sorbitol can significantly improve the moisture content, taste, juiciness and reduce the hardness, chewiness of bacon (Zhong et al., 2013). These make the product more acceptable to consumers. The polyhydroxy structure of sorbitol can combine with water to form more space network node and makes a fully emulsifying dispersion of water and adipose bead in peanut butter. And so that, peanut butter system can rebuild the network structure destroyed by shear stress faster (Li, 2010). This phenomenon is called anti-thixotropic activity. That has a certain effect on enhancing the rheology stability and improving the quality of the products. The objective of the present study was to investigate the effect of sorbitol addition on rheological, textural, microstructural characteristics and sensory properties of peanut butter.
Materials Pure peanut butter was procured from Shengkang Oil Industry and Trade Co., Ltd. (Rizhao, China). Wheat fiber NWF-200 was procured from Nuoshen Food Trading Co., Ltd. (Shanghai, China). Sorbitol was procured from Maichao Import and Export Co., Ltd. (Shanghai, China). Monostearin was procured from Pinxiu Special Chemicals Co., Ltd. (Guangzhou, China). Sucrose fatty acid ester was procured from Jinhelai Food Additive Co., Ltd. (Hangzhou, China). Salt was purchased from the local market.
Preparation of peanut butter using sorbitol Peanut butter samples were stired using a high-speed dispersion machine (T18, IKA, Germany) and a homogenizer (model: JHG-Q54-P60, Zhangyan Corp., Shanghai, China). Peanut butter samples were first prepared in duplicate with 45.59 wt.% pure peanut butter at 1 wt.% salt concentration, 3 wt.% wheat fiber concentration, 0.22 wt.% monostearin, 0.19 wt.% sucrose fatty acid ester and 50 wt.% water. And then different concentrations of sorbitol (0%, 3%, 6%, 9%, and 12% in weight) were added to them. Previous studies on the stability of peanut butter revealed that better quality product was made at 1 wt.% salt concentration, 3 wt.% wheat fiber concentration, 0.22 wt.% monostearin, 0.19 wt.% sucrose fatty acid ester, and about 50 wt.% water (Li et al., 2013).
First stired wheat fiber in pure peanut butter and placed for 1 h, made it reaches full oil adsorption saturation. Then added monostearin which had been dissolve in a little heat peanut oil and stired to mix well. And finally, added sucrose fatty acid ester, salt and sorbitol which had been dissolve in 50°C warm water, stired well and homogenized twice under 30 MPa with homogenizer.
Steady state rheology Steady state rheological properties of samples were measured using a rheometer (AR-G2, TA, USA) with temperature control using a circulating water bath. The procedure was increasing the stress on the sample logarithmically and finding out the point where the sample started to deform/flow (initiation of shear rate). That point was calculated by software as yield stress (Basu et al., 2013). All the tests were replicated thrice and average values were used in analysis. Steady state rheological behavior of peanut butter was studied at 25°C. Parallel plate geometric configuration (PP 20, diameter = 20 mm) was used and measuring gap of 1.0 mm between the plates was maintained during the measurements. Pre-shearing was done for 10 s and the samples were rested for 2 min before starting the experiment. Extra sample coming out after loading was wiped carefully.
Shear rate was increased logarithmically from 0.1 to 10 s−1. Steady state relationship between shear stress-shear rate of peanut butter is expressed in terms of Herschel Bulkey model (Peinado et al., 2012; Yang et al., 2011).
 |
where τ is shear stress (Pa), τ0 is yield stress (Pa), γ is shear rate (s−1), K is consistency index (Pa.sn), and n is flow behavior index (dimensionless) signifying the extent of deviation from Newtonian behavior.
Steady state relationship between viscosity-temperature of peanut butter was studied when the shear rate was 10 s−1. Parallel plate geometric configuration (PP 20, diameter = 20 mm) was used and measuring gap of 1.0 mm between the plates was maintained during the measurements. Temperature was increased linearly from 0 to 30°C (Álvarez et al., 2006; Dautant et al., 2007). Dependence of the flow behavior of fluid foods on temperature can be described by the Arrhenius relationship.
 |
where A is frequency factor (Pa.sn), Ea represents activation energy (kJ/mol), R is gas law constant (R = 8.314 J/mol K), and T is absolute temperature (K).
Dynamic rheology Dynamic rheological measurements were performed in a controlled stress rheometer (AR-G2, TA, USA). Parallel plate geometric configuration (PP 20, diameter = 20 mm) was used. The measuring gap between the plates was 1.0 mm during all the measurements and experiments were carried out at 25°C. Pre-shearing was done for 10 s and the samples were rested for 2 min before starting the experiment to allow the relaxation of the residual stresses arising due to loading. And extra sample coming out after loading was wiped carefully in the same way. The dynamic rheological measurements (frequency sweep) were done in triplicate and average values were used for model parameters calculation. Studies on rheological properties of peanut butter (Citerne et al., 2001) established the linear viscoelasticity zone by the oscillatory strain (0.001 – 100) sweep experiment. The value of strain at which peanut butter exhibited the linear behavior was 0.01. The frequency sweeps tests were performed at strain (0.01) over a frequency range of 0.1 – 10Hz at 25°C.The oscillatory rheological parameters obtained were: storage modulus (G'), loss modulus (G''), loss tangent (tan δ), and dynamic viscosity (η).
Textural properties The textural properties of peanut butter samples were measured using Texture Analyzer, TA.XT. Plus (Stable Microsystems, UK) with respect to spreadability parameters only, because peanut butter is spread on bread. Spreadability parameters included hardness and stickiness, values (Basu et al., 2013). Spreadability is the ease with which a product can be spread. It is a desired characteristic of jam, margarine, butter, mayonnaise, salad dressing, etc. Hardness (g. force) is defined as the maximum force on the product that displays substantial resistance to deformation. Stickiness (g. force) is defined as the maximum force necessary to overcome the attractive forces between the surface of the food and the surface of the probe with which the food comes in contact. Spreadability was measured using approximately 10 g peanut butter sample in spreadability probe (perspex conical) with 45° angle at room temperature (25 ± 2°C) (Basu et al., 2011). The tests were performed in triplicate and the results were expressed as mean ± standard error.
Scanning electron microscopy (SEM) SEM was performed on freeze dried peanut butter samples, which were mounted on aluminium stubs with double face tape and coated with a thin layer of gold and palladium alloy using a fine coat ion sputter to impart electrical conductivity to the sample (Veena and Bhattacharya, 2012). The samples were viewed and photographed on the SEM (S-4800, HITACHI, Tokyo, Japan) at an accelerating voltage of 10 kV and magnification in the range of 1000x.
Sensory evaluation The semi-trained panel consisted of 8 members including males and females members of Jiangnan University. All evaluation sessions were held in the laboratory of Fresh Food Processing and Preservation in University Institute of Food Science and Technology, Jiangnan University. The sensory evaluation of peanut butter was conducted after 1-day storage at room temperature of it manufacturing. Initially, panelists were trained in 2 h sessions prior to evaluation to be familiar with attributes and scaling procedures of peanut butter samples under study.
Sensory characteristics: color, odor, texture, taste, spreadability, and overall acceptability of peanut butter samples were evaluated following nine point hedonic scale (Tang et al., 2011; Liu et al., 2007), 1 = the least, the lowest; 9 = the most, the highest. All samples were presented before the panelists at room temperature under normal lighting conditions in 80 mL cups coded with random numbers. Spoons and bread pieces were provided to these panelists. Drinking water was provided between samples for oral rinsing to eliminate the influence of previous sample. The average values of the sensory scores (color, odor, texture, taste, spreadability, and overall acceptability) were used in the analysis.
Statistical Analysis Effects of sorbitol on rheological, textural and sensory qualities of peanut butter were replicated three times. The factors was sorbitol concentrations with five levels (0%, 3%, 6%, 9%, and 12%). Significance testing was performed using Fisher's least significant difference (LSD) test, and the differences were taken to be statistically significant when the p-value was < 0.05. All analysis was performed using PASW Statistics (version 18.0, IBM Information Management Corp., Armonk, USA).
Steady state rheology of peanut butter The steady state rheological properties of peanut butter are critical to its quality and taste. Based on Figure 1, the viscosity of all the peanut butter samples lowered as the shear rate increased. From the perspective of fluid mechanics, they could be classified as non-Newtonian pseudoplastic fluid. With more sorbitol added, the viscosity of the peanut butter was getting lower. This could mainly attribute to the fact that sorbitol contains a lot of hydroxyl which is hydrophilic. The hydrogen bonding of water with sorbitol molecules might partly substitute for the strong absorption of wheat fiber and water in the peanut butter. The junction zones of sobitol and water were weaker and could be destroyed by shear stress more easily. Thus the higher concentration of sorbitol resulted in the lower viscosity of peanut butter samples. When increasing the addition of sorbitol (account for more than 9% amount), the lower moisture content of peanut butter would slow the decreasing tendency of its viscosity.

Effect of sorbitol addition on steady state rheological behavior of peanut butter at 25°C.
The rheological behavior of peanut butter samples with different additive amount of sorbitol was well explained by Herschel Bulkley model. The Yield stress and model coefficients (K and n) along with statistical parameters (coefficient of determination) were reported in Table 1. According to Table 1, based on Herschel Bulkley model, all the R2 of the peanut butter's flow curve were above 0.99. It indicated that peanut butter's rheological type conformed with Herschel Bulkley's model. Yield stress reflects the minimum stress needed when peanut butter produces the phenomenon of flowing. It's also the main factor that influence the spreadability of peanut butter. If yield stress is too large, it will harden peanut butter and decrease its spreadability, and if yield stress is a little small, it will improve the mobility and spreadability of peanut butter. While yield stress gets too small, it will turn peanut butter to fluid and lead to its poor conformality and spreadability. As seen from the table, peanut butter had large yield stress if it contains no sorbitol. Its yield stress decreased remarkably with the addition of sorbitol. This was mainly because sorbitol lowered peanut butter's viscosity, which improved the mobility among the peanut particles. When additive amount of sorbitol was up to 12%, yield stress was negative. It indicated peanut butter at this state can flow automatically without outer stress and had poor conformality and spreadability. With the addition of sorbitol, the consistency index increased and flow index decreased. It indicated that sorbitol can lower the pseudoplastic degree of peanut butter (shear-thinning effect). Pseudoplastic behaviour refers to the phenomenon that when the object to be tested is influenced by the increasing shearing rate, its inner particles' direction and organization are changed, causing its network structure broken, which decreases its viscosity. However, after adding sorbitol, its polyhydroxy structure increased the network nodes of peanut butter system and made the structure difficult to be broken by shearing to equip it with stronger rheology stability. So, the conformality would be improved after spreading and difficult to collapse.
| Sorbitol (%) | Yield Stress (Pa) | K (Pa·sn) | n | R2 |
|---|---|---|---|---|
| 0% | 28.38 ± 0.72a | 5.12 ± 0.61c | 1.17 ± 0.05a | 0.992 |
| 3% | 21.92 ± 0.55b | 9.98 ± 0.54c | 1.00 ± 0.02b | 0.998 |
| 6% | 17.30 ± 1.38b | 16.71 ± 1.53b | 0.78 ± 0.04c | 0.993 |
| 9% | 4.52 ± 1.62c | 17.24 ± 1.83b | 0.67 ± 0.04cd | 0.991 |
| 12% | −1.21 ± 2.14d | 23.05 ± 2.44a | 0.55 ± 0.04d | 0.991 |
Note: different letters carried by the mean (±standard deviation) in the same line refer to significant difference (p < 0.05).
Peanut butter of high quality should have relatively good spreadability both in the cold (the temperature of the refrigerator) and high (the temperature of the coated food) temperature. In other words, spreadability should have the least influence of the temperature. The rheological parameters of peanut butter with good spreadability should barely change within 5 – 30°C. As is shown in Figure 2, the viscosity of peanut butter samples decreased gradually when the system temperature increased (in the same shearing rate). This was because the increasing temperature activated the molecule Brownian Movement and lower the flow resistance of system. Based on the figure 2, after adding sorbitol, the peanut butter samples obtained a more obvious decreasing tendency of viscosity than those without sorbitol. This is probably because the network structure formed by sorbitol, which play the role of uniformity and stability in peanut butter system, was easy to be broken during the heating process. It would largen the decreasing tendency of its viscosity. Activation energy reflects the energy which is needed to be overcome when flowing. In generally, the greater the force of molecular interactions is, the higher activation energy is needed when flowing and the greater sensibility viscosity is to temperature. The relationship between viscosity and temperature conformed to Arrhenius model. By fitting the data of Figure 2, its activation energy could be reached though the slope and the results were in Table 2. After fitting Arrhenius model of peanut butter, the R2 were all above 0.99, which indicated that Arrhenius model could well reflect the influence of temperature to viscosity of peanut butter. As is shown in the table, after adding sorbitol, peanut butter's activation energy increased, which means the addition of sorbitol has a bad effect on viscosity's heat resistance of peanut butter. On the whole, however, it was still within acceptable level and caused no influence in peanut butter's spreadability.

Effect of temperature on viscosity of peanut butter at selected sorbitol addition amount.
| Sorbitol (%) | Ea(kJ/mol) | R2 |
|---|---|---|
| 0 | 12.60 ± 0.15a | 0.998 |
| 3 | 16.77 ± 0.13b | 0.999 |
| 6 | 16.51 ± 0.11b | 0.999 |
| 9 | 17.75 ± 0.22c | 0.997 |
| 12 | 17.49 ± 0.21c | 0.997 |
Note: different letters carried by the mean (±standard deviation) in the same line refer to significant difference (p < 0.05).
Dynamic rheology of peanut butter By dynamic rheological testing to the sample, its overall strength and viscoelasticity proportion can be estimated through storage modulus (G'), loss modulus (G''), and loss tangent (tan δ) (Opazo-Navarrete et al., 2012; Rønholt et al., 2012). These information can effectively reflect food structure, organization and processability. G' can reflect the nature of the solid-like character (elasticity); G'' can reflect the nature of the liquid-like character (viscosity). The tan δ (the ratio of G'' and G') reflects the relative strength between viscous components and elastic components of the sample. The larger number of tan δ shows the greater contribution viscous components made to the sample's viscoelasticity proportion.
Figure 3 shows how G', G'', and tan δ of peanut butter samples with different amount of sorbitol change with frequency. Based on Figure 3 (a) and Figure 3 (b), with the increasing amount of added sorbitol, peanut butter's G' decreased. The G'' kept declining while adding sorbitol. But when the amount reached 9%, it rised slightly and later dropped again. It indicated a certain amount of sorbitol could simultaneously reduce the elastic components and viscous components of peanut butter and weaken the intensity of peanut butter system. The cause might be the the effect of hydroxyl in sorbitol, which was consistent with the result of steady state rheological test before. After comparing the two figures, it was found that G' was larger than G'' in all samples, which indicated peanut butter system was the viscoelastic system in which elasticity played a dominant role. The addition of sorbitol did not change the nature of the peanut butter. As can be seen from Figure 3 (c), after adding 3% sorbitol, the tan δ of peanut butter samples was higher than samples contains no sorbitol. When the amount reached 6%, the tan δ was somewhat lower, just below the sample contains no sorbitol. When the additive amount reached more than 9%, tan δ increased significantly with the increasing sorbitol concentration. It indicated when sorbitol content was in a high level, the elastic components' degree of reducing was larger than the viscous compositions of peanut butter. Viscosity had greater contribution to viscoelastic system of peanut butter and equipped it with a higher flowability. Their tan δ at that time were less than 1, indicating that the elastic components still dominant in the system and shown the characteristics of solid. As can be seen from Figure 3 (d), with increasing frequency, the dynamic viscosity (η) of all the samples shown a downward trend. With increasing amount of sorbitol added in, the η gradually decreased. At higher concentrations, it tended to be balanced, which basically conformed to the measured results of the steady state rheological properties of peanut butter.
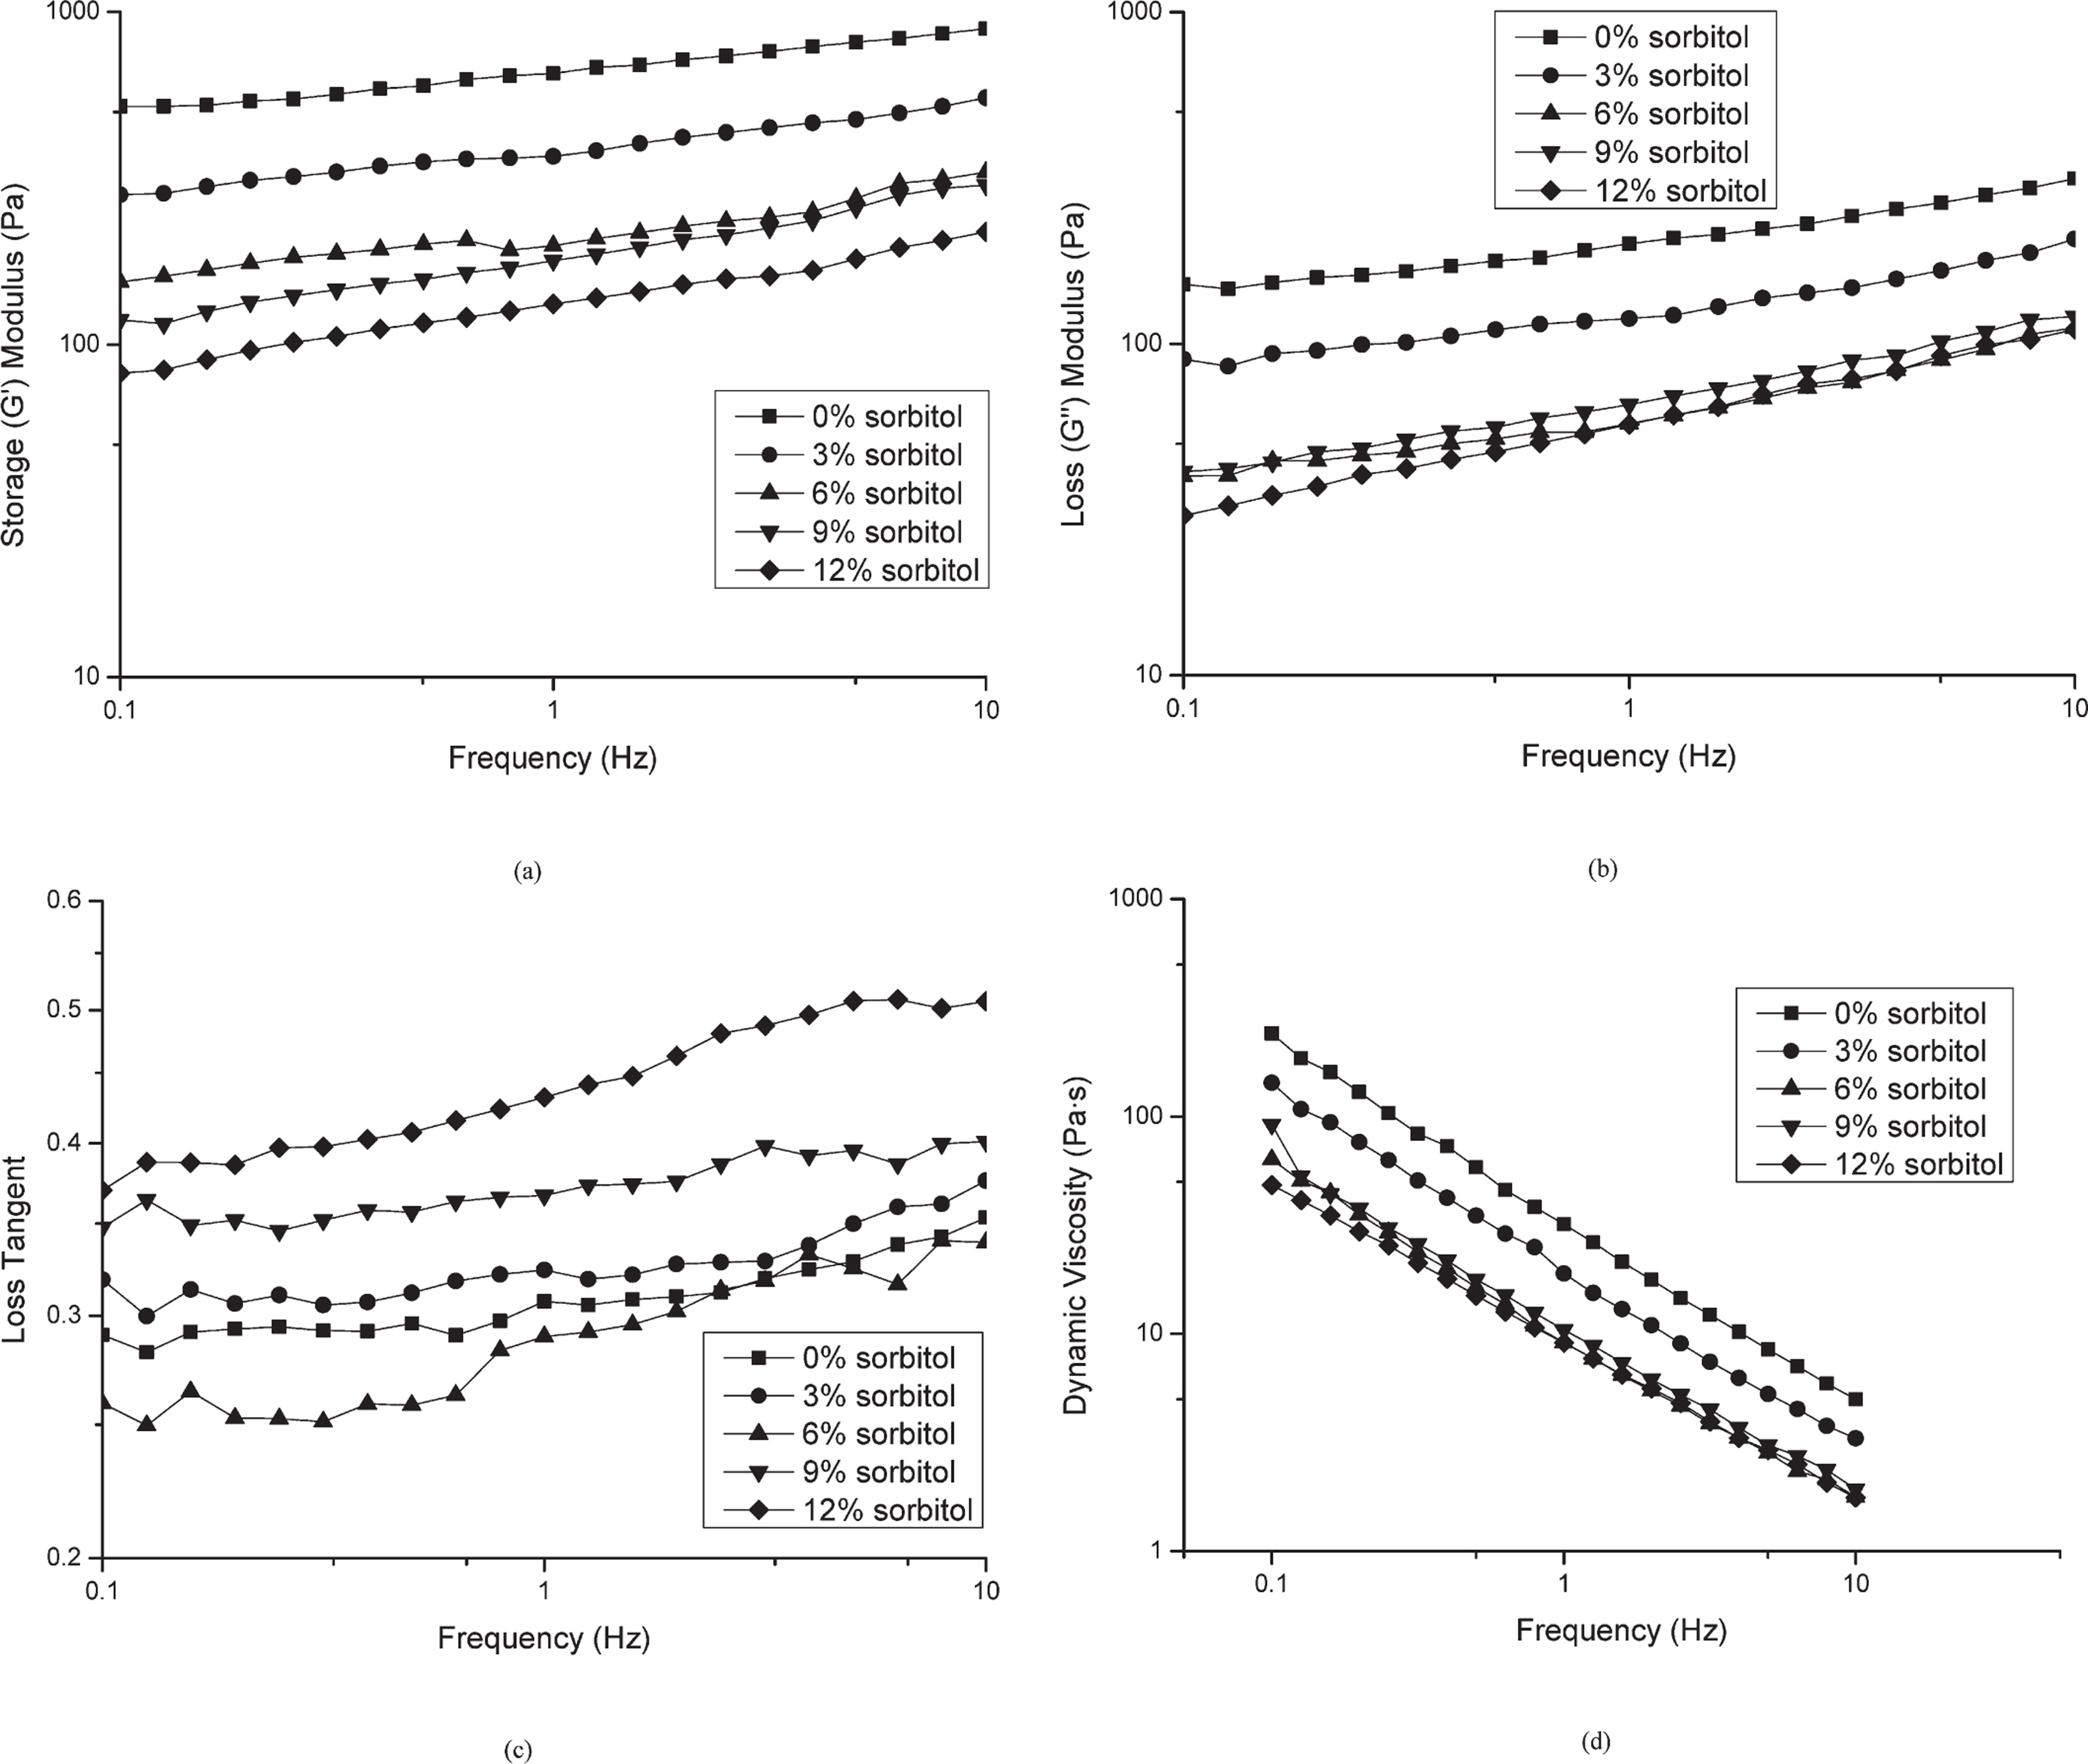
(a) Storage moduli of peanut butter at selected sorbitol addition amount; and, (b) loss moduli of peanut butter at selected sorbitol addition amount; and, (c) loss tangent of peanut butter at selected sorbitol addition amount; and, (d) dynamic viscosity of peanut butter at selected sorbitol addition amount.
Textural Properties of peanut butter Peanut butter is typical kind of spreads category. Hardness and stickiness are two important texture indicators determining its spreadability (Swenson et al., 2000). Hardness mainly influences the force which needs to be yielded when spreading. As the hardness rises, it's more laborious to spread peanut butter on the food. However, when hardness is too small, peanut butter will not solid enough and easy to collapse or flow. The principal influence of adhesive property of peanut butter is the stickiness. Peanut butter with strong stickiness is easy to adhere to the surface of food. But too strong stickiness makes it easy for peanut butter to adhere to the smudge tool, also make it difficult to disperse in the mouth which will affect chewing and swallowing.
Table 3 shows that peanut butter without adding sorbitol had larger hardness and stickiness. It was hard to spread, and easily adhered to the smudge tool, thus having a poor spreading property. With increasing addition of sorbitol and then its content got higher, both hardness and stickiness tend to decreased. It indicated that the addition of sorbitol made peanut butter's texture softer, reducing the applied force to be overcome. It could also control its adhesive property into a preferred range which was conducive to the improved spreadability. This matched the rheological test results that sorbitol could reduce the yield stress and the consistency index of peanut butter.
| Sorbitol (%) | Hardness (g·force) | Stickiness (g·force) |
|---|---|---|
| 0 | 162.61 ± 1.73a | −162.83 ± 1.19a |
| 3 | 115.55 ± 1.41b | −119.55 ± 0.82b |
| 6 | 91.96 ± 1.29c | −91.96 ± 0.76c |
| 9 | 78.55 ± 1.25d | −76.17 ± 0.68d |
| 12 | 74.98 ± 1.06d | −70.86 ± 0.73e |
Note: different letters carried by the mean (±standard deviation) in the same line refer to significant difference (p < 0.05).
Microstructure of peanut butter Microscopic structure and rheological properties of peanut butter are closely related. Analyzing the SEM Spectrum of peanut butter with 0%, 9%, 12% sorbitol addition amount respectively. The results were shown in Figure 4.

Microstructure of (a) peanut butter without sorbitol addition; (b) peanut butter with sorbitol addition amount of 9%; and, (c) peanut butter with sorbitol addition amount of 12% at 1000x magnification.
Microanalysis found peanut butter system contains no sorbitol had loose and uneven network structure, in which the distribution of peanut particles and wheat fiber was uneven. And there was a large gap between them. After the addition of sorbitol, sorbitol was filled between peanut particles and wheat fibers, so that the conglutination between them got even closer. The interface became blurred so that the structure of the system got more closely and homogeneous, with no large voids between them. The larger amount of sorbitol was, the smaller gap in the system was and the less number of holes were. The hydrophilic interaction of its polyhydric structure led to the tight combination of sorbitol molecules and water molecules. Maybe the process could form some network structure. Because it was evident from the micrographs of peanut butter samples that peanut particles, wheat fibers and fat particles could be dispersed in some network structure uniform with introduction of sorbitol (Fig. 4(b) and (c)), and forming a homogeneous compaction system. Thus, peanut butter with addition of sorbitol could exhibit stronger shear resistance.
Sensory properties of peanut butter Figure 5 is the sensory evaluation results of the samples of peanut butter with different addition amount of sorbitol. Sorbitol made peanut butter products more brown and shiny, making its aroma richer and more pure, texture more uniform, more liquid and taste more delicate. It would also improve people's appetite. What's more, the addition of sorbitol improved the spreadability of peanut butter greatly. Spreading became more smoothly, the coating became more smooth and uniform. It's mainly because sorbitol had good ability of moisture absorption and moisture retention, so that it could prevent peanut butter cracking and aging. Not only could it keep peanut butter fresh and soft long time, but also could it maintain its fluidity. Spreading also became more smoothly. All these verified the results of rheological experiments at the macro level. Taken together, peanut butter samples with 9% addition of sorbitol had the best sensory quality. Its odor, taste, spreadability and overall acceptability had the highest score in the five sets of samples. The sensory quality of the product declined when the addition amount reaches 12% since it produced noticeable sweetness.

Sensory scores of sorbitol peanut butter at selected sorbitol addition amount.
Steady state rheological properties showed that peanut butter was pseudoplastic. Its rheological properties complied with the Herschel Bulkley model. Its viscosity and temperature conformed with the Arrhenius model. Sorbitol could reduce the viscosity, yield stress and flow behavior index of peanut butter and improved its consistency index. Dynamic rheological properties showed that sorbitol lowered the storage modulus, loss modulus and loss tangent of peanut butter, thereby improving the fluidity of peanut butter and making the properties of the liquid more apparent. The results of textural properties test showed that sorbitol could reduce the hardness and stickiness of peanut butter, thereby improving the disadvantages of poor spreadability and too strong adhesion of the traditional peanut butter. As could be seen from the SEM map, the microstructure of peanut butter (with sorbitol added) system was more uniform, close and with a higher degree of adhesion. Sensory evaluation also showed that from the macro level, sorbitol could enhance the color and aroma of peanut butter. It could also make the texture more uniform, taste more delicate. The peanut butter with sorbitol was easier to spread on the food, and the coating was more smooth and uniform. On the whole, the samples in which added sorbitol of 9% had the best sensory quality.
Acknowledgements The Authors are greatly indebted to Mr. Sun, Mr. Ding, and Ms. Liu for their technical assistance and thank the School of Food Science and Technology of Jiangnan University for the use of the Rheometer.