Abstract
Response surface methodology (RSM) was applied to predict optimum conditions for microwave-assisted extraction (MAE) of crude water-soluble polysaccharides from Piteguo fruit (PTG). A central composite design was used to optimize microwave power (X1: 400 – 600 W), extraction time (X2: 5 – 10 min) and ratio of water to material (W/M ratio, X3: 30:1 – 50:1 mL/g) to obtain a high crude polysaccharides yield. The statistical analyses indicated that all of the three factors had significant effect on the extraction yield of crude polysaccharides (p < 0.001). The results showed that the extraction ratio of crude polysaccharides was up to 7.86% under the optimum extraction conditions as follows: microwave power 550 W, extraction time 9 min, W/M ratio 45 mL/g, which was consistent with the predicted models with the coefficients of determination (R2) of 0.9809.
Introduction
Piteguo fruit (PTG), which is originally known as Pinangguo fruit by local residents, is classified as Pyrus sinkiangensis, subfamily Maloideae, family Rosaceae. As a kind of sciophilous, cold-resistant especial ancient tree species, Piteguo trees grow at a high altitude of 2100 – 2400 meters in Hezheng County, Linxia Hui Minority Autonomous Prefecture, Gansu Province, China, in which the annual average temperature is about 5.2°C, the annual average rainfall is 640 mm, the frost-free period is over 120 days, with approximate 2500 hours of sunshine annually. The oldest tree-age is over 180 years and the maximum single-plant fruit yield reaches at about 1800 kg. In addition, it proves to have strong plant vigor and environmental adaptation, for it can grow well in poor soil, and resist common diseases and insects. As a result, Piteguo tree has being widely cultivated in this area by local villagers for a long time. The fruit was picked right off the tree with a yellowish-green pericarp and hardness pulp, and it smells nice but tastes acerb, actually. After postmaturation, PTG has to be treated properly to remove acerbity, Soluble tannins distributed in the special tannin cells can be transformed into insoluble tannins by CO2, alcohol and acetaldehyde produced from anaerobic fermentation in sealed containers. the color of the fruit turns brown and the pulp feels much softer than the unripe one,which tastes sour and sweet, warm in nature, contains a variety of nutrition, which are help for human beings. In previous studies (Wang et al., 2013), The authors measured the contents of the main nutritional ingredients in PTG. Results showed the contents of moisture, total ash, crude fat, protein, total sugar, total acid, crude fiber and total soluble solid were 83.2%, 3.3%, 0.82%, 0.38%, 11.47%, 1.05%, 3.05% and 13.8%. Vitamin C, B1, B2, B6 and Carotenoids were 2.2 mg/100 g, 0.001 mg/100 g, 0.139 mg/100 g, 6.8 mg/100 g and 0.042 mg/100 g, respectively. Contents of eighteen amino acids, EAA/TAA ratio, and EAA/NEAA ratio were 0.2658%, 37.02% and 58.78%, respectively. It is also reported in traditional Chinese medicine theory that PTG has important health care functions such as nourishing the stomach, moistening the lung, quenching thirsty, relieving cough, softening blood vessels, dealcoholizing to protect liver, and so on. So it is considered as a novel green food with high nutritional value (An, 2005).
Polysaccharides are a type of common ingredients in many fruits with important health care functions such as anti-tumor effects (Zhu et al., 2011), anticoagulation (Wijesinghe et al., 2011), anti-injury (Shi et al., 2005), antioxidation (Shi et al., 2005; Thetsrimuang et al., 2011), anti-inflammatory effects (Chen et al., 2012) and enhancing human immunity (Yi et al., 2012). The research emphases of modern medicine and functionalized food chemistry have focused on the physiological activities and structures of polysaccharides. So far, a large number of researches on extraction technologies of kinds of polysaccharides have been reported, including solvent extraction (Wang et al., 2011), bio enzymatic method (Wijesinghe et al., 2011), ultrasonic-assisted extraction (Yi et al., 2010; Chen et al., 2012; Tian et al., 2012), supercritical fluid extraction (Wang and Weller, 2006), microwave-assisted extraction (MAE) (Zeng et al., 2012), and so on. However, as a result of its nativeness and special habitat distributions, PTG has not been known by the outside and the potential values of its rich nutrients applied in food, healthcare and ecology have not yet been realized until recent years. There have been few papers dealing with polysaccharides extraction technology, studies on the structures and activities from PTG. The objectives of this study were Optimization of microwave-assisted extraction of water-soluble polysaccharides from Piteguo fruit by response surface methodology. MAE procedure was applied to extract crude polysaccharides due to its positive efficiency, low cost and operation convenience in many polysaccharide extraction examples including from Lycoris aurea (Ru et al., 2009), from tremella (Chen et al., 2012), from Lilium davidii var. unicolor Salisb (Zhao et al., 2013), and so on. Recently, response surface methodology (RSM) (Yi et al., 2010; Zhong and Wang, 2010; Zou et al., 2011) is generally considered an effective statistical technique for optimizing complex processes, due to its obvious advantages, e.g. the reduced number of experimental trials needed to evaluate multiple parameters and their interactions, less laborious and time-consuming. Box-Behnken design (BBD) (Ferreira et al., 2007), one type of RSM was introduced to optimize MAE technology condition of crude polysaccharides from PTG (PTGP) and systematically analyze the effects of extraction parameters on their yields and their interactions. In addition, the structures and activities of PTGP were analyzed in order to provide the theoretical basis for application of PTGP and full development of this kind of undeveloped fruit resource.
Materials and Methods
PTG preparation PTG was picked in Hezheng County, Linxia Hui Minority Autonomous Prefecture, Gansu Province in November, 2011. Then, treated (postmature) fruits were transferred and stored at −20°C for the following extraction experiments.
Extraction of crude PTGP with MAE treatment The treated PTG were washed by distilled water and the peels were removed before being cut into small pieces. The process of crude PTGP by MAE treatment was carried out in a microwave experiment equipment (NJC 03-2, 2450 MHz, Nanjing, Jiangsu, China) with adjustable power settings ranging from 100 W to 800 W. The microwave processor employed in this study was equipped with one 3000 mL closed polytetrafluoroethylene vessel, a power sensor, a temperature sensor, a temperature controller and a cooling system. The pieces of PTG were ground further, and then transferred into the polytetrafluoroethylene vessel. The extraction processes were performed respectively under different MAE conditions. After extraction, the vessel was withdrawn and allowed to cool at room temperature. The treated mixed solutions were filtered respectively, and the supernatant was concentrated in a vacuum concentrator and precipitated with 80% ethanol, and dried to obtain the crude PTGP by vacuum freeze drying.
Determination of the yield of PTGP The content of PTGP was measured by phenol-sulfuric acid method (Dubois et al., 1956; Zhang and Zhang, 2004). The freeze-dried PTGP sample was dissolved into 100 mL distilled water, and optical density of this solution at 485 nm (OD485) was measured. The content of PTGP was calculated according to equation of linear regression (Y = 0.0607x − 0.0569, R2 = 0.9977) based on the standard curve whose horizontal coordinate (x) and vertical coordinate (Y) denoted the concentration of glucose (µg/mL) and OD485, respectively. The PTGP yield could be calculated as follows:
where C denoted the concentration of PTGP calculated by the calibrated regression equation (mg/mL); N denoted the dilution factor; V denoted the total volume of extraction solution (mL); and W denoted the weight of raw material (g).
Experimental design and statistical analyses The yield of the polysaccharides was affected by numerous parameters. It was necessary to select the parameters that had major effects (Bagherian et al., 2011; Chen et al., 2012). It was reported that extraction power, extraction temperature, extraction time, ratio of water to raw material and extraction number had significant effects on the polysaccharides (Ru et al., 2009; Bagherian et al., 2011; Chen et al., 2012; Zhao et al., 2013). While Microwave power, extraction time and ratio of water to raw material were regards as the critical influencing factors in MAE (Ru et al., 2009; Zhao et al., 2013). So the three parameters were screened by single-factor experiment including X1 (microwave power, 100 – 600 W), X2 (extraction time, 2.5 – 15 min), and X3 (W/M ratio, 10 – 60 mL/g), and extraction was repeated 3 times in this experiment. Significant differences of the three factors at different levels were analyzed for the yields of PTGP between different conditions, as shown as Table 1. Based on the preliminary results, the proper range for each factor was preliminarily determined, a three-level-three-factor BBD was adopted in the optimization for extraction of PTGP (shown in Table 2). Table 3 represented the coded and non-coded values of the experimental variables and 20 experimental points. Experimental data indicated that response variables were fitted to a quadratic polynomial model. The general form of the quadratic polynomial model was as follows:
where
Y denoted the measured response associated with each factor lever combination;
β0,
βi,
βii and
βij denoted the regression coefficients for intercept, linear, quadratic and interaction terms, respectively; both of
xi and
xj denoted the coded independent variables. In addition, Design-Expert software (Trial version 7.1.6, Stat-Ease Inc., Minneapolis, MN, USA) was applied to estimate the response of each set of experimental design and optimized conditions. The fitness of the quadratic polynomial model was inspected by the regression coefficient R
2.
F-value and
p-value were used to check the significances of the regression coefficient.
Table 1.
Significant differences of the three factors at different levels
| Parameters |
(I)VAR |
(J)VAR |
Mean difference (I-J) |
Std. |
Std. error |
Sig. |
95% confidence interval |
| Lower bound |
Upper bound |
| Microwave power (W) |
400 |
100 |
3.5000* |
0.08888 |
0.05132 |
0.000 |
3.2792 |
3.7208 |
| 200 |
2.4167* |
0.11590 |
0.06692 |
0.001 |
2.1287 |
2.7046 |
| 300 |
1.3100* |
0.07810 |
0.04509 |
0.001 |
1.1160 |
1.5040 |
| 500 |
0.0300* |
0.01000 |
0.00577 |
0.035 |
0.0052 |
0.0548 |
| 600 |
0.3967* |
0.04041 |
0.02333 |
0.003 |
0.2963 |
0.4971 |
| Extraction time (min) |
10 |
2.5 |
2.9233* |
0.04726 |
0.02728 |
0.000 |
2.8059 |
3.0407 |
| 5 |
1.5900* |
0.01000 |
0.00577 |
0.000 |
1.5652 |
1.6148 |
| 7.5 |
0.5233* |
0.02309 |
0.01333 |
0.001 |
0.4660 |
0.5807 |
| 12.5 |
0.0467* |
0.00577 |
0.00333 |
0.005 |
0.0323 |
0.0610 |
| 15 |
0.4667* |
0.04933 |
0.02848 |
0.004 |
0.3441 |
0.5892 |
| W/M ratio (mL/g) |
40 |
10 |
3.1867* |
0.03215 |
0.01856 |
0.000 |
3.1068 |
3.2665 |
| 20 |
2.2667* |
0.04726 |
0.02728 |
0.000 |
2.1493 |
2.3841 |
| 30 |
1.0467* |
0.04509 |
0.02603 |
0.001 |
0.9347 |
1.1587 |
| 50 |
−0.0600* |
0.01000 |
0.00577 |
0.009 |
−0.0848 |
−0.0352 |
| 60 |
−0.0867* |
0.03512 |
0.02028 |
0.051 |
−0.1739 |
0.0006 |
Note: (I)VAR and (J)VAR denote the optimum value and other value of the variables; Mean difference (I-J) denotes the mean difference of the yield of PTGP under the different conditions. Std. denotes the standard deviation; Sig. denotes the significance;
* The mean difference is significant at the 0.05 level.
Table 2.
Independent variables used in the response surface design
| Variables |
Levels |
| −1 |
0 |
1 |
| Microwave power (X1) (W) |
400 |
500 |
600 |
| Extraction time (X2) (min) |
5 |
7.5 |
10 |
| W/M ratio (X3) (mL/g) |
30:1 |
40:1 |
50:1 |
Table 3.
Box-Behnken design and the response values for the yields of PTGP
| No. |
X1 (Microwave power, W) |
X2 (Extraction time, min) |
X3 (W/M ratio, mL/g) |
Extraction yield (%) |
| 1 |
400.00 |
5.00 |
30.00 |
7.07 |
| 2 |
600.00 |
5.00 |
30.00 |
7.18 |
| 3 |
400.00 |
10.00 |
30.00 |
7.12 |
| 4 |
600.00 |
10.00 |
30.00 |
7.22 |
| 5 |
400.00 |
5.00 |
50.00 |
7.09 |
| 6 |
600.00 |
5.00 |
50.00 |
7.35 |
| 7 |
400.00 |
10.00 |
50.00 |
7.38 |
| 8 |
600.00 |
10.00 |
50.00 |
7.88 |
| 9 |
400.00 |
7.50 |
40.00 |
7.56 |
| 10 |
600.00 |
7.50 |
40.00 |
7.69 |
| 11 |
500.00 |
5.00 |
40.00 |
7.62 |
| 12 |
500.00 |
10.00 |
40.00 |
7.74 |
| 13 |
500.00 |
7.50 |
30.00 |
7.65 |
| 14 |
500.00 |
7.50 |
50.00 |
7.78 |
| 15 |
500.00 |
7.50 |
40.00 |
7.93 |
| 16 |
500.00 |
7.50 |
40.00 |
7.92 |
| 17 |
500.00 |
7.50 |
40.00 |
7.94 |
| 18 |
500.00 |
7.50 |
40.00 |
7.96 |
| 19 |
500.00 |
7.50 |
40.00 |
7.91 |
| 20 |
500.00 |
7.50 |
40.00 |
7.98 |
Physical and chemical characters of PTGP The solubility of PTGP was carried out as following: the polysaccharides (50 mg) were dissolved in the distilled water, vigorously mixed and incubated in a 37°C water bath and the time was recorded until that the polysaccharides were completely dissolved. Starchy polysaccharide was determined by Iodine-potassium iodide reaction (Lee et al., 1994). Reducing sugar was determined by Fehling reagent (Schneider, 1979). Uronic acids were assayed by the colorimetric method of uronic acid-carbazole reaction according to the procedure outlined by Bitter et al. (1962). Protein was measured by bradford technique (Bradford, 1976). The Optical rotations were determined by the Automatic Polarimeter (Physical optics instrument factory, Shanghai). Each experiment was performed for three times.
Analysis of monosaccharide compositions The polysaccharide (20 mg) was hydrolyzed with 20 mL of 1.0 M trifluoroacetic acid (TFA) at 120°C for 6 h in a sealed glass tube, neutralized, washed and dried. Acetylation was then carried out using the trifluoroacetic anhydride reagent (Wang et al., 2010). The derivatives were analyzed by gas chromatography (GC) with an DB-5 chromatographic column (0.2 mm × 35 m × 0.25 µm, American agilent) equipped with a flame-ionization detector (FID). As references, the following standard sugars were converted to their acetylated derivatives and analyzed: rhamnose, arabinose, xylose, mannose, glucose and galactose. The GC operation was performed using the following conditions: N2: 15 mL/min; injection temperature: 210°C; detector temperature: 300°C, column temperature programmed from 180 to 220°C at 10°C/min.
Statistical analysis tatistical analysis of the single-factor experimental data was performed with SPSS 17.0 software (SPSS Inc., Chicago, IL, USA). Besides, Design-Expert software (Trial version 7.1.6) was used for the experimental design and regression analysis of the experimental data as well. Student's T-test was introduced to check the statistical significance of the regression coefficient. The second-order model equation at a probability (P) of 0.001, 0.01 or 0.05 was determined by Fischer's F-test. The adequacy of the model was determined by evaluating the lack of fit, the coefficient of determination (R2) and the F-test value were obtained from the analysis of variance (ANOVA).
Results and Discussion
Effect of Microwave power on the yield of PTGP The efficiencies of different microwave power on the yield of PTGP were investigated. The other key extraction conditions were invariable, i.e., extraction time 5 min, W/M ratio 30 mL/g. As shown in Fig. 1A, the extraction yield of PTGP was observed to improve significantly with increasing microwave power and reach the optimum value (7.72%) when microwave power was increased to 400 W. However, the extraction yield decreased slowly when microwave power was higher than 400 W. Significant differences were shown in Table 1, which implied that the mean difference of the yield was the highest at 400 W (p < 0.05). This phenomenon could be explained that solvent viscidity declined and the molecular movements accelerated with the increase of power, which benefited bioactive compounds to release from plant cells into solutions (Alfaro et al., 2003; Wang et al., 2010). In addition, much higher power promoted the degradation of some sensitive compounds (Bagherian et al., 2011). Therefore, the center point of microwave power was considered to be 400 W in this experiment.

Effect of extraction time on the yield of PTGP The effects of different extraction time on the yield of PTGP were shown in Fig. 1B. In detail, the PTGP contents were determined under different extraction duration of 2.5, 5.0, 7.5, 10.0, 12.5 and 15.0 min, respectively, while other extraction parameters were given as the followings: W/M ratio 30 mL/g, microwave power 300 W. It could be found that the yield increased as extraction time extended from 2.5 to 10 min, peaked at 10 min, and then no longer increased when the extraction time exceeded 10 min. It was also noticed from Table 1 that significant differences were exhibited between extraction period of 10 min and the other extraction periods (e.g. 2.5, 5.0, 7.5, 12.5, 15.0 min) (p < 0.05). The optimal value of extraction time was 10 min.
Effect of W/M ratio on the yield of PTGP Different W/M ratio could significantly affect the extraction yield. If W/M ratio is too low, PTGP cannot be completely extracted, on the other hand, excessive extracting agent used will absolutely cause high process cost. In this single-factor-test, W/M ratio was set at 10, 20, 30, 40, 50 and 60 mL/g respectively, while other key extraction parameters were given as the followings: microwave power 300 W, and extraction time 10 min. As shown in Fig. 1C, it could be founded that the extraction yield of PTGP increased quickly with the increasing W/M ratio until 40 mL/g. It was revealed in Table 1 that significant differences existed among 40:1 and 10:1, 20:1, 30:1, 50:1 (p < 0.05), except between 40:1 and 60:1 (p > 0.05). However, considering the economic cost, W/M ratio of 40:1 was more suitable and adopted in this work.
Predicted model and statistical analysis The values of three independent variables including microwave power (X1), extraction time (X2), and W/M ratio (X3) were separately optimized using BBD design. The yield of PTGP ranged from 7.07% to 7.98%, and reached the maximum at the W/M ratio of 40 mL/g, microwave power of 500 W and extraction duration of 7.5 min (shown in Table 3). By applying multiple regression analysis in the experimental data, the model for the predicted the yield of PTGP (Y) could be expressed by the following quadratic polynomial equation (3) (in the form of coded values):
Statistical testing of the model was performed in the form of analysis of variance (ANOVA). The ANOVA for the fitted quadratic polynomial model of extraction of PTGP were shown in Table 4. The corresponding variables would be more significant if the F-value becomes greater and the p-value becomes smaller (Muralidhar et al., 2001). F-value of 57.20 and p-value < 0.0001 indicated the response surface quadratic model was suitable (shown in Table 4).
Table 4.
Analysis of variance testing the fitness of the regression equation
| Source |
SSa |
DFb |
MSc |
F-value |
p-value |
| Model |
2.00 |
9 |
0.22 |
57.20 |
< 0.0001 |
| Residual |
0.039 |
10 |
0.003893 |
|
|
| Lack of fit |
0.036 |
5 |
0.007107 |
10.45 |
0.0111 |
| Pure error |
0.0034 |
5 |
0.00068 |
|
|
| Cor. total |
2.04 |
19 |
|
|
|
R2 = 0.9809 R2adj = 0.9638
According to the quadratic regression model, the value of the determination coefficient (R2) was 0.9809, which meants that 98.09% of the variations could be explained by the fitted model. For a good statistical model, R2adj should be close to R2 (shown in Table 4). Therefore, a high degree of correlation between the observed and predicted values could be established. A relatively low value of C.V. (coefficient of variation) (0.82%) indicated a better reliability of the experiments values. Significance of the model was also judged by lack of fit test. As shown in Table 4, F-value and p-value of the lack of fit were 10.45 and 0.0111, respectively, which implied that the model was significant. The significance of each coefficient was determined using F-value and p-value. The results were given in Table 5. It could be seen that three independent variables (X1, X2, X3), one interaction term (X2X3) and three quadratic terms (X12, X22, X32) significantly affected the yield of PTGP (p < 0.01). The other one interaction term (X1X3) was also significant (p < 0.05). The results also showed that the order of factors influencing the response value was as follows: W/M ratio > microwave power > extraction time.
Table 5.
Estimated regression model of relationship between response variables (yield of PTGP) and independent variables (
X1,
X2,
X3)
| Source |
SSa |
DFb |
MSc |
F-value |
p-value |
Significance |
| X1 |
0.12 |
1 |
0.12 |
31.08 |
0.0002 |
** |
| X2 |
0.11 |
1 |
0.11 |
27.25 |
0.0004 |
** |
| X3 |
0.15 |
1 |
0.15 |
39.49 |
< 0.0001 |
** |
| X1X2 |
0.006612 |
1 |
0.006612 |
1.70 |
0.2217 |
NS |
| X1X3 |
0.038 |
1 |
0.038 |
9.71 |
0.0109 |
* |
| X2X3 |
0.067 |
1 |
0.067 |
17.11 |
0.0020 |
** |
| X12 |
0.19 |
1 |
0.19 |
48.42 |
< 0.0001 |
** |
| X22 |
0.12 |
1 |
0.12 |
30.21 |
0.0003 |
** |
| X32 |
0.081 |
1 |
0.081 |
20.85 |
0.0010 |
** |
** Very significant at
p < 0.01
* Significant at
p < 0.05
NS not significant
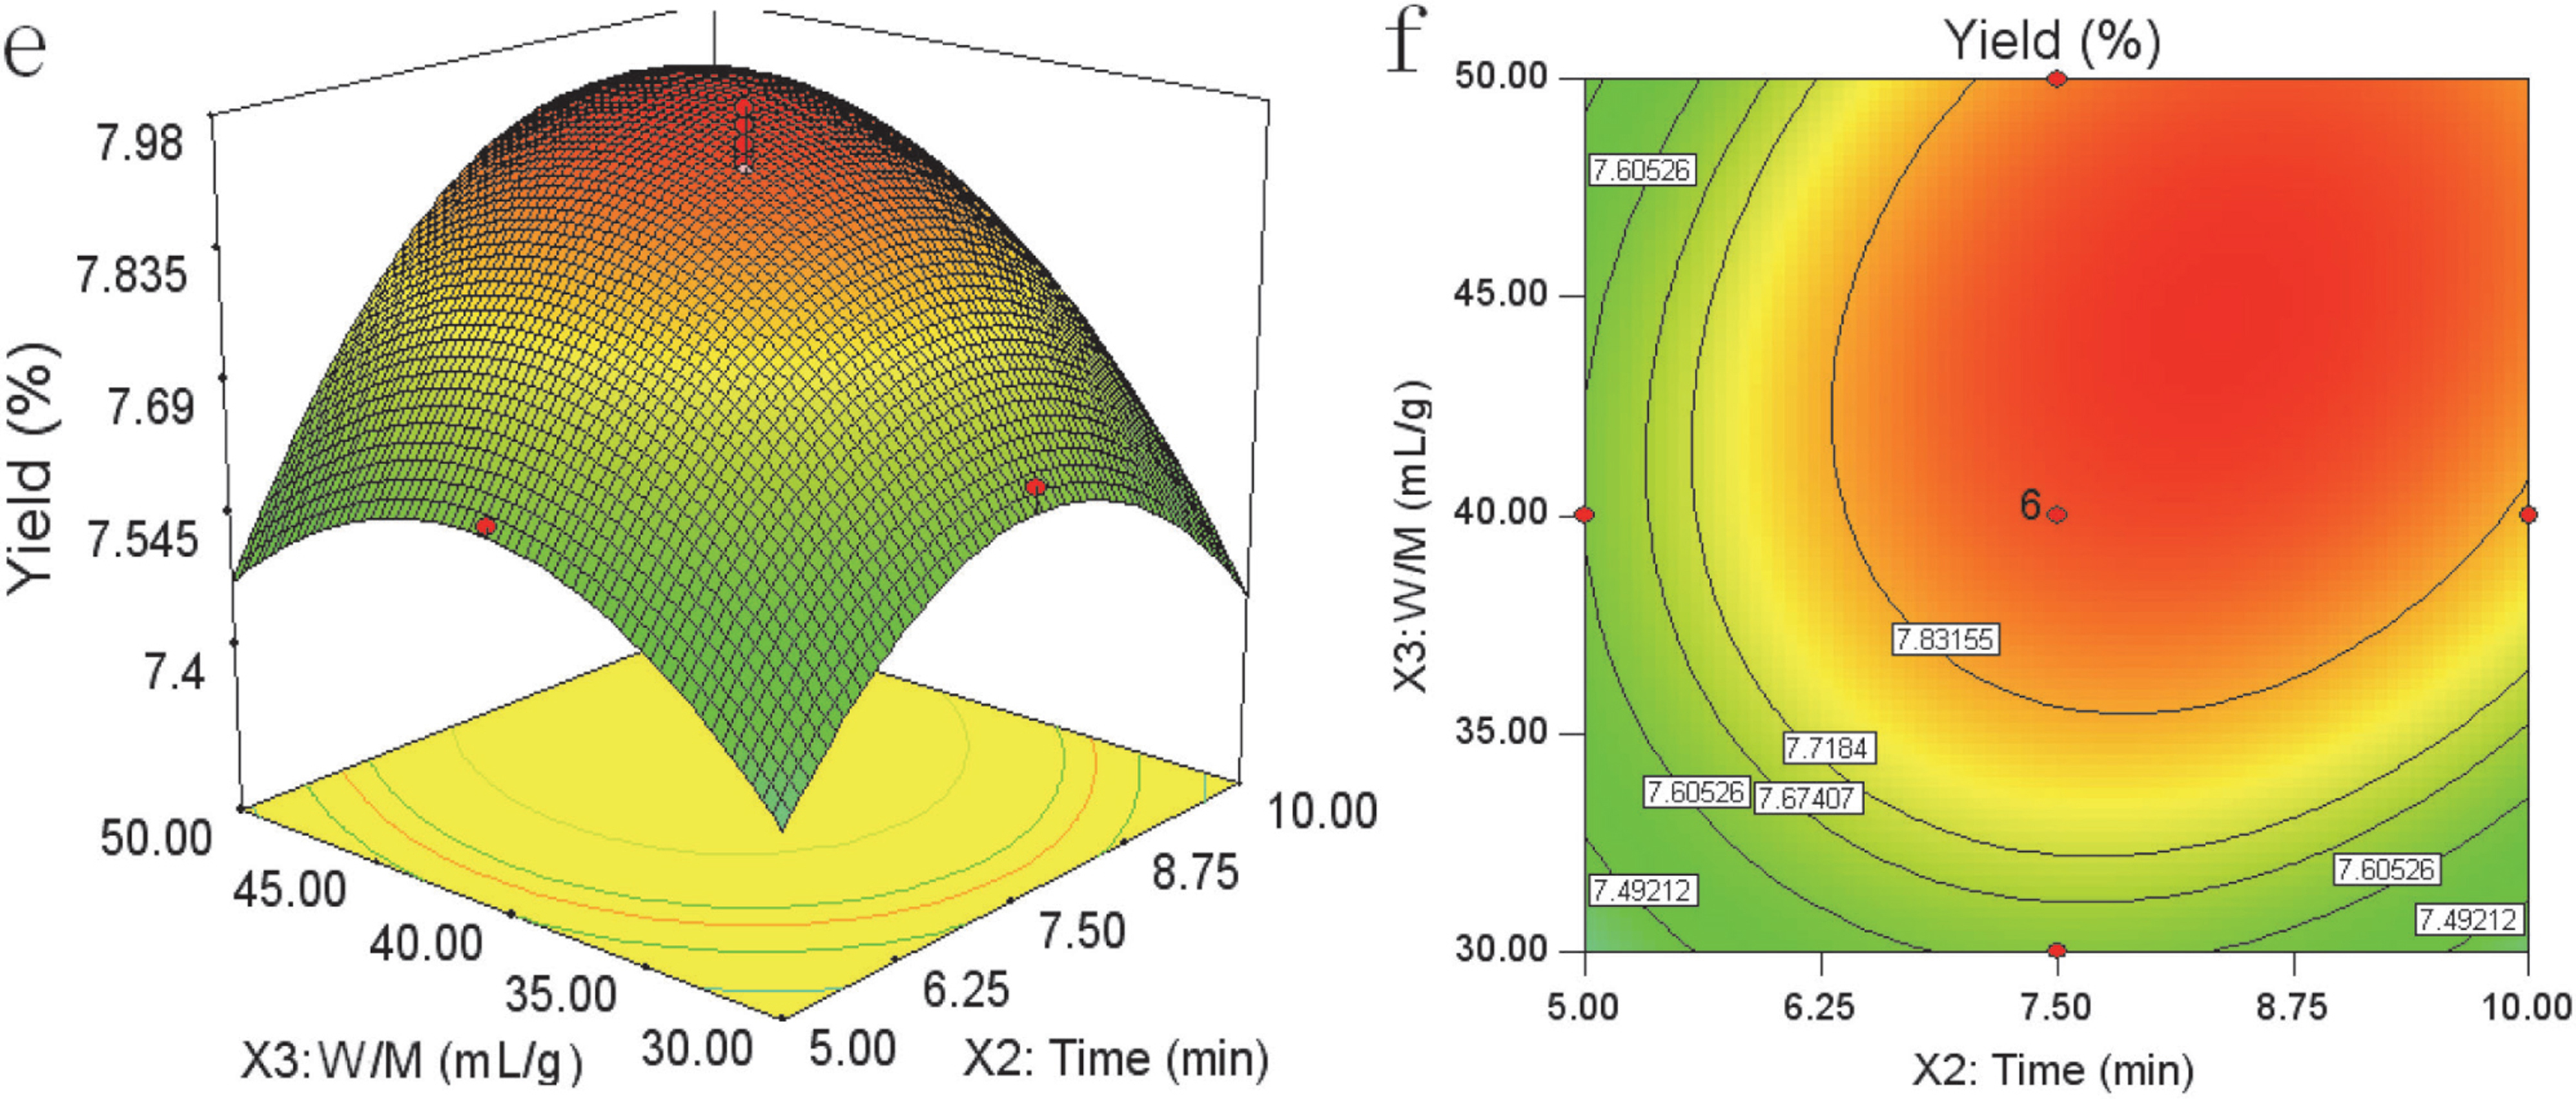
Analysis of response surface The relationship between independent and dependent variables was illustrated by the three-dimensional representation of the response surfaces and the two-dimensional contours generated by the model (shown in Figs. 2–4). Different shapes of the contour plots indicated different interactions between two of the variables. For instance, an elliptical contour plot indicated the interactions between the variables were significant, while a circular contour plot meant otherwise. Among these three variables (microwave power, extraction time, and W/M ratio), when two of the variableswithin the experimental range were depicted in three-dimensional surface plots, the third variable was kept constant at zero level. When W/M ratio (X3) was fixed at zero level, the interactions between microwave power and extraction time were shown in Fig. 2a. It could be found that the yield of PTGP increased with the extraction time and microwave power until the maximum, and then decreased. Therefore, the interaction displayed a quadratic effect on the response yield. Furthermore, the elliptical contour plot shown in Fig. 2b indicated their mutual interactions were not significant (Zou et al., 2011). Besides, when the extraction time (X2) was fixed at zero level, the yield of PTGP initially increased and then decreased with both increase of microwave power (X1) and W/M ratio (X3) (shown in Fig. 3c). The interactions between microwave power (X1) and W/M ratio (X3) were significant from the two-dimensional contours (shown in Fig. 3d). When microwave power (X1) was fixed at zero level, the yield of PTGP was observed to firstly increase with both increase of extraction time (X2) and W/M ratio (X3), and then decrease. Extraction time and W/M ratio displayed quadratic effects on the response (shown in Fig. 4e). The elliptical contour plot shown in Fig. 4f indicated their mutual interactions were significant.

Optimization of extracting parameters and validation of the model In this study, the model equation for predicting the optimum response values was tested under the selected optimal conditions. The predicted optimum conditions for PTGP extraction were given as follows: microwave power of 539.20 W, extraction duration of 8.66 min, and W/M ratio of 45.28 mL/g, respectively. According to the model, the predicted maximum yield was 7.98432%.
Considering the operability in actual production, the optimal conditions could be modified as follows: microwave power of 550 W, extraction time of 9.0 min, and the W/M ratio of 45 mL/g, respectively. Under these conditions, the mean value of PTGP yield 7.86 ± 0.12% (n = 3) was obtained. These analysis results confirmed that the response model was adequate for the optimization of extraction process (shown in Table 6), and the model of Eq. (3) was accurate.
Table 6.
Predicted and experimental values of the responses under optimal conditions
| Parameter |
Microwave Power (W) |
Extraction time (min) |
W/M ratio (mL/g) |
Yield (%) |
| Optimum conditions (predicted) |
539.20 |
8.66 |
45.28 |
7.98432 |
| Modified conditions (actual) |
550 |
9 |
45 |
7.86 ± 0.12 |
Physical and chemical characters of PTGP The physical and chemical characteristics of PTGP are shown in Table 7. Iodine reaction showed that PTGP was not starchy polysaccharide. Fehling reagent methods were positive reactions, indicating that PTGP was a reducing sugar. The uronic acid-carbazole reaction were positive reaction, which proved that PTGP contained uronic acids. Bradford method showed that PTGP was a conjugate with portions of polysaccharide and protein. The specific optical rotation was +136.21°, which implied PTGP with α-glycosidic bond. And PTGP was mainly consisted of rhamnose, arabinose, xylose, mannose, glucose and galactose, with the molar ratio of 3.06:2.32:1.56:4.87:3.28:2.18, as shown as the Fig. 5.
Table 7.
Physical and chemical characteristics of PTGP
| No. |
Parameter |
Results |
No. |
Parameter |
Results |
| 1 |
Color and texture |
White loose floccule |
5 |
The uronic acid-carbazole method |
+ |
| 2 |
Sloubility |
65 seconds |
6 |
Bradford method |
+ |
| 3 |
Iodine reaction |
− |
7 |
specific optical rotation |
+136.21° |
| 4 |
Fehling reagent |
+ |
|
|
|
Conclusion
In this study, an efficient MAE technology has been developed for rapid extraction of PTGP combined with RSM. The results showed that the independent variables (microwave power, extraction time, and W/M ratio), all two quadratic terms and the interaction effects between extraction time and microwave power had the most significant effects on the yield of PTGP. A second-order polynomial model was applied to optimize PTGP extraction by MAE technology. The optimal extraction conditions for PTGP were as follows: microwave power of 550 W, extraction time of 9.0 min, and W/M ratio of 45 mL/g, respectively. Under this conditions, the mean value of PTGP yield 7.86 ± 0.12 % (n = 3), which was closely correlated to the predicted value of 7.98%. And PTGP was mainly consisted of rhamnose, arabinose, xylose, mannose, glucose and galactose, with the molar ratio of 3.06:2.32:1.56:4.87:3.28:2.18, which was linked with α-glycosidic bond. This work provided a novel and efficient method for the extraction of water-soluble polysaccharides from PTG.
Acknowledgement We gratefully acknowledge the financial support received from the Doctoral Scientific Research Foundation of Lanzhou University of Technology (Contract No. 10-0058), and Natural Science Foundation of Gansu Province (1212RJYA008) and Teaching Research Project of Lanzhou University of Technology (JY2012045).
References
-
Alfaro, M. J., Bélanger, J. M. R., Padilla, F. C., et al. (2003). Influence of solvent, matrix dielectric properties, and applied power on the liquid-phase microwave-assisted processes (MAP™)1 extraction of ginger (Zingiber officinale). Food Res. Int., 36, 499-504.
-
An, S. K. (2005). Quantitative analysis of nutritious ingredients of Hull-embryo fruit pear. Food and Nutrition in China, 6, 43-46. (in Chinese)
-
Bagherian, H., Ashtiani, F. Z., Fouladitajar, A., et al. (2011). Comparisons between conventional, microwave- and ultrasound-assisted methods for extraction of pectin from grapefruit. Chem. Eng. Process. Process Intensification, 50, 1237-1243.
-
Bitter, T. and Muir, H. M. (1962). A modified uronic acid-carbazole reaction. Anal Bilche., 4, 330-334.
-
Bradford, M. (1976). A rapid and sensitive method for the quantitation of microgram quantities of protein utilizing the principle of protein-dye binding. Anal. Bilche., 72, 248-254.
-
Chen, W., Wang, W. P., Zhang, H. S., et al. (2012). Optimization of ultrasonic-assisted extraction of water-soluble polysaccharides from Boletus edulis mycelia using response surface methodology. Carbohydr. Poly., 87, 614-619.
-
Chen, Y. Z., Zhao, L., Liu, B. G., et al. (2012). Application of response surface methodology to optimize microwave-assisted extraction of polysaccharide from tremella. Physics Procedia, 24, 429-433.
-
Dubois, M., Gilles, K. A., Hamilton, J. K., et al. (1956). Colorimetric method for determination of sugars and related substances. Anal. Chem., 28, 350-356.
-
Ferreira, S. L. C., Bruns, R. E., Ferreira, H. S., et al. (2007). Box-Behnken design: An alternative for the optimization of analytical methods. Anal. Chem. Acta, 597, 179-186.
-
Lee, J. W., Yu, R. Y., and Chen, L. R. (1994). Principles and methods of biochemistry experiment. Beijing: Beijing University Press, 151-278.
-
Muralidhar, R. V., Chirumamilla, R. R., Marchant, R., et al. (2001). A response surface approach for the comparison of lipase production by Candida cylindracea using two different carbon sources. Biochem. Eng. J., 9, 17-23.
-
Ru, Q. M., Zhang, L. R., Chen, J. D., et al. (2009). Microwave-assisted extraction and identification of polysaccharide from Lycoris aurea. Chem. of Nat. Comp., 45, 474-477.
-
Schneider, F. (1979). Sugar analysis: Official and tentative methods recommended by the International Commission for Uniform Methods of Sugar Analysis. Peterborough: ICUMSA, 41-73.
-
Shi, Y. L., Yang, L. H., Cai, D. H., et al. (2005). The effect of pleurotus eryngii polysaccharide on exhausted mice's resistance to oxidation and injury. Journal of Physical Education, 12, 56-58. (in Chinese)
-
Thetsrimuang, C., Khamuang, S., Chiablaem, K., et al. (2011). Antioxidant properties and cytotoxicity of crude polysaccharides from Lentinus polychrous Lév. Food Chem., 128, 634-639.
-
Tian, Y. T., Zeng, H. L., Xu, Z. B., et al. (2012). Ultrasonic-assisted extraction and antioxidant activity of polysaccharides recovered from white button mushroom (Agaricus bisporus). Carbohydr. Polym., 88, 522-529.
-
Wang, J. L., Zhang, J., Zhao, B. T., et al. (2010). A comparison study on microwave-assisted extraction of Potentilla anserina L. polysaccharides with conventional method: Molecule weight and antioxidant activities evaluation. Carbohydr. Polym., 80, 84-93.
-
Wang, L. and Weller, C. L. (2006). Recent advances in extraction of nutraceuticals from plants. Trends Food Sci. Tech., 17, 300-312.
-
Wang, L. C., Zhang, K., Di, L. Q., et al. (2011). Isolation and structural elucidation of novel homogenous polysaccharide from Mactra veneriformis. Carbohydr. Polym., 86, 982-987.
-
Wijesinghe, W. A. J. P., Athukorala, Y., and Jeon, Y. J. (2011). Effect of anticoagulative sulfated polysaccharide purified from enzyme-assistant extract of a brown seaweed Ecklonia cava on Wistar rats. Carbohydr. Polym., 86, 917-921.
-
Wang Y. G., Ren H. W., Wang X. L, et al. (2013). Composition Analysis and Nutritional Evaluation of Pyrus sinkiangensis cv. Piteguo. Modern Food Science and Technology, 29, 2991-2996.
-
Xia, Q., Liu, G., Ge, C., et al. (2007). Removal of proteins from crude astragalus polysaccharides by sevag method. Anhui Medical and Pharmaceutical Journal, 11, 1069-1070. (in Chinese)
-
Yi, Y., Zhang, M. W., Liao, S. T., et al. (2010). Optimization of ultrasonicenzyme-assisted extraction technology of polysaccharides from Longan pulp. Transactions of the Chinese Society of Agricultural Machinery, 41, 131-136.
-
Yi, Y., Zhang, M. W., Liao, S. T., et al. (2012). Structural features and immunomodulatory activities of polysaccharides of Longan pulp. Carbohydr. Poly., 87, 636-643.
-
Zeng, W. C., Zhang, Z., Gao, H., et al. (2012). Characterization of antioxidant polysaccharides from Auricularia auricular using microwave-assisted extraction. Carbohydr. Polym., 89, 694-700.
-
Zhang, Q. and Zhang, T. M. (2004). Determination of polysaccharide content by phenol-sulfuric acid method. Shandong Food Science and Technology, 13, 17-18. (in Chinese)
-
Zhao, B. T., Zhang, J., Guo, X., et al. (2013). Microwave-assisted extraction, chemical characterization of polysaccharides from Lilium davidii var. unicolor Salisb and its antioxidant activities evaluation. Food Hydrocolloid., 31, 346-356.
-
Zhong, K. and Wang, Q. (2010). Optimization of ultrasonic extraction of polysaccharides from dried longan pulp using response surface methodology. Carbohydr. Polym., 80, 19-25.
-
Zhu, Z. Y., Liu, R. Q., Si, C. L., et al. (2011). Structural analysis and antitumor activity comparison of polysaccharides from Astragalus. Carbohydr. Polym., 85, 895-902.
-
Zou, Y. F., Chen, X. F., Yang, W. Y., et al. (2011). Response surface methodology for optimization of the ultrasonic extraction of polysaccharides from Codonopsis pilosula Nannf. var. modesta L. T. Shen. Carbohydr. Polym., 84, 503-508