Original papers
Optimization of Tea Sample Preparation Methods for ICP-MS and Application to Verification of Chinese Tea Authenticity
2014 Volume 20 Issue 6 Pages 1109-1119
Details
2014 Volume 20 Issue 6 Pages 1109-1119
In this study, 35 black, oolong, and green tea samples from China were analyzed by inductively coupled plasma mass spectrometry after a digestion method was developed on the basis of a response surface methodology. Linear discriminant analysis of whole data sets was performed in order to discriminate and classify Chinese tea samples according to their origin and type. The analysis revealed an excellent separation between tea samples according to their type and origin with a discrimination efficiency of 100%. The varieties of selected elements in Chinese tea were analyzed based on their origins and types.
Tea (Camellia sinensis L) is a highly popular nonalcoholic beverage consumed by over two-thirds of the world's population owing to its medicinal and refreshing effects (Karak and Bhagat 2010). Since tea contains several essential nutrients and trace elements, drinking tea is considered beneficial for human health. The presence of heavy metals at trace levels in tea has received much attention because they are directly related to health.
The efficacy of discriminating the geographical origin of teas is complicated by disparities in growing conditions such as soil and climate (Chen et al., 2009). The attributes of tea according to its geographical origin are also often recognized and appreciated by the consumers. Therefore, the discrimination of tea according to its geographical origin is presently the focus of attention (Moreda-Piñeiro et al., 2003). However, it is not easy to determine its geographical origin by sensory evaluation. On the other hand, since elemental composition can provide accurate information about the provenance (Cubadda et al., 2006) of a tea sample, it is possible to identify the origin of tea on the basis of its elemental composition.
In general, based on the different processing methods, teas are classified as: unfermented green tea (GT), fully fermented black tea (BT), and partially fermented oolong tea (OT), which are the most popular and frequently consumed teas in the world (Han et al., 2014). The processing method used affects the concentrations of elements in the processed tea. Therefore, the discrimination of tea types based on elemental fingerprinting is very urgent and important.
Because of its low limit of detection (LOD) and multi-element measurement capability (Salomon et al., 2002), inductively coupled plasma mass spectrometry (ICP-MS) is used in a number of food analysis laboratories for determining elements at trace and ultratrace levels (Walczyk 2001). Therefore, ICP-MS is considered to be one of the most effective tools for determining the provenance of tea (Chudzinska et al., 2012; Herwig et al., 2011). This technique has been employed for the determination of trace metals in olive oil (Llorent-Martínez et al., 2011), honey (Chudzinska and Baralkiewicz 2011), tomato (Bressy et al., 2013), and particularly in tea. The number of studies on the application of this technique to tea has increased in recent years (Chudzinska and Baralkiewicz 2011; Llorent-Martínez et al., 2012; Pilgrim et al., 2010), but these studies only dealt with identifying the geographical origin of tea samples, and not with associating location with the types of tea.
Sample digestion is a critical step in most analytical methods for the routine determination of trace elements in food samples. Many procedures have been developed to shorten analysis time and minimize problems associated with solid sample pretreatment, such as sample contamination and analyte loss (Korn et al., 2008). Digestion with an acid in combination with microwave irradiation has been a widely used method because it improves the efficiency of analysis and reduces or eliminates the risk of sample contamination or analyte loss (Chudzinska and Baralkiewicz 2011; De Blas Bravo et al., 2007; Llorent-Martínez et al., 2011). However, special instruments are required, such as a microwave digestion oven, which is not found in every laboratory. Therefore, the development of a simple digestion method such as using a heating plate is necessary.
In this paper, we first propose a sample pretreatment method for the quantitative analysis of 15 trace elements in tea samples by ICP-MS. Response surface methodology (RSM) is a particular set of mathematical and statistical methods to determine the optimum conditions and to predict targeted responses (Sharafat et al., 2002). To the best of our knowledge, our study is the first to apply RSM to the optimization of digestion conditions and to reveal the relationship among independent variables, such as heating time, temperature, and amount of liquid. Furthermore, we attempted to classify tea samples from China according to their geographical origin and type on the basis of mineral content, and to identify the markers that can be used for the authentication of Chinese tea.
Statistical pattern recognition techniques, such as linear discriminant analysis (LDA), were primarily used for whole data sets in order to identify and classify Chinese tea samples according to their corresponding origin and type. Seven elements (Al, Cr, Mn, Ni, Cu, As, and Pb) were selected because of their typical and representative features in tea and are discussed in detail in this paper.
Samples and their origin A total of 35 samples of Chinese tea harvested in 2011 were purchased from a specific tea store in Hangzhou, China. The sample were wrapped individually and stored at room temperature (20 °C) until use. They were crushed prior to measurement.
According to the zoning of agricultural development in China (Xu et al., 2006), we divided Chinese tea-producing areas into three regions as follows (Fig. S1): (1) South China (SC), including Fujian and Taiwan; (2) East China (EC), including the Middle- Lower Yangtze plains of Jiangsu, Zhejiang, Anhui, Henan and Hunan; and (3) Middle China (MC), including Sichuan and Yunnan. The samples were classified into five groups: OT from SC (11 samples); BT from EC (3 samples); BT from MC (4 samples); GT from EA (15 samples); and GT from MC (2 samples). Table S1 in Supplementary Material shows the specific information obtained by analyzing tea from the different areas of China and the types of tea.
Instruments and reagents A Spectro-MS ICP-MS (Spectro Analytical Instruments, Kleve, Germany) system was used for simultaneous detection of multiple elements: sodium (Na), magnesium (Mg), aluminum (Al), calcium (Ca), vanadium (V), chromium (Cr), manganese (Mn), iron (Fe), nickel (Ni), copper (Cu), zinc (Zn), gallium (Ga), arsenic (As), selenium (Se), rubidium (Rb), strontium (Sr), silver (Ag), cesium (Cs), barium (Ba), lead (Pb), bismuth (Bi), thorium (Th) and uranium (U). The ICP-MS operating conditions are shown in Table S2 in Supplementary Material. A Millipore Milli-Q water purification system (Millipore, Molshem, France) was used for producing Milli-Q water. The mixed internal standard solution multiple-element custom assurance standard “XSTC-331” (Wako, Osaka, Japan) was used for calibration at a concentration of 1000 µg L−1. NIES CRM No. 23 tea leaves II provided by the National Institute for Environmental Studies (NIES, Japan) was used as the certified reference standard.
Instrument performance To validate this analytical method, the instrument's LOD, repeatability, and reproducibility for all the trace elements were investigated. To obtain the LOD for each trace element, a method using the axis cut point of the calibration line was employed (De Blas Bravo et al., 2007). Repeatability and reproducibility were validated by analyzing the standards ten times under repeatable conditions (i.e., performed by the same analyst, using the same calibration, and on the same day) and reproducible conditions (i.e., performed by a different analyst, using a different calibration, and on a different day). The arithmetic mean was then calculated.
Optimized by RSM RSM was used to determine the optimum sample digestion conditions and to explore the relationship among temperature, heating time, and amount of liquid. In order to formulate the equation of the response surface with the three identified significant factors, a Box-Behnken design (BBD) was chosen for the experiment by RSM (Zhang Junwei et al., 2010). BBDs are response surface designs that are based on the construction of a balanced incomplete block design. The target was to create designs with desirable statistical properties but needing only a fraction of the experiments required for a three-level factorial. BBD with three factors was applied using Design-Expert 8.0.3 software (Stat-Ease, Inc., Minneapolis, MN, USA) to obtain a rational set of experiments without any blocking.
Analysis by ICP-MS According to the parameters that were optimized by RSM in our previous studies, 10 ± 0.25 mg of each tea sample was weighed on an electric balance (GH-202, D = 0.01/0.1 mg, AND, Ibaraki, Japan), placed into a tube, and dissolved in 65% HNO3 (Wako, Asaka, Japan; AnalR, sub-boiling quartz still redistilled) and digested using a block heater (DigiPREP CUBE digestion system; SCP Science, Baie D'Urfé, PQ, Canada). The digested solution was transferred into a 50 mL volumetric flask precleaned by soaking for 24 h in 10% nitric acid, washed with Milli-Q water, and air dried upside down. The tube was rinsed several times with Milli-Q water and the washings were also added to the flask. The solution was made up to 50 mL in a volumetric flask using Milli-Q water, and then transferred into a PTFE bottle for ICP-MS.
Statistical analysis LDA was used to establish tea sample groupings. This procedure generated a set of discriminant functions on the basis of the content of trace elements, which verified the contributions of trace elements toward classification. LDA was carried out using the stepwise method by which the model was built step by step. Data were analyzed using SPSS statistical analysis software for Windows (release 12.0.0., SPSS, 2005). The mean concentrations of the studied elements in the samples of different types and origins were tested for significance of difference by one-way analysis of variance (ANOVA). A value of P < 0.05 was considered to indicate a statistically significant difference.
Equipment performance The concentrations of trace elements in 35 tea samples were determined by ICP-MS. A tea standard sample was analyzed to determine repeatability of the method performed ten times. Table S3 in Supplementary Material shows the validation results of the analysis method for trace elements in tea reference material. The relative standard deviations (RSDs %) for the studied elements were found to be < 5%. The LODs calculated as the axis cut point of the calibration line for all the trace elements ranged from 0.000399 µg L−1 (Cs: the lowest) to 3.95 µg L−1 (Ca: the highest).
Analysis of digestibility using manganese (Mn) in tea as an indicator Mn is an essential element for humans and other animals. Tea may be regarded as a major source of dietary Mn. However, it adversely affects the neurological system following its inhalation (Fernández-Cáceres et al., 2001). Because of its impact on human health and its availability, Mn is the best-analyzed element in tea leaves (Karak and Bhagat 2010). As the next step of our study, we employed RSM to determine the optimum conditions for digestion, using Mn as an indicator.
Development of regression model The conditions for digestion were optimized using RSM, which is essentially a statistical method for designing experiments, building models, evaluating the effects of variables, and determining the optimum conditions of variables to predict targeted responses. Table S4 in Supplementary Material shows the levels of variables tested in the Box-Behnken design (BBD). The experimental conditions and the corresponding Mn concentrations are shown in Table 1. The levels and ranges chosen for the factors were obtained from single-factor experiments in previous tests.
| Run | Heating time /h | Heating temperature /°C | Amount of liquid /mL | Mn /g kg−1 |
|---|---|---|---|---|
| 1 | 9 | 140 | 3 | 0.722 |
| 2 | 7 | 100 | 5 | 0.647 |
| 3 | 5 | 100 | 3 | 0.679 |
| 4 | 5 | 140 | 3 | 0.702 |
| 5 | 7 | 140 | 5 | 0.716 |
| 6 | 9 | 100 | 3 | 0.659 |
| 7 | 7 | 100 | 1 | 0.675 |
| 8 | 5 | 120 | 5 | 0.703 |
| 9 | 7 | 120 | 3 | 0.676 |
| 10 | 7 | 120 | 3 | 0.688 |
| 11 | 9 | 120 | 1 | 0.706 |
| 12 | 7 | 120 | 3 | 0.692 |
| 13 | 7 | 120 | 3 | 0.700 |
| 14 | 5 | 120 | 1 | 0.701 |
| 15 | 7 | 140 | 1 | 0.704 |
| 16 | 9 | 120 | 5 | 0.703 |
| 17 | 7 | 120 | 3 | 0.702 |
According to the experimental design, the results were analyzed using Design-Expert 8.0.3 software and the approximation function of Mn concentration is expressed as follows.
 |
CMn is the predicted concentration of Mn. A, B, and C are the heating time, temperature, and amount of liquid, respectively.
The adequacy of the response surface quadratic model was further confirmed by analysis of variance (ANOVA) and on the basis of R2 (coefficient of determination), and the results are presented in Table S5. A given mathematical model can be accepted when its ANOVA has high statistical significance with F-values at the level of confidence of 95% and p-values < 0.05. The test of F-values makes it possible to test the variation of the data from the fitted model (lack of fit). A small p-value results in rejection of the null hypothesis, which means that the factor is significant (Hormozi-Nezhad et al., 2012). A “model” F value of 9.24 implies that the model is significant. Because there is only a 0.39% (model's p value) chance that this result may occur owing to noise, the model is significant. Furthermore, testing the adequacy of the regression model is necessary (Song et al., 2011). The “lack of fit” F value of 0.15 implies that the lack of fit is not significant relative to a pure error. There is a 92.39% chance that a lack of fit p value may occur owing to noise. Therefore, the insignificant lack of fit indicates that the model is adequate.
Interpretation of response surface models The relationship between the responses and the experimental variables was illustrated graphically by plotting response values versus experimental factor values simultaneously. The 3D plots shown in Fig. 1 (A, B, C) can be used to assess the graphical interpretation of interaction terms (Hormozi-Nezhad et al., 2012).

Combined effects of heating duration, amount of acid, and heating temperature on Mn concentration
According to Fig. 1A, the concentration of Mn could not be increased significantly by extending heating time at low heating temperatures. However, when temperatures as high as 140 °C were employed, the concentration of Mn in the analyte was increased significantly by extending heating time. A high heating temperature induced an oxidative reaction (Araújo et al., 2002) even for a short heating time. According to Fig. 1B, the concentration of Mn could be reduced when both the amount of liquid and heating time were at intermediate levels. Fig. 1C shows that when both the amount of liquid and the heating temperature were high, the concentration of Mn could be increased. On the other hand, when the amount of liquid was small, the concentration of Mn was increased by increasing heating temperature. This result demonstrated that a small amount of nitric acid is sufficient for sample digestion. This agrees with the concept that ideal digestion should lead to the complete decomposition of an organic material using a minimal amount of acid (Chen et al., 2008). The main aim of RSM was to optimize the yields using the most favorable response. By RSM, we found that the optimum values of the factors were a heating time of 6.1 h, a temperature of 132.3 °C, and a liquid volume of 1.6 mL as the final optimum conditions. The optimum predicted concentration of Mn was 0.698 g kg−1. However, it was essential to evaluate the predicted value of the response under the optimum conditions. Three replications of the experiment conducted under the optimum conditions yielded an average Mn concentration of 0.702 ± 0.003 g kg−1, which was in good agreement with the recommended value of 0.705 g kg−1.
Discrimination and classification of teas according to their geographical origin and type Trace elements in tea vary in concentration. The uptake of metals by tea trees is affected by various factors, including the type of plant, nature of the soil, climate, and agricultural practices (Tokalıoğlu 2012). The goal of supervised pattern recognition techniques is to create classification and discrimination rules. A training set with known class memberships is used to calculate a classifier (VONČINA 2009). LDA was used to construct models for discrimination of tea based on the concentrations of Na, Mg, Al, Ca, V, Cr, Mn, Fe, Ni, Cu, Zn, Ga, As, Se, Rb, Sr, Ag, Cs, Ba, Pb, Bi, Th, and U, and according to their geographical origin and type.
On the basis of the results of the analysis, Ni and Mn concentrations were found to be the most important variables in the discrimination of tea samples. Fig. 2 shows the results of LDA. The scatter plot of the samples against two first discrimination functions (function 1 vs. function 2) indicates that five groups of tea are separated. Using LDA, we found that the recognition capability for five groups of tea was highly satisfactory; 100% of the original groups were correctly classified. All the samples from the training and test sets were classified correctly. Analysis revealed strong discrimination among different plant types and various tea-producing regions. Therefore, these results showed that multi-element ICP-MS and a chemometrical approach is a robust, reliable, rapid method for discrimination and classification of tea samples on the basis of their type and also geographical origin.

Scatter plots of the two discriminant functions showing separation of Chinese teas according to growing region and type. The samples were divided into five groups: Oolong tea from south China (OTSC); Black tea from east China (BTEC); Black tea from middle China (BTMC); Green tea from east China (BTEC); Green tea from middle China (BTEC);
Concentrations of selected elements in Chinese tea In this study, a detailed analysis of the selected seven trace elements (Al, Cr, Mn, Ni, Cu, As and Pb), which are the typical and representative elements in tea, was carried out with reference to a paper (McKenzie et al., 2010). The mean concentrations of trace elements in the analyzed tea samples from different areas of China and of different types are shown in Table 2.
| Type | Area | No.a | Concentrations (mg kg−1) (Mean ± S.D)b | ||||||
|---|---|---|---|---|---|---|---|---|---|
| Al | Cr | Mn | Ni | Cu | As | Pb | |||
| OT | SC | 11 | 1394.23 ± 383.06 | 5.37 ± 8.34 | 1251.55 ± 376.89 | 0.95 ± 1.69 | 0.31 ± 1.03 | 0.75 ± 0.36 | 2.17 ± 1.08 |
| BT | EC | 3 | 851.23 ± 147.32 | 7.47 ± 2.93 | 967.89 ± 381.00 | 1.88 ± 1.68 | 22.12 ± 6.19 | 0.63 ± 0.46 | 2.05 ± 0.38 |
| BT | MC | 4 | 944.45 ± 192.41 | 5.30 ± 4.28 | 1038.90 ± 529.35 | 5.03 ± 1.59 | 8.50 ± 1.64 | 1.20 ± 0.57 | 1.58 ± 0.52 |
| GT | EC | 15 | 564.82 ± 302.13 | 3.79 ± 2.69 | 1038.00 ± 474.12 | 10.37 ± 4.50 | 2.40 ± 2.92 | 0.70 ± 0.31 | 1.92 ± 0.68 |
| GT | MC | 2 | 445.93 ± 296.99 | 5.43 ± 3.60 | 808.20 ± 253.51 | 13.78 ± 11.86 | 3.77 ± 5.33 | 0.60 ± 0.23 | 2.05 ± 1.07 |
| Mean concentration ± S.Db | 840.13 ± 370.55 | 5.47 ± 1.31 | 1020.91 ± 159.58 | 6.40 ± 5.53 | 7.40 ± 8.75 | 0.78 ± 0.24 | 1.95 ± 0 .23 | ||
a Number of samples
b The quoted SDs were obtained on the basis of range of elemental concentrations determined in different tea samples.
Aluminum (Al) It has been reported that Alzheimer's disease (AD) is associated with Al in barely (Deng et al., 2000). The Al content in tea was found to range from 445.93 mg kg−1 in GTEC to 1394.23 mg kg−1 in OTEC. OT showed the highest concentration of Al with a mean of 1394.23 mg kg−1, which is significantly higher than that in the other tea groups (P value < 0.05). This observation can be explained by the fact that most of the oolong tea buds have a longer growth time and the leaves are much older than those of the other types of tea. Chenery (1955) suggested that the older tea leaves contain higher concentrations of Al than younger leaves. On the other hand, Matsumoto et al. (1996) reported that tea is one of the few plants that accumulates Al. Al salts present in tea garden soils dissociate at pH < 5.5 and produce Al3+ in soil solution and form complexes with phosphate (AlPx) at the root surface of tea (Fung and Wong 2004). From our results, both EC and SC tea (compared with black tea from different areas and green tea from different areas) showed no significant differences in Al concentration. This finding suggests that the Al content and pH of tea garden soil are not significantly different between EC and SC.
Chromium (Cr) Cr, which is an essential trace element for both humans and animals, is found in the environment, including air, water, and soil. Cr in tea is toxic and carcinogenic upon uptake. However, Sofuoglu and Kavcar (2008) concluded that according to a populations' noncarcinogenic risk distribution, the risk of cancer due to black tea consumption is not significant for Cr. In our experiment, the mean Cr content in all tea sample groups was in the 3.79 – 7.47 mg kg−1 range, with the lowest and highest content of Cr found in GT and BT samples collected from EC, respectively (Table 2). Most of the BT samples have a higher Cr content. The results were almost the same as those obtained by Seenivasan et al. (2008), who revealed that the Cr content of marketable black tea is higher than those of other tea types. They also suggested that not only geographical factors but also element content, mainly Cr content, in tea correlate with the sharpening of crush, tear, and curl rollers used for manufacturing. Gardea-Torresdey et al. (2004) reported that the impact of Cr contamination on the physiology of plants depends on the metal speciation in soil and plants, which is responsible for Cr mobilization and subsequent uptake in the plant system. This could explain the difference in Cr concentration in the same tea type between EC and MC.
Manganese (Mn) Because of its biochemical importance and high amount in tea, Mn has been the most analyzed element in tea by researchers from various countries. The Mn content in all Chinese tea groups varied between 808.2 and 1251.55 mg kg−1, with the OT group showing the highest concentration of Mn (1251.55 mg kg−1). These results were similar to those obtained by Chen et al. (2009); the levels of Mn in eight different tea cultivars grown at the Zhejiang University Tea Research Institute ranged from 950.1 to 1224.2 mg kg−1. Taken together, it is concluded that the variation of Mn content in tea leaves among cultivars is mainly attributed to cultivar variation (Karak and Bhagat 2010). Furthermore, Mn concentrations were found to be between 148 and 1595.4 mg kg−1 (average 824.8 mg kg−1) in 46 commercial tea samples in Spain originating from China, Japan, India, Kenya, and Sri Lanka (Fernández-Cáceres et al., 2001).
Nickel (Ni) Ni is essential for plant growth at low concentrations. Nevertheless, beyond a certain threshold concentration, this element becomes toxic for most plant species (Gardea-Torresdey et al., 2004). Ni is widely used in the industrial production of nickel compounds and alloys, which are used in instruments for tea manufacture (Kasprzak 2003). The average concentration of Ni in Chinese tea was 6.40 mg kg−1. GT from EC and MC showed the highest concentrations of 10.37 and 13.78 mg kg−1, respectively. On the other hand, OT from SC showed the lowest Ni concentration of 0.95 mg kg−1, and BT from EC and MC showed moderate concentrations of 5.03 and 1.88 mg kg−1, respectively. These findings indicate that one of the sources of Ni in tea is the machining process. The findings also revealed that Ni content in BT from MC was significantly higher (P < 0.05) than that from EC; Ni concentration in GT also showed the same tendency. This suggests that the geographical origin of tea underlies the differences in Ni content. It also suggests that the difference in Ni concentration in the same type of tea between EC and MC is mainly due to the foliar and soil applications of high Ni-content fertilizers and micronutrient supplements.
Copper (Cu) Copper (Cu) is an essential micronutrient for plants and humans, but it is also highly phytotoxic at high concentrations. Overconsumption of Cu from beverages is detrimental to human health as well; therefore, Cu in tea should be analyzed as a heavy metal impurity. The BT from EC and MC showed high mean Cu concentrations of 22.12 and 8.5 mg kg−1, respectively. Generally, the source of Cu contamination is mainly the rolling machines with copper boards used at the twisting stage, and the contamination from these machines accounts for almost 90% of total copper contamination.
It was found that the Cu content of BT from EC was significantly higher (P < 0.05) than that from MC. Excluding manufacturing equipment as a source of Cu contamination, this difference might be explained by the differences in Cu concentration in air and soil. This indicates that the element concentrations in tea can be used to classify tea samples according to their geographical origin.
Arsenic (As) Arsenic is mutagenic, carcinogenic, and highly toxic. The concentration of As in tea leaves mainly depended on the tea cultivar and the As concentration in soil. The highest As content was found in BT from EC (1.20 mg kg−1) among all the tea sample groups; but this difference did not reach statistical significance (P > 0.05). Han et al. (2005) reported that the As concentration in tea was below the allowable limit of 1.68 mg kg−1, which is also in agreement with our results. These findings suggest that the soil around EC and MC is not polluted by As.
Lead (Pb) Pb was identified as one of the most commonly occurring contaminants in the environment (Hafen and Brinkmann 1996). Pb concentration in commercial tea leaves has been a concern to both consumers and producers. Analysis of Chinese tea samples indicated that the mean Pb concentration is in the range between 1.58 mg kg−1 for BT from EC and 2.17 mg kg−1 for OT from EC. OT from SC showed the highest Pb concentration (2.17 mg kg−1). The reason for these differences was explained by Natesan and Ranganathan (1990), who reported that older tea leaves tend to contain higher concentrations of Pb than younger leaves.
Allowable limits for Pb have been established by the World Health Organization (WHO) (2003). The value is 5 mg kg−1 for Chinese tea. Our results indicated that the concentration of Pb in all Chinese tea samples was below the limit value, though there were significant differences among tea groups.
Plants can take up Pb from the soil, and under certain conditions Pb may accumulate at high concentrations in the leaves and other edible parts of the plant. For example, tea plants can take up Pb from the soil, and inevitably, a portion will be transported to the tea leaves. A comparison of different areas showed no significant difference in Pb content between EC and MC for the same tea type. It was revealed that the Pb concentrations in the soil of EC and MC were similar.
In this paper, we presented the results of our analysis of 23 elements in Chinese tea by ICP-MS in order to identify the authenticity markers, particularly in the context of geographical origin and tea type. The trace elements in 35 tea samples from China were analyzed by ICP-MS.
(1) We were the first to use RSM to reveal the optimum conditions for digestion, as follows: heating time of 6.1 h, heating temperature of 132.3 °C, and liquid amount of 1.6 mL.
(2) LDA showed a highly satisfactory recognition capability for five classes of tea; 100% of the original groups were correctly classified.
(3) The OT group showed higher concentrations of Al, Mn, and Pb than the other groups, suggesting that most of the oolong tea buds had a longer growth time and the leaves were much older than the other types of tea.
(4) The methods used for processing as well as the storage methods for teas used could be contributory factors to the variations of Cr, Ni, and Cu contents.
(5) Ni mainly originates from the foliar and soil applications of low-quality fertilizers and micronutrients.
However, the number of samples used in this study is insufficient for establishing genuine chemometrics models of tea. A large number of samples will be collected for further investigation. The influence of factors such as annual variation and cultivar also need further exploration.
Acknowledgments Q. Han acknowledges the Asian Human Resources Fund (International Student Special Selection at Tokyo Metropolitan University) from the Tokyo Metropolitan Government. T. Fujino acknowledges a Grant-in-Aid for Scientific Research (C) (No. 24550030) from JSPS and a Grant-in-Aid for Scientific Research on Priority Area (477) from MEXT. The authors extend their sincere appreciation to Mr. Jiawei Xu for checking the English in the manuscript.
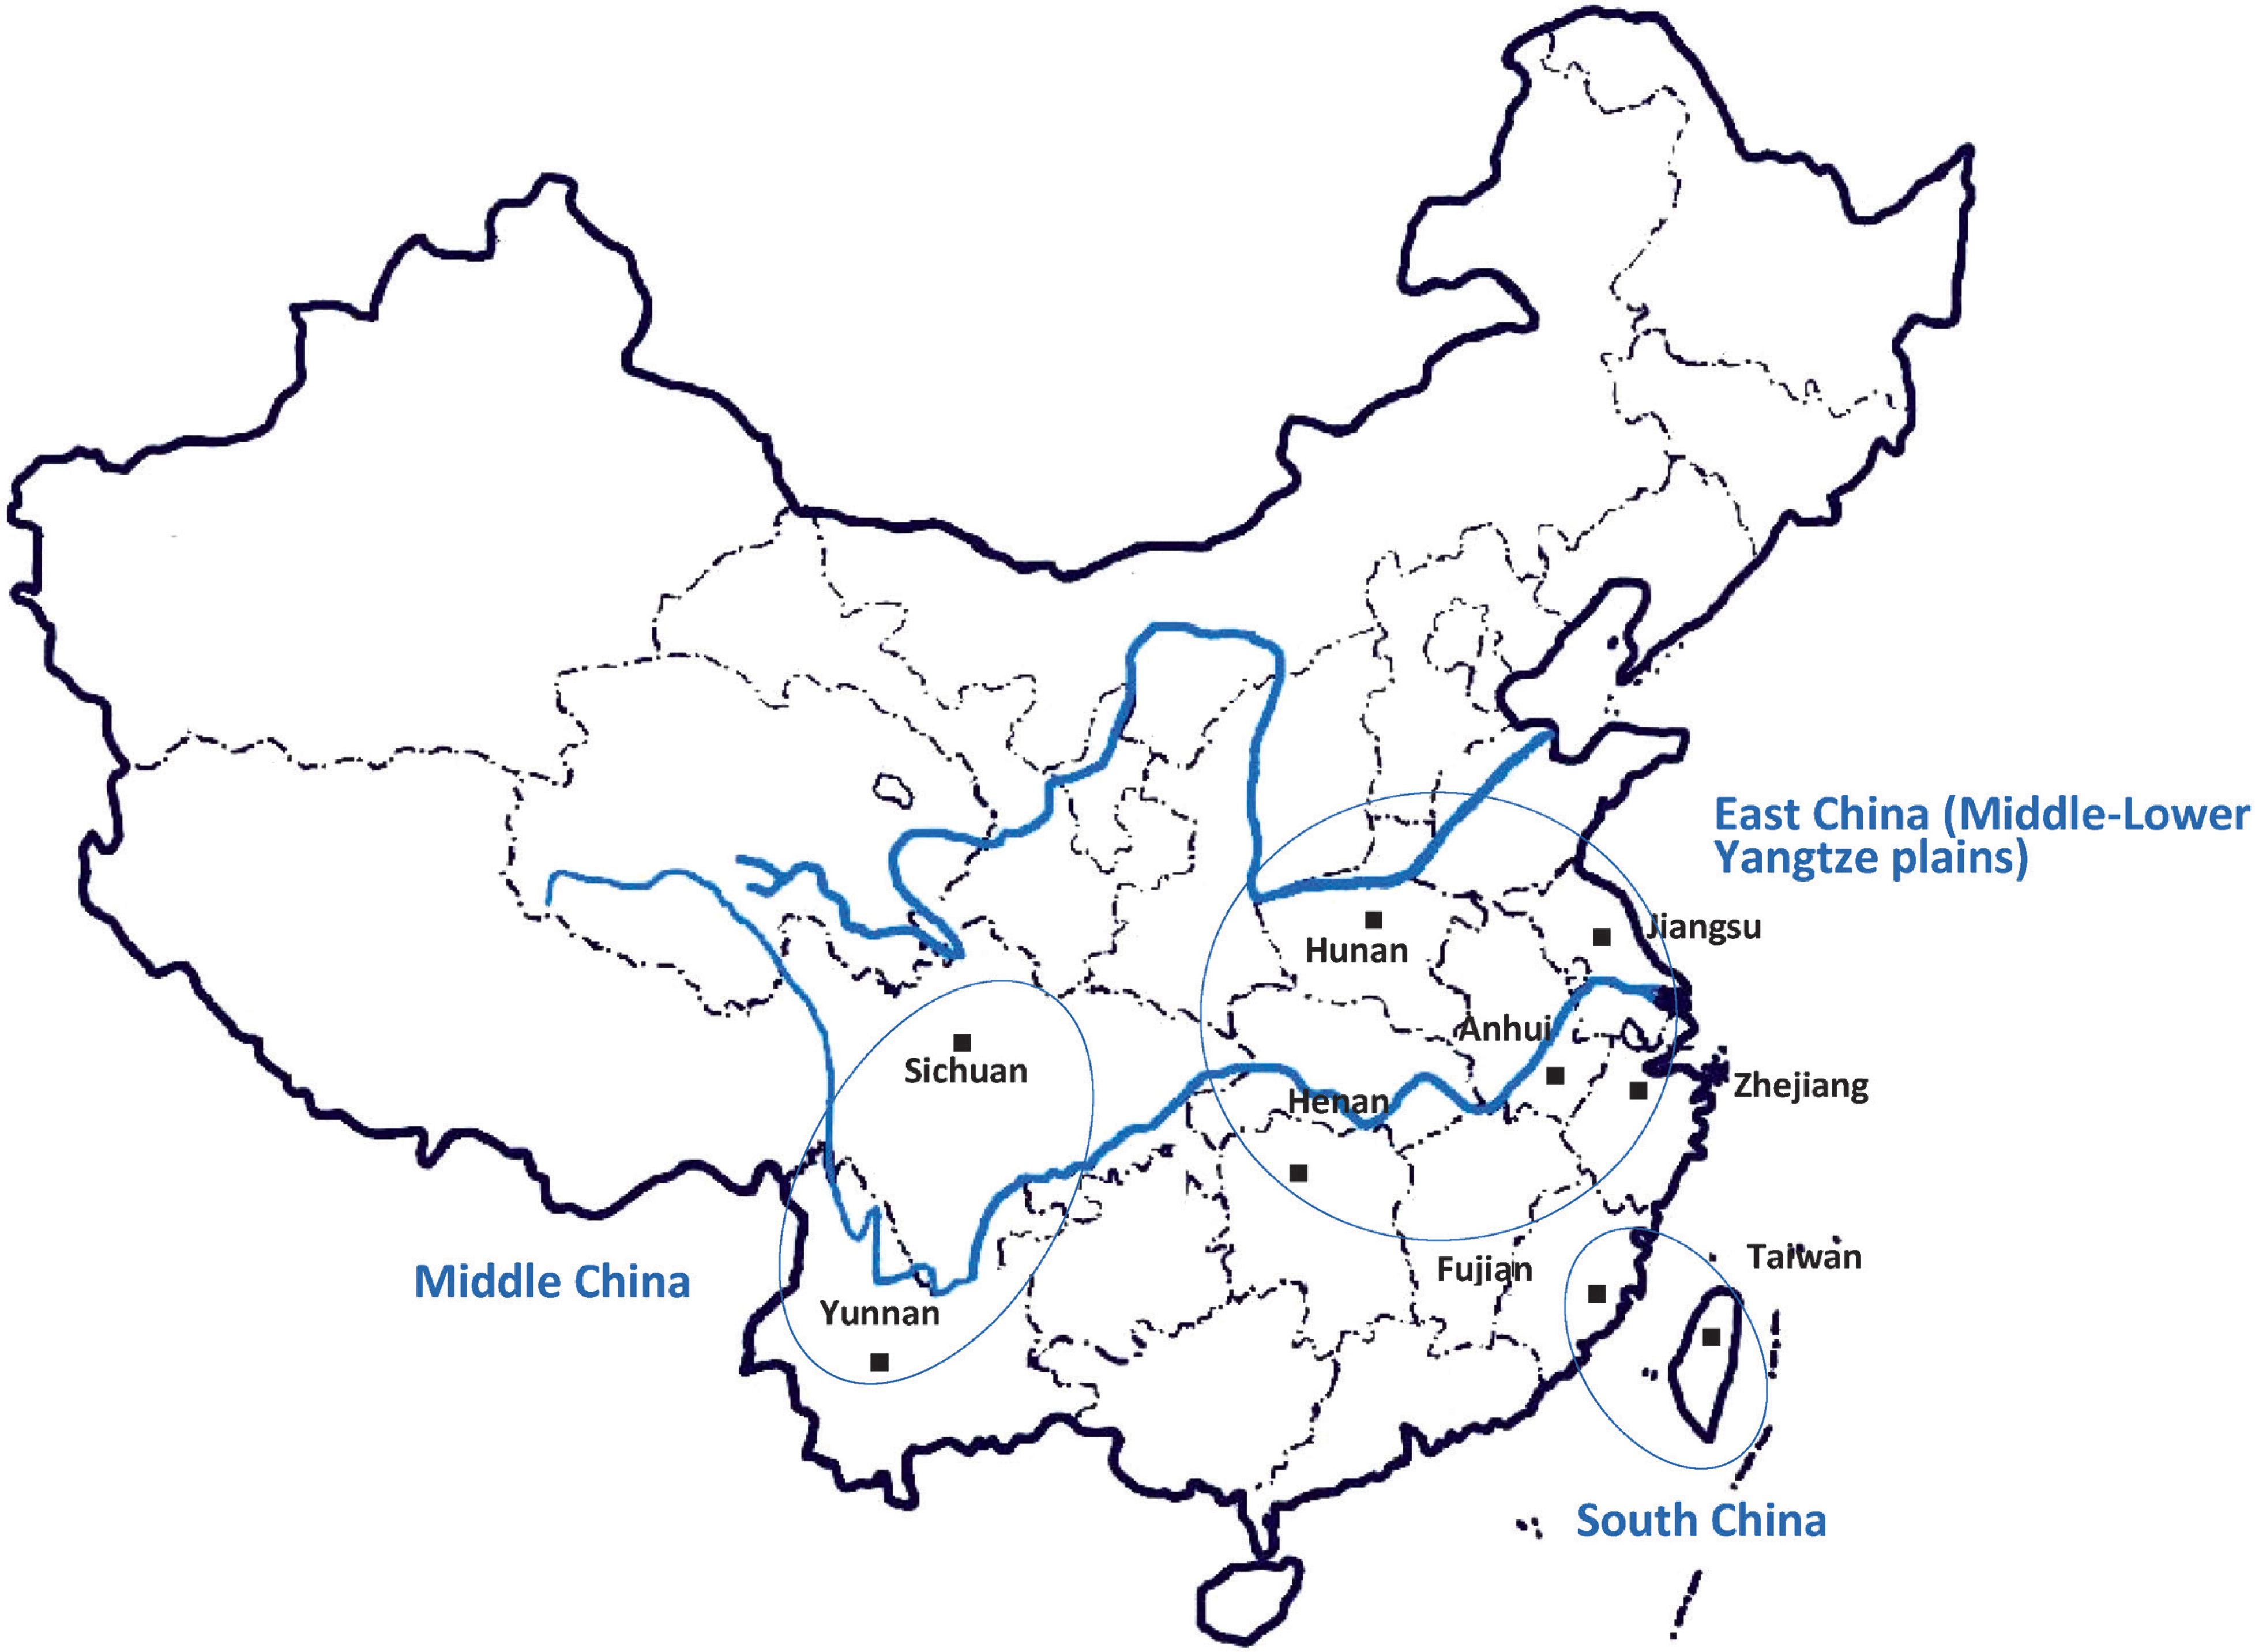
Map of tea sampling sites in China
| Tea type | Location number | Location in China | Province | Special name in Chinaa |
|---|---|---|---|---|
| Oolong tea | 1 | South China | Fujian | Tianguanyin T078 |
| Oolong tea | 2 | South China | Fujian | Tianguanyin T088 |
| Oolong tea | 3 | South China | Fujian | Tianguanyin charcoal baked II |
| Oolong tea | 4 | South China | Fujian | Tianguanyin charcoal baked V |
| Oolong tea | 5 | South China | Fujian | Tianguanyin T048 |
| Oolong tea | 6 | South China | Fujian | Tianguanyin T058 |
| Oolong tea | 7 | South China | Fujian | Tianguanyin T068 |
| Oolong tea | 8 | South China | Fujian | Tianguanyin Haoyundao |
| Oolong tea | 9 | South China | Fujian | Tianguanyin |
| Oolong tea | 10 | South China | Taiwan | Ginseng oolong first grade |
| Oolong tea | 11 | South China | Taiwan | Ginseng oolong special grade |
| Black tea | 12 | East China | Anhui | Dengmen black tea special grade |
| Black tea | 13 | East China | Zhejiang | Jiuquhongmei special grade |
| Black tea | 14 | East China | Zhejiang | Kongfu black tea |
| Black tea | 15 | Middle China | Yunnan | Puer black tea special grade |
| Black tea | 16 | Middle China | Yunnan | Puer black tea jinhao |
| Black tea | 17 | Middle China | Yunnan | Puer black tea first grade (mature) |
| Black tea | 18 | Middle China | Yunnan | Puer black tea old tree |
| Green tea | 19 | East China | Anhui | Huangshan maofen national present grade |
| Green tea | 20 | East China | Anhui | Huangshan maofen first grade |
| Green tea | 21 | East China | Anhui | Huangshan maofen special grade |
| Green tea | 22 | East China | Anhui | Huangshan maofen first grade |
| Green tea | 23 | East China | Anhui | Liuanguapian first grade |
| Green tea | 24 | East China | Zhejiang | Anji white tea special grade |
| Green tea | 25 | East China | Zhejiang | Anji white tea first grade |
| Green tea | 26 | East China | Zhejiang | Longjing tea special grade |
| Green tea | 27 | East China | Zhejiang | Longjing tea first grade |
| Green tea | 28 | East China | Zhejiang | Kaihualongding |
| Green tea | 29 | East China | Jiangsu | Nanjing yuhua |
| Green tea | 30 | East China | Jiangsu | Biluochun |
| Green tea | 31 | East China | Jiangsu | Nanshanshoumei |
| Green tea | 32 | East China | Henan | Xinyangmaojian |
| Green tea | 33 | East China | Hunan | Junshanyinzhen |
| Green tea | 34 | Middle China | Sichuan | Qingshanlvshan |
| Green tea | 35 | Middle China | Sichuan | Zhuyeqing |
a: Special name in China is the traditional Chinese name; also includes information on the different grades . Grade A tea is higher quality than grade B.
| Instrument | SPECTRO MS |
|---|---|
| (SPECTRO Analytical Instruments, Germany) | |
| Spray chamber | Cyclonic |
| Nebulizer | Meinhard |
| Interface | Pt cones |
| Mass analyzer | Quadrupole |
| RF power/W | 1350 |
| Pump speed/Rpm | 23 |
| Ar gas flow rates | |
| Coolant flow/L min−1 | 12 |
| Auxiliary flow/L min−1 | 1.3 |
| Nebulizer flow/L min−1 | 0.94 |
| Pre-flush time/min−1 | 1 |
| Measured parameter | |
| Total time/s | 10 |
| Base interval/ms | 20 |
| Internal standard | Rh |
| Number of replicates | 3 |
| Trace element analyzed | Na, Mg, Al, Ca, V, Cr, Mn, Fe, Ni, Cu, Zn, Ga, As, Se, Rb, Sr, Ag, Cs, Ba, Pb, Bi, Th, and U |
| Element | Measure | Correlation | LOD/µg L−1 | Precision | |
|---|---|---|---|---|---|
| range/µg L−1 | coefficients | Repeatability /% | Intermediate precision /% | ||
| Na | 0–500 | 0.99997 | 0.0721 | 1.11 | 2.12 |
| Mg | 10–500 | 0.99996 | 0.153 | 0.75 | 1.23 |
| Al | 0–100 | 0.99949 | 0.24 | 2.23 | 6.35 |
| Ca | 10–500 | 0.9989 | 3.95 | 1.25 | 7.86 |
| V | 0–100 | 0.99993 | 0.0122 | 2.08 | 5.23 |
| Cr | 0–100 | 0.99994 | 0.0248 | 2.21 | 13.15 |
| Mn | 0–500 | 0.99997 | 0.0217 | 2.37 | 3.21 |
| Fe | 10–500 | 0.9994 | 0.206 | 0.80 | 3.96 |
| Co | 0–100 | 0.99995 | 0.00438 | 1.49 | 3.21 |
| Ni | 0–100 | 0.99999 | 0.324 | 0.80 | 2.45 |
| Cu | 0–100 | 0.99957 | 0.00795 | 0.40 | 1.01 |
| Zn | 0–100 | 0.9994 | 0.015 | 1.32 | 1.38 |
| Ga | 0–100 | 0.99977 | 0.0144 | 0.80 | 3.23 |
| As | 0–25 | 0.99998 | 0.0149 | 0.98 | 1.35 |
| Se | 0–100 | 0.99999 | 0.0457 | 0.12 | 0.38 |
| Rb | 0–100 | 0.99994 | 0.00592 | 1.11 | 3.21 |
| Sr | 0–25 | 0.99998 | 0.0411 | 0.23 | 0.48 |
| Ag | 0–25 | 0.99993 | 0.0128 | 0.58 | 1.32 |
| Cs | 0–500 | 0.99985 | 0.000399 | 0.80 | 2.55 |
| Ba | 0–500 | 0.99999 | 0.0509 | 0.62 | 1.35 |
| Pb | 0–500 | 0.99994 | 0.0220 | 1.02 | 5.35 |
| Bi | 0–25 | 0.9984 | 0.0345 | 1.25 | 1.98 |
| Th | 0–1000 | 0.99997 | 0.0132 | 0.78 | 5.23 |
| U | 0–100 | 0.99999 | 0.0058 | 1.02 | 2.38 |
| Level | Heating time/h | Heating temperature/°C | Amount of liquid /mL |
|---|---|---|---|
| −1 | 5 | 100 | 1 |
| 0 | 7 | 120 | 3 |
| 1 | 9 | 140 | 5 |
| Source | Sum of Squares | Mean Square | F Value | p-value Prob > F | |
|---|---|---|---|---|---|
| Model | 5.755 × 10⁻³ | 6.395 × 10⁻⁴ | 9.24 | 0.0039 | Significant |
| A-Heating time | 3.125 × 10⁻⁶ | 3.125 × 10⁻⁶ | 0.045 | 0.8378 | |
| B-Heating temperature | 4.232 × 10⁻³ | 4.232 × 10⁻³ | 61.15 | 0.0001 | |
| C-Amount of liquid | 3.613 × 10⁻⁵ | 3.613 × 10⁻⁵ | 0.52 | 0.4934 | |
| AB | 4.000 × 10⁻⁴ | 4.000 × 10⁻⁴ | 5.78 | 0.0472 | |
| AC | 6.250 × 10⁻⁶ | 6.250 × 10⁻⁶ | 0.090 | 0.7725 | |
| BC | 4.000 × 10⁻⁴ | 4.000 × 10⁻⁴ | 5.78 | 0.0472 | |
| A2 | 2.918 × 10⁻⁴ | 2.918 × 10⁻⁴ | 4.22 | 0.0791 | |
| B2 | 3.740 × 10⁻⁴ | 3.740 × 10⁻⁴ | 5.40 | 0.0530 | |
| C2 | 4.655 × 10⁻⁵ | 4.655 × 10⁻⁵ | 0.67 | 0.4392 | |
| Residue | 4.844 × 10⁻⁴ | 6.921 × 10⁻⁵ | |||
| Lack of fit | 4.925 × 10⁻⁵ | 1.642 × 10⁻⁵ | 0.15 | 0.9239 | Not significant |
| Pure error | 4.352 × 10⁻⁴ | 1.088 × 10⁻⁴ | |||
| Cor total | 6.240 × 10⁻³ |