Abstract
This study aimed to quantify effects of food mouthful size on eating effort while masticating solid foods represented by five hydrocolloid gels varying in texture by means of electromyography (EMG). Eleven subjects ate 3 (S) and 6 (L) mL mouthfuls of five gel samples in their normal way without any designated conditions. EMG activities from both masseter muscles, as jaw-closing muscles, and the suprahyoid muscles, as the jaw-opening muscles, were recorded during free eating. Differences in EMG variables were analyzed separately before the first swallow and during the entire oral processing until the last swallow. When food size was halved from L to S, entire time of oral processing, the number of chews, and the number of swallows were approximately 0.7 times more than those for L gels. The sum of muscle activities was determined by both the jaw-closing and jaw-opening muscles, and the relative values for S gels were about 0.8 of the L gels. EMG variables per chewing motion were not significantly different between S and L gels. Those observations were found to be similar for the five different gel types. These results suggest that the mastication effort can be estimated quantitatively for hydrogels with wide range of texture if a small enough mouthful size is consumed. The mastication effort for L gels was 1.4 times greater than that of S gels; however, it was never greater than 2 times the S gels.
Introduction
Food texture is perceived during oral processing and can change with every chew (Chen, 2009). In the mouth, food texture dynamically changes by structural breakdown during oral processing, incorporation of saliva, and melting at oral temperature. Wilkinson et al. (2000) stated that texture of food was studied by three different approaches: the instrumental measurements based on physics and/or chemistry, human physiological measurements, and sensory evaluation based on psychology. The physiological methods have been recently introduced in food texture studies and are expected to integrate the physicochemical and psychophysical approaches (Boyar and Kilcast, 1986; Wilkinson et al., 2000; Kohyama, 2005; Chen, 2009; Nishinari 2009; van der Bilt, 2009; Foegeding et al., 2011). Among the physiological methods, electromyography (EMG) using surface electrodes have been widely adopted while subjects eat a fixed mouthful of food. Literature revealed that the amplitude of EMG activity of the jaw-closing muscles, such as the masseter muscles, correlate with food hardness (González et al., 2001; Kemsley et al., 2003; Woda et al., 2006; Foegeding et al., 2010, 2011; Çakir et al., 2012; Espinosa and Chen, 2012). We can evaluate the mastication effort using an indicator, the total muscle activity of both masseter muscles until swallowing (Kohyama et al., 2005b). Mastication of more adhesive foods such as caramels and rice cakes (mochi) leads to greater activity of the suprahyoid muscles, which act in the jaw-opening phase (Sakamoto et al., 1989; Kohyama et al., 1998, 2005b, 2007b; Çakir et al., 2012). Soft foodstuffs such as jellies are eaten through compression between the tongue and the hard palate without chewing with the back teeth, where the masseter activity is very weak, while the suprahyoid activity is observed more significantly (Nakazawa and Togashi, 2000; Ishihara et al., 2011). The suprahyoid muscles also coordinate with tongue movements, involving pressing the tongue against the hard palate, protrusion of the tongue, and transportation of bolus at the beginning or oropharyngeal phase of swallowing (Shiozawa et al., 1999a; Taniguchi et al., 2008; Ishihara et al., 2011; Takahashi et al., 2011). Although the suprahyoid muscles are active in swallowing water (Taniguchi et al., 2008), the EMG activity of the suprahyoid muscles becomes greater for swallowing semi-solid or soft gels (Ishihara et al., 2011). These findings suggest that we can estimate swallowing effort using the suprahyoid EMG.
Although mechanical properties such as elastic modulus and viscosity coefficient as physical quantities do not depend on the mass of samples, the EMG variables depend not only on the mechanical properties, but also on the amount and geometry of food samples (Nakazawa and Togashi, 2000; Foegeding et al., 2011). A larger size of sample often results in a longer period of oral processing, larger number of chewing, and higher EMG amplitude (Dantas and Dodds, 1990; Palmer et al., 1999; Miyawaki et al., 2000; Kohyama et al., 2005b, 2007a, b; Woda et al., 2006; Miyaoka et al., 2010; Ashida et al., 2010). We compared EMG variables during free eating of rice gruel (5 g and 10 g), and found that 10 g gruel exhibited significantly higher EMG variables corresponding to mastication time such as number of chews, chewing time, and total muscle activity than 5 g. However there were no significant differences between 5 g and 10 g in EMG variables per chew such as EMG amplitude, duration, muscle activity or muscle work, and chewing cycle (Kohyama and Nakayama, 2004). Similarly for cooked rice, the total muscle activities of 10 g were 1.5 times greater than those of 5 g (Shiozawa et al., 1995), and those of double size of free eating mouthful resulted in 1.6 times of normal mouthful (Inoko et al., 2013). Rice cake at 3 g and 9 g were compared, and the larger sample showed greater EMG amplitude and muscle activity per chew of masseter muscles as well as mastication time, but there was no significant size effect on swallowing behavior (Kohyama et al., 2007b).
Previous research have not quantitatively discussed effects of sample size, although they stated the greater mass or volume of food, the longer the chewing times, the greater the number of chews, and greater effort in mastication. This study aims to quantitatively analyze the effects of food size on EMG variables. In a preceding study, we evaluated texture attributes (firmness, cutting effort, elasticity, extensibility, adhesiveness, and melting rate in the mouth) and eating difficulty of twenty kinds of hydrocolloid gels varying in texture from a semi- and soft-solid food model using healthy adults as panelists in order to gather basic data for developing a mechanical test to evaluate eating difficulty (Hayakawa et al., 2014). Principal component analysis aptly characterized the texture attributes of sample gels on the resulting scatter diagram with the axes of first principal component (PC1) corresponding to resistance to fracture and second principal component (PC2) regarding stickiness and flexibility. The two principal components were critical determinants of eating difficulty of gel type foods. Here, we selected five gels out of the twenty as representatives of the cluster based on sensory attributes of texture (Hayakawa et al., 2014). EMG from both masseters, as jaw-closing muscles, and the suprahyoid muscles, as the jaw-opening muscles, were analyzed in a previous study (Kohyama et al., 2014; Nakatsu et al., 2014). The gel size was determined as small (approximately 3 mL) and large (approximately 6 mL) as tested swallowing behavior (Gao et al., 2013). Understanding the effects of serving size as well as mechanical properties of foods on eating difficulty will be useful for preparing food for the elderly.
Materials and Methods
Sample gels Five kinds of hydrocolloid gels (#4, #6, #12, #14, and #16) with a wide range of food textures were used. Table 1 shows the ingredients, mechanical properties, and sensory texture characteristics of the five samples (Hayakawa et al., 2014). The five gels were selected from twenty hydrocolloid gels after a discussion with gel texture experts to represent each cluster obtained by cluster analysis of sensory scores of six textural attributes, i.e., firmness, cutting effort, elasticity, extensibility, adhesiveness, and oral melting rate (Kohyama et al., 2014).
Table 1.
Characteristics of sample gels.
| Sample |
#4 |
#6 |
#12 |
#14 |
#16 |
| Ingredienta (%w/w) |
κ-CAR 1.0 + Locust bean gum 1.0 |
ι-CAR 3.0 |
Locust bean gum 0.5 + Xanthan gum 0.5 |
Gelatin 3.0 |
Agar 1.0 |
| Puncture testb |
|
|
|
|
|
| Fracture force (N) |
1.39 |
0.11 |
0.68 |
0.13 |
0.68 |
| Fracture distance (mm) |
7.40 |
5.49 |
9.01 |
6.15 |
2.65 |
| Sensory evaluationc |
|
|
|
|
|
| Eating difficulty |
74 |
56 |
65 |
13 |
30 |
| Firmness |
85 |
24 |
27 |
12 |
70 |
| Cutting-effort |
86 |
18 |
57 |
8 |
36 |
| Elasticity |
83 |
42 |
52 |
18 |
26 |
| Extensibility |
46 |
37 |
82 |
13 |
8 |
| Adhesiveness |
17 |
77 |
35 |
15 |
9 |
| Melting rate in the mouth |
9 |
39 |
29 |
90 |
47 |
| Principal component scoresd |
|
|
|
|
|
| 1st PC (58.6%) |
3.91 |
−0.09 |
1.89 |
−2.15 |
0.17 |
| 2nd PC (26.9%) |
−0.95 |
1.80 |
1.32 |
−0.49 |
−1.71 |
a, Sucralose sweetener (0.1%w/w) was added to mask flavor and all ingredients were food grade provided by San-Ei Gen, F. F. I., Co. Inc. CAR, carrageenan.
b, Mean of triplicates at 1.0 mm/s and 20°C.
c, Mean scores assigned by 12 trained panelists are converted into 0 (easiest) and 100 (most difficult).
d, Scores of the first and second principal components of six textural attributes (firmness, cutting-effort, elasticity, extensibility, adhesiveness, and melting rate in the mouth).
EMG measurements were conducted at 20 ± 2°C consistent with the mechanical testing and sensory evaluation conditions (Kohyama et al., 2014). Five kinds of gels were prepared using the same ingredients but on a different day from the previous sensory study. The gels' mechanical properties were confirmed to be similar to those of previous preparations using the puncture test. The sample gels were prepared using glass molds with an inner diameter of 20 mm and a height of 10 mm (S-size) or 20 mm (L-size), and stored in a refrigerator. Specimens were placed in a test room maintained at 20°C for 1 h before EMG recording.
EMG measurement was conducted as reported (Kohyama et al., 2014). The study design was approved by the National Food Research Institute Ethics Committee. Eleven volunteers (4 men and 7 women, mean age 40 years old) participated in this study. They were free from masticatory or swallowing dysfunction, and none wore removable dental prostheses. To evaluate eating difficulty using EMG data, subjects were asked to eat normally, which was the most effective mastication since imposed eating results in increased muscle work (Mioche et al. 1999; Kohyama et al., 2010). Five kinds of gels with L- or S- size were served randomly to the subjects at least twice using a plastic spoon.
EMG activities were recorded using bipolar surface electrodes (EL503, Biopac Systems Inc., Goleta, CA, USA) from the left and right masseter muscles (LM and RM), as typical jaw-closing muscles, and from the suprahyoid muscles (SH), which are active in jaw opening and tongue movement. After filtering (10–500 Hz), removal of 50 Hz noise from the power supply and amplification to 1,000 times the original level using three EMG 100C amplifiers (Biopac Systems Inc.), the EMG signals were saved on a PC using a MP-150 system (Biopac Systems Inc.) at 1,000 Hz. The subject pressed a button as they started to chew and at every swallow (Fig. 1). A longer signal was given when the subject finished eating.
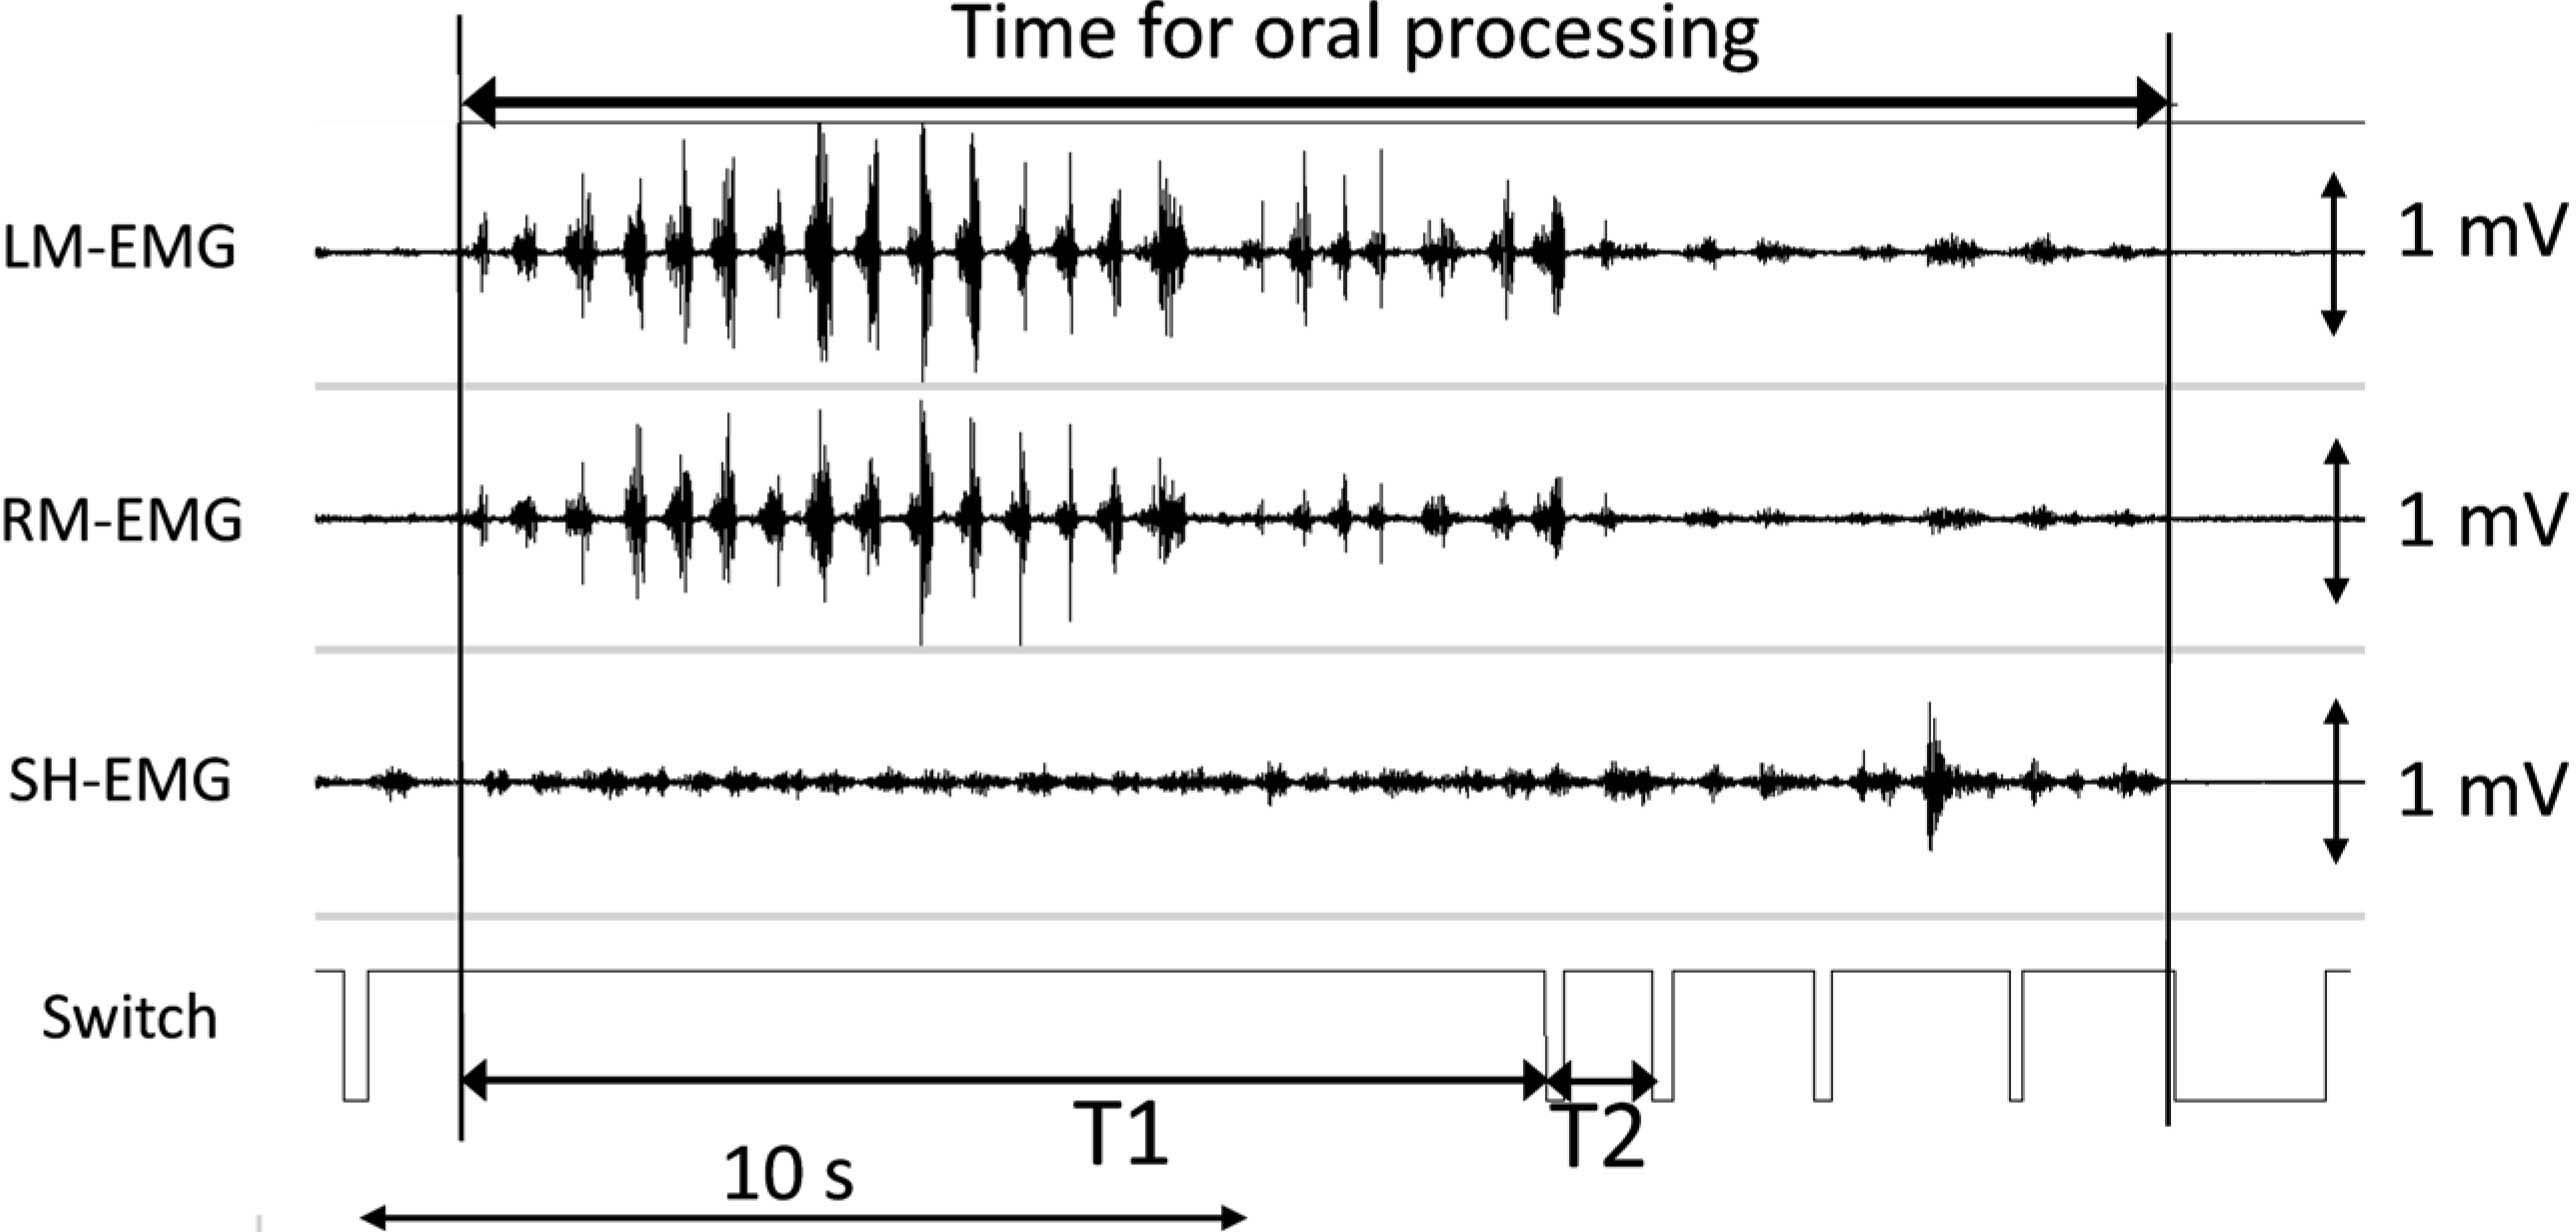
Data analyses The data were analyzed using wave analysis software (AcqKnowlegde® ver. 3.8.2; Biopac Systems Inc.). Each eating period was identified by the switch signals (Fig. 1). We defined the time for oral processing as the period from the initial EMG activities following the first switch to the end of EMG activities before the last switch (top arrows in Fig. 1). Over the entire period of oral processing, we also analyzed part of period T1, the rhythmical masseter activities observed before the first swallow signal, and T2, between the first and second swallow signals.
The number of chews was counted based on the masseter EMG activities. Four parameters that are peak-to-peak amplitudes, durations, cycle times, and muscle activities (time-integrated EMG voltages) were calculated for each muscle corresponding to an action of each muscle (Kohyama et al., 2005a, 2012, 2014; Nakatsu et al., 2014). The parameters appeared as one chewing movement from the left and right masseter muscles averaged together, since the chewing sides were chosen at will. The four EMG parameters of each muscle movement were then averaged for all masticatory actions. EMG duration and muscle activities were summed for T1, T2, and the entire period of oral processing.
Statistical analyses were conducted using the SPSS® package (ver. 17.0 J for Windows®) (SPSS Inc., Chicago, IL, USA), with significance defined at p < 0.05. Effects of sample and size were analyzed using average EMG parameters by two-way repeated-measures analysis of variance (ANOVA). A paired t-test with Bonferroni's correction was used for all combinations of the two samples. Ratios of EMG variables for small to large gels were subjected to one-way ANOVA.
Results
EMG variables were analyzed for entire oral processing, chewing stage before the first swallow (T1), and between the first and second swallow (T2). We did not analyze after the second swallow as averaged number of swallows were nearly two for small samples, although some subjects swallowed more than twice. After the first swallow, the remaining gels in the mouth were small and the amount was unknown, therefore it was difficult to quantitatively discuss size effect.
Clear masseter activities, as shown in Fig. 1, indicated that all gels were chewed at least several times using the back teeth. The suprahyoid EMG signals were weaker and less clear than those observed in masseter EMGs, but the peaks in the suprahyoid EMGs were observed at the resting period of the masseter EMGs during T1 suggesting that the suprahyoid muscles acted to open the mandible. The masseter EMG activities were greater in T1 and lesser in T2, while the suprahyoid muscles exhibit greater activity in the late stage of oral processing suggesting bolus formation with the tongue.
Table 2 shows the results of two-way ANOVA. As individual differences were not considered in repeated-measure methods, only significant differences caused by samples and size were presented. Cross effect between sample and size were not significant except for time for oral processing and masseter muscle activity in T2. Although weak size effect was found in number of chews in T1, both the small and large size gels were masticated until the first swallow. Effects of original gel size were more significant on variables in T2 than in T1; however, we cannot quantitatively discuss the size effects on EMG variables in T2 because the remaining sample amount in the mouth varied and was unknown.
Table 2.
Results of 2-way repeated measure ANOVA of five different gels.
| EMG variable |
Fsample |
Fsize |
Fsample X size |
| Entire oral processing |
|
|
|
| Time for oral processing (s) |
18.68*** |
17.60*** |
4.67*** |
| Number of swallows |
2.68* |
27.73*** |
0.29 ns |
| Total number of masseter actions |
22.01*** |
19.75*** |
0.60 ns |
| Total number of suprahyoid actions |
26.98*** |
16.55** |
2.48 ns |
|
| Time before the first swallow, T1 |
|
|
|
| T1 (s) |
22.91*** |
3.45 ns |
0.06 ns |
| Number of chews |
29.64*** |
4.56* |
0.05 ns |
| Cycle time (s) |
2.57* |
0.06 ns |
0.35 ns |
| Amplitude of masseter activity (mV) |
14.34*** |
1.01 ns |
0.22 ns |
| Masseter duration (s) |
0.72 ns |
0.05 ns |
0.34 ns |
| Masseter muscle activity per chew (mVs) |
16.77*** |
1.43 ns |
0.24 ns |
| Sum of masseter duration (s) |
3.49*** |
0.03 ns |
2.41 ns |
| Sum of masseter activity (mVs) |
20.95*** |
3.10 ns |
0.10 ns |
|
|
|
|
| Number of suprahyoid actions |
28.76*** |
4.54* |
0.14 ns |
| Amplitude of suprahyoid activity (mV) |
0.49 ns |
0.67 ns |
0.07 ns |
| Suprahyoid duration (s) |
0.58 ns |
1.31 ns |
0.24 ns |
| Suprahyoid muscle activity per action (mVs) |
0.10 ns |
0.35 ns |
0.02 ns |
| Sum of suprahyoid duration (s) |
21.41*** |
2.18 ns |
0.09 ns |
| Sum of suprahyoid activity (mVs) |
10.04*** |
0.43 ns |
0.04 ns |
|
| Time between the first and second swallows, T2 |
|
|
|
| T2 (s) |
2.88* |
5.68* |
1.44 ns |
| Number of chews |
4.47*** |
10.40*** |
1.56 ns |
| Cycle time (s) |
2.23 ns |
8.09** |
0.53 ns |
| Amplitude of masseter activity (mV) |
10.26*** |
7.24** |
0.71 ns |
| Masseter duration (s) |
0.72 ns |
0.05 ns |
0.34 ns |
| Masseter muscle activity per chew (mVs) |
4.35** |
0.55 ns |
0.41 ns |
| Sum of masseter duration (s) |
2.80* |
5.59* |
1.34 ns |
| Sum of masseter activity (mVs) |
10.87*** |
17.21*** |
4.37** |
|
|
|
|
| Number of suprahyoid actions |
4.91*** |
14.65*** |
2.42 ns |
| Suprahyoid cycle time (s) |
1.22 ns |
7.72** |
0.88 ns |
| Suprahyoid duration (s) |
1.98 ns |
11.56* |
0.63 ns |
| Sum of suprahyoid duration (s) |
4.76** |
6.52* |
2.32 ns |
| Sum of suprahyoid activity (mVs) |
4.03** |
6.74* |
1.82 ns |
|
| Ratio of T1 to entire oral processing |
|
|
|
| T1 to time for oral processing |
2.67 ns |
13.87** |
2.06 ns |
| Number of chews |
1.17 ns |
22.59*** |
2.20 ns |
| Masseter muscle duration per chew |
5.82*** |
0.06 ns |
1.42 ns |
| Masseter muscle activity per chew |
0.37 ns |
5.52* |
0.09 ns |
| Masseter duration |
2.98* |
18.33** |
2.24 ns |
| Sum of masseter activity |
2.03 ns |
12.98** |
1.95 ns |
|
|
|
|
| Suprahyoid muscle activity per chew |
6.28*** |
0.53 ns |
1.83 ns |
| Sum of suprahyoid duration |
3.93** |
21.69*** |
1.01 ns |
| Sum of suprahyoid activity |
3.58* |
24.40*** |
0.85 ns |
Variables with significant differences in 2-way repeated-measure ANOVA are shown. ns, not significant; significantly different with *, p < 0.05; **, p < 0.01; ***, p < 0.001.
To compare EMG variables of T1 and those of the entire chewing stage, ratios of T1 and entire oral processing were calculated for each variable and also subjected to ANOVA (9 rows from bottom in Table 2). Many of the ratios (T1 itself, number of chews, EMG duration, and muscle activities) in T1 to those in the entire oral processing showed significant size effect.
Table 3 presents EMG variables for different samples. Variables with significant sample effects in two-way ANOVA (Table 2) are presented. As large samples required longer time for oral processing, mean values for large samples are listed. Small samples tended to be similar to large samples as the cross effects were weak. Time for oral processing ranged from 9.6 s (#14) to 30.8 s (#4), number of muscle action for both masseter and suprahyoid muscles correlated well to the time. T1 also showed similar tendency, being 5.3 s (#14) to 17.1 s (#4) to time for oral processing. Both periods for large gels were longer than those for small gels and shorter than twice the oral processing time in small gels for all the samples and subjects. Number of chews and number of suprahyoid actions were the same or one time greater in suprahyoid in T1 due to the opening-closing movements of the mandible. Amplitudes and muscle activities per chew of masseter EMG and the sum of them also showed a similar trend to time for oral processing and greater in T1. Mean cycle time in T1 ranged in different order from 0.527 s (#16) to 0.575 (#14). T2 was not significantly different among samples, and differences in EMG variables in T2 were smaller than those in T1.
Table 3.
Variables from electromyography of five sample gels.
| EMG variable |
Sample |
| #4 |
#6 |
#12 |
#14 |
#16 |
| Entire oral processing |
|
|
|
|
|
| Time for oral processing (s) |
30.80 c |
21.01 ab |
23.06 b |
9.55 a |
17.58 b |
| Number of swallows |
2.9 ab |
2.9 ab |
2.8 ab |
2.2 a |
2.7 b |
| Total number of masseter actions |
44.4 d |
29.5 bc |
34.5 c |
13.4 a |
26.4 b |
| Total number of suprahyoid actions |
45.6 d |
31.6 b |
36.0 bc |
15.3 a |
28.0 b |
|
| Time before the first swallow, T1 |
|
|
|
|
|
| T1 (s) |
17.14 d |
10.74 b |
13.98 c |
5.27 a |
9.74 b |
| Number of chews |
29.9 d |
19.4 b |
24.8 c |
9.6 a |
18.6 b |
| Cycle time (s) |
0.559 ab |
0.559 ab |
0.566 b |
0.575 b |
0.527 a |
| Amplitude of masseter activity (mV) |
1.712 d |
0.722 b |
1.392 c |
0.597 a |
0.741 b |
| Masseter muscle activity per chew (mVs) |
0.0343 d |
0.0188 b |
0.0293 c |
0.0155 a |
0.0192 b |
| Sum of masseter duration (s) |
8.76 d |
5.72 b |
7.41 c |
2.78 a |
5.29 b |
| Sum of masseter activity (mVs) |
1.018 d |
0.366 b |
0.721 c |
0.148 a |
0.370 b |
|
|
|
|
|
|
| Number of suprahyoid actions |
30.8 d |
20.0 b |
25.5 c |
10.5 a |
19.5 b |
| Sum of suprahyoid duration (s) |
9.60 d |
6.25 b |
8.09 c |
3.20 a |
5.78 b |
| Sum of suprahyoid activity (mVs) |
0.41 c |
0.27 b |
0.38 bc |
0.13 a |
0.27 b |
|
| Time between the first and second swallows, T2 |
|
|
|
|
|
| T2 (s) |
6.20 a |
4.25 a |
4.13 a |
1.83 a |
2.04 a |
| Number of chews |
11.1 b |
7.0 ab |
7.3 ab |
3.1 ab |
3.9 a |
| Amplitude of masseter activity (mV) |
1.340 c |
0.609 ab |
0.844 bc |
0.419 ab |
0.422 a |
| Masseter muscle activity per chew (mVs) |
0.0265 b |
0.0208 a |
0.0202 ab |
0.0146 a |
0.0114 a |
| Sum of masseter duration (s) |
3.14 |
2.51 |
2.29 |
1.05 |
1.23 |
| Sum of masseter activity (mVs) |
0.265 |
0.098 |
0.141 |
0.036 |
0.043 |
|
|
|
|
|
|
| Number of suprahyoid actions |
9.6 a |
6.8 a |
6.9 a |
4.1 ab |
4.5 a |
| Sum of suprahyoid duration (s) |
2.96 a |
2.87 a |
2.40 a |
1.61 a |
1.58 a |
| Sum of suprahyoid activity (mVs) |
0.102 a |
0.107 a |
0.081 a |
0.069 a |
0.065 a |
|
| Ratio of T1 to entire oral processing |
|
|
|
|
|
| Masseter muscle duration per chew |
0.99 b |
0.92 a |
0.97 b |
0.93 ab |
0.93 a |
| Sum of masseter duration |
0.71 ab |
0.65 a |
0.72 b |
0.70 ab |
0.68 a |
|
|
|
|
|
|
| Suprahyoid muscle activity per chew |
1.00 c |
0.85 a |
0.96 bc |
0.90 abc |
0.93 ab |
| Sum of suprahyoid duration |
0.69 bc |
0.57 a |
0.68 c |
0.64 abc |
0.64 ab |
| Sum of suprahyoid activity |
0.68 b |
0.56 a |
0.68 b |
0.63 ab |
0.65 ab |
Mean values of eleven subjects and duplicates of large size gels are presented. Values with the same alphabetical letter are not significantly different as determined using paired t-test followed by Bonferroni's correction.
Ratios of T1 to entire oral processing time ranged from 0.57 (#6) to 0.63 (#12) (data not shown). All values were greater than 0.5, and this means that a longer period was required before the first swallow than after the first swallow for all samples. The ratios of S gels became greater than those for corresponding L gels. Masseter muscle activities per chew for T1 were greater than (or similar level to) those for T2 after the first swallow as shown in Table 3. In contrast, suprahyoid activities per chew for T1 were smaller than or similar to those for whole oral processing, meaning the suprahyoid activities were greater after the first swallow. The effects of sample type were significant in suprahyoid activities as shown in the 3rd row from bottom in Table 3, but not in the masseter muscles (not shown).
Table 4 shows ratios of each variable for small and large gels. As amount in the mouth is unknown after the first swallow, entire oral processing and variables in T1 are analyzed. ANOVA results revealed that all the variables did not show significant sample differences. When the gel size was halved from L to S size, EMG variables with significant size effects in Table 2 are compared. The time for oral processing shortened to 0.69 times (average of the five gels) between 0.67 (#4) and 0.74 (#16). The number of swallows and chews (number of masseter actions) were 0.71 and 0.72 times in average, respectively, but the number of suprahyoid actions were less size dependent at 0.84 on average. The variables regarding oral processing time differed significantly. The number of chews counted by masseter EMGs and number of suprahyoid muscle actions in T1 were identical as mentioned above. The number of chews in T1 exhibited weak size dependence (Table 2) and the ratio was 0.82 on average [0.77 (#16) to 0.90 (#4)].
Table 4.
Ratios of EMG variables of small to large samples.
| Sample |
#4 |
#6 |
#12 |
#14 |
#16 |
| Entire oral processing |
|
|
|
|
|
| Time for oral processing |
0.67 |
0.69 |
0.68 |
0.68 |
0.74 |
| Number of swallows |
0.72 |
0.69 |
0.66 |
0.75 |
0.76 |
| Total number of masseter actions |
0.74 |
0.71 |
0.72 |
0.67 |
0.75 |
| Total number of suprahyoid actions |
0.90 |
0.83 |
0.85 |
0.84 |
0.77 |
|
| Time before the first swallow, T1 |
|
|
|
|
|
| T1 |
0.86 |
0.78 |
0.83 |
0.80 |
0.77 |
| Number of chews |
0.90 |
0.80 |
0.84 |
0.78 |
0.77 |
| Cycle time |
0.98 |
1.00 |
1.00 |
1.04 |
1.02 |
| Duration of masseter activity |
0.96 |
0.99 |
0.98 |
1.08 |
0.99 |
| Amplitude of masseter activity |
0.90 |
0.95 |
0.90 |
0.84 |
0.93 |
| Masseter muscle activity per chew |
0.88 |
0.94 |
0.89 |
0.90 |
0.93 |
| Sum of masseter duration |
0.89 |
0.79 |
0.82 |
0.85 |
0.75 |
| Sum of masseter activity |
0.79 |
0.76 |
0.76 |
0.70 |
0.73 |
|
|
|
|
|
|
| Duration of suprahyoid activity |
0.98 |
1.04 |
1.00 |
1.05 |
1.02 |
| Amplitude of suprahyoid activity |
1.01 |
0.93 |
0.93 |
0.92 |
0.94 |
| Suorahyoid muscle activity per chew |
0.95 |
0.98 |
0.94 |
0.95 |
0.95 |
| Sum of suprahyoid duration |
0.89 |
0.84 |
0.86 |
0.87 |
0.79 |
| Sum of suprahyoid activity |
0.86 |
0.80 |
0.81 |
0.79 |
0.73 |
Mean values of eleven subjects are shown. Sample differences are not significant for all variables. Gels are prepared in glass molds of 20 mm-inner diameter. Height of large gels is 20 mm and that of small is 10 mm.
The variables relating duration of T1 (T1, sum of duration and muscle activities for each muscle) did not show significant size effects in 2-way ANOVA and exhibited almost similar ratio values around 0.80 (0.70 to 0.89). In contrast, EMG variables per chew (amplitude, duration, and muscle activities for both muscles, and cycle time) showed smaller changes with a ratio of nearly one (from 1.08 to 0.84 times) and the size effects were not significant (Table 2).
Discussion
Selection of gel samples Hydrocolloid gels can be used as models that cover a wide range of textures of actual solid foods. We previously tested mechanical properties, sensory texture attributes and eating difficulty using twenty hydrocolloid gels (Hayakawa et al., 2014). Previous studies using instrumental and sensory evaluation (Hayakawa et al., 2014) and EMG (Kohyama et al., 2014) were conducted on a fixed size (diameter of 20 mm and height of 10 mm) that was referred to as S size in this study. As texture and associated eating difficulty are likely affected by the size of the mouthful, we planned this study as comparison of different sizes. Although it is expected that L size gels are more difficult to eat than S gels, the size effect may be different with different gel types.
We had to select a smaller number of gels because of limited number of food samples for an EMG recording session (Kohyama et al., 2014). Each gel can be characterized by sensory evaluation as follows (Hayakawa et al., 2014): #4 is firm, slippery and requiring much effort to chew, #6 is adhesive, sticky but requiring little effort to chew, #12 is highly extensible and requiring much effort to chew, #14 is easy to cut, high perceived rate of melting in the mouth and requiring little effort to chew and #16 is firm, brittle, less adhesive and has a relatively high perceived rate of melting in the mouth. Their textural attributes were quite different to each other as indicated by different scoring on the principal components, and discussed in our previous studies (Hayakawa et al., 2014; Kohyama et al., 2014).
Relation to texture and EMG variables In this study, EMG variables for five different hydrocolloid gels with large or small mouthful sizes were analyzed. Generally speaking, T1-related variables were greater in firmer gels with greater cutting effort such as #4 and #12, while they were less in soft gel having a higher melting rate in the mouth such as #14. The EMG variables that relate to T1 were affected by resistance to fracture that was the first principal component from six sensory attributes (Table 1). In contrast, suprahyoid muscles must act to gather food fragments in the mouth to make the bolus just before swallowing in T2 and later stages of oral processing. Sample differences were common for large and small mouthfuls.
Eating difficulty is determined by size of food in addition to mechanical properties. Large size gels required longer oral processing time with greater number of chews and greater number of swallowing. Bolus formation was not completed or the formed bolus disintegrated at first swallow.
We analyzed the EMG variables at different stages before the first swallow (T1), and between the first and second swallows (T2). Before the first swallow, the jaw-closing and -opening muscles alternatively act, where subjects repeated their own rhythmic chewing. As shown in Table 2, chewing cycle time was not significantly different between gel sizes, but significant differences were detected among five sample gels. Averaged cycle time for T1 in Table 3 is a little longer in #14 and #12 and shorter in #16. It is known that chewing cycle is most stable in the middle stage of chewing period T1 and lengthens before swallowing due to bolus formation (Kohyama et al., 2000; Kohyama and Mioche, 2004). The average value of cycle time becomes long if the sample is swallowed after a smaller number of chews. The rhythmical chewing was not observed after the first swallow, and EMG activities of the jaw-closing muscle became smaller. EMG activities of suprahyoid muscles were greater in T2. Observed significant differences among five samples were smaller in T2 than in T1 because the mass of gel samples was small after the first swallow. There are two reasons for that: first, original gel properties were weakened during T1 (Kohyama et al., 1998, 2005b, 2007b; Kohyama and Mioche, 2004), and second, the amount of samples remained in the oral cavity after the first swallow was much smaller, varied greatly, and unknown as majority of the gel bolus was transported from the mouth. The amount left in the mouth after the first swallow may be related to original gel size; also it may be greater for larger gels than smaller gels judging from the number of swallows. However, there was no direct experimental evidence. Food size effects cannot be discussed after the first swallow due to the residual amount which cannot be controlled. It might be possible if the second swallow was forbidden, but T1 would become unnaturally long under this condition. Thus, we allowed for completely free eating to get more parameters in natural oral processing.
When adult subjects eat familiar foods, i.e., foods they have experience eating, the mastication behavior is similar within a subject, but there are large differences in the mastication behavior between subjects. The mechanical properties of a food bolus collected from the subjects' mouth at each stage of oral processing were examined by the two-bite texture profile analysis, which was synchronized with the EMG recording on masseter and suprahyoid muscles (Shiozawa et al., 1999b). Instrumental hardness, adhesiveness, and cohesiveness of the bolus are significantly variable among subjects and foods. Relationships between the mechanical properties of a food bolus and the initiation of swallowing were investigated by the two-bite texture profile analysis using bolus collected from the mouth (Shiozawa et al., 2003). Instrumentally measured values of boluses also showed greater inter-individual differences, but there was a general tendency commonly observed for boluses taken from different individuals. The hardness greatly decreased during oral processing and the adhesiveness values were maximized at swallowing moment if sample food was not very sticky like a rice cake (Shiozawa et al., 2003).
Quantitative analysis Ratios of EMG variables for small and large gels were calculated so they could be discussed quantitatively. If the variables were independent of sample size, the ratio is one, and if they are determined by sample size without being affected by other factors, the ratio should be 0.5. The results shown in Table 4 revealed that sample mass affected the oral processing time (0.69 times) in greatest extent. The number of chewing and swallowing events (0.71 and 0.72 times) followed oral processing time. EMG variables taken in T1 were less size-dependent. Especially, those per chewing movement that did not depend on the sample size. Number of actions of suprahyoid muscles did not increase with number of chews estimated by actions of masseter muscles, because the activities of suprahyoid muscles are dominant after the first swallow where the original sample size does not affect.
When humans eat mouthful-sized gels freely, they do not vary much during each chewing cycle from their individual eating habits. They change in number of chews and swallows depending on the sample mass, and oral processing time was related with the number of chewing or swallowing actions. However, the changes in oral processing time and number of chews and/or swallows were less than the proportional value to the sample mass. Mastication effort is estimated from the activities of masseter muscles (Kohyama et al., 2005b, 2007b). The mastication effort per mass of the large gels was about 0.7. The tongue effort per mass of food is less dependent on the sample mass because the suprahyoid muscle activities influenced by the tongue motion were smaller before the first swallow and greater after that in free style eating.
Range of food As we tested five hydrocolloid gels with wide range of textures (Hayakawa et al., 2014), the above mentioned trend that the mastication effort became 0.7 for half a mouthful food would be applicable to various types of gels. Liquid food immediately swallowed and soft gels eaten through oral deduction by the tongue and hard palate without chewing were not involved in the present study because the mastication effort cannot be estimated by masseter muscle EMGs. However, soft rice gruels chewed just several times exhibited a similar tendency. Five g of rice gruel is eaten with about 0.7 times shorter mastication time, 0.7 times of number of chews, and 0.7 times smaller mastication effort of 10 g of the same samples estimated by masseter EMGs, but no significant differences in EMG variables per chew (Kohyama and Nakayama, 2004). Well cooked rice grains are considered gels, though a piece of grain is very small, but it is swallowed after a small number of chews (Kohyama and Nakayama, 2004; Kohyama et al., 2007b). It seems that shape of original food does not influence the general trend observed in five gels if the sample gel is chewed using the back teeth. This is consistent with a previous report which showed that EMG variables of surimi gels were not significantly different between 7 g thinly sliced and block samples (Kohyama et al., 2007a). The present size effects would be useful to design diet because the range of gel foods include staple foods such as cooked rice and gruel.
When we consider the range of adaptation of this finding, we may set an exceptional case for very adhesive foods such as rice cake. The adhesiveness of rice cake was still high upon swallowing (Shiozawa et al., 2003). According to the model by Hutchings and Lillford (1988), oral processing of solid foods before swallowing requires both the breaking down of the original structure of the food and the lubrication of the bolus surface. As hydrocolloid gels contain much water, the lubrication of the bolus surface is not the main factor in normal cases; however it may be more important in very adhesive gels. For rice cake, masseter EMG activities were lower than those of jaw-opening muscles (Kohyama et al., 2007b) and the adhesiveness of the bolus at the moment of swallowing did not reach the maximum as do very exceptional cases among various foods (Shiozawa et al., 2003). Those findings suggest that rice cake is likely out of the range of the hydrocolloid gels tested in this study.
It may also be better to avoid low-moisture food, as such food requires oral processing time for lubrication of the bolus rather than break-down (Hutchings and Lillford, 1988). EMG activities of melba toast reduced mastication effort with the presence of water (5 or 10 mL), but those of other foods with high moisture content (peanut, carrot, and cheese) were not affected by the addition of water (van der Bilt et al., 2007). As hydrocolloid gels were rich in water, saliva incorporated into the bolus during oral processing would be negligible to the original water content of gels. Hydrocolloid gels were the simplest model of solid foods, while heterogeneous foods and combination of different foods were quite common in daily meals. Influence of hydrophobic ingredients like fat, taste and/or flavor, temperature, and other factors on chewing behavior should be considered when designing a real meal. We plan to quantify the size effects on eating behavior of hydrocolloid gels with a wider range of mouthful size because soft type gels such as mini-cup jelly are usually eaten with greater mouthful portions.
Conclusion
This study clearly elucidated the difficulty some people face when eating solid foods based on five kinds of hydrocolloid gels varying in texture by means of electromyography (EMG). Differences in EMG variables among samples were analyzed separately before the first swallow, between the first and second swallows, and during the entire process until the last swallow. The time before the first swallow related to the mastication effort can be estimated by some EMG variables in masseter muscles during chewing. When sample size was halved, oral processing time shortened, and the number of chews and swallows reduced to 0.7 times, however EMG variables per chewing movement did not change significantly. Mastication effort per mass of foods decreased with an increase in mouthful of foods; thus, we can recommend taking a smaller amount of food per mouthful to facilitate eating for persons with difficulty masticating.
Acknowledgements This study was partly supported by the research and development projects for application in promoting new policy of Agriculture Forestry and Fisheries 22026.
References
- Ashida, I., Iwamori, H., Kawakami, S. Y., Miyaoka, Y., and Murayama, A. (2010). Analysis of the pattern of suprahyoid muscle activity during pharyngeal swallowing of foods by healthy young subjects. J. Med. Eng. Technol., 34, 268-273.
- van der Bilt, A., Engelen, L., Abbink, J. H., and Pereira, L. J. (2007). Effects of adding fluids to solid foods on muscle activity and number of chewing cycles. Eur. J. Oral Sci., 115, 198-205.
- van der Bilt, A. (2009). Oral physiology, mastication and food perception. In “Designing Functional Foods. Measuring and controlling food structure breakdown and nutrient absorption,” ed by D. J. McClements and E. A. Decker, CRC press, Boston, pp. 3-37.
- Boyar, M. M., and Kilcast, D. (1986). Food Texture and dental science. J. Texture Stud., 17, 221-252.
- Çakir, E., Koç, H., Vinyard, C. J., Essick, G., Daubert, C. R., Drake, M., and Foegeding, E. (2012). Evaluation of texture changes due to compositional differences using oral processing. J. Texture Stud., 43, 257-267.
- Chen, J. (2009). Food oral processing — a review. Food Hydrocolloids, 23, 1-25.
- Dantas, R. O., and Dodds, W. J. (1990). Effect of bolus volume and consistency on swallow-induced submental and infrahyoid electromyographic activity. Braz. J. Med. Biol. Res., 23, 37-44.
- Espinosa, Y. G., and Chen, J. (2012). Applications of electromyography (EMG) technique for eating studies. In “Food Oral Processing fundamentals of eating and sensory perception,” ed by J. Chen and L. Engelen
, Wiley-Blackwell, Oxford, pp. 289-317.
- Foegeding, E. A., Çakir, E., and Koç, H. (2010). Using dairy ingredients to alter texture of foods: Implications based on oral processing considerations. Int. Dairy J., 20, 562-570.
- Foegeding, E. A., Daubert, C. R., Drake, M. A., Essick, G., Trulsson, M., Vinyard, C. J., and van de Velde, F. (2011). A comprehensive approach to understanding textural properties of semi- and soft-solid foods. J. Texture Stud., 42, 103-129.
- Gao, Z. H., Taniwaki, M., Shimada, H., Ishihara, S., Nakauma, M., Funami, T., and Kohyama, K. (2013). Ultrasound analysis of the effects of food bolus volume on tongue movement at the initiation of swallowing. J. Texture Stud., 44, 387-396.
- González, R., Montoya, I., and Cárcel, J. (2001). The use of electromyography on food texture assessment. Food Sci. Technol. Int., 7, 461-471.
- Hayakawa, F., Kazami, Y., Ishihara, S., Nakao, S., Nakauma, M., Funami, T., Nishinari, K., and Kohyama, K. (2014). Characterization of eating difficulty by sensory evaluation of hydrocolloid gels. Food Hydrocolloids, 38, 95-103.
- Hutchings, J. B., and Lillford, P. J. (1988). The perception of food texture - the philosophy of the breakdown path. J. Texture Stud., 19, 103-115.
- Inoko, Y., Shimizu, K., Kondou, D., Nishikawa, Y., and Watanabe, F. (2013). Effect of a mouthful volume and double volumes of cooked rice on mastication behavior in young healthy adults. J. Jpn. Soc. Masticat. Sci. Health Promotion (in Japanese), 23, 17-23.
- Ishihara, S., Nakauma, M., Funami, T., Tanaka, T., Nishinari, K., and Kohyama, K. (2011). Electromyography during oral processing in relation to the mechanical and sensory properties of soft gels. J. Texture Stud., 42, 254-267.
- Kemsley, K., Defernez, M., Sprunt, J. C., and Smith, A. C. (2003). Electromyographic responses to prescribed mastication. J. Electromyogr. Kinesiol., 13, 197-207.
- Kohyama, K. (2005). Texture properties. In “Handbook of Texture Creation (in Japanese),” ed by K. Nishinari, H. Ogoshi, K. Kohyama, and T. Yamamoto, Science Forum, Tokyo, pp. 185-191.
- Kohyama, K., Hanyu, T., Hayakawa, F., and Sasaki, T. (2010). Electromyographic measurement of eating behaviors for buckwheat noodles. Biosci. Biotechnol. Biochem., 74, 56-62.
- Kohyama, K., Hayakawa, F., Kazami, Y., Ishihara, S., Nakao, S., Funami, T., and Nishinari, K. (2014). Electromyographic texture characterization of hydrocolloid gels as model foods with varying mastication and swallowing difficulties. Food Hydrocolloids, in press, online available, DOI: 10.1016/j.foodhyd.2014.5.016.
- Kohyama, K., Hayakawa, F., and Sasaki, T. (2012). Relations between mastication variables, mechanical properties and sensory scores of cheese samples with various textures. In “Gums and Stabilisers for the Food Industry 16,” ed by P. A. Williams and G. O. Phillips, Royal Society of Chemistry, Cambridge, pp. 331-338.
- Kohyama, K., Kobayashi, S., Hatakeyama, E., and Suzuki, T. (2000). Electromyographic study of mastication of kelp snack. J. Texture Stud., 31, 577-590.
- Kohyama, K., and Mioche, L. (2004). Chewing behavior observed at different stages of mastication for six foods studied by electromyography and jaw kinematics in young and elderly subjects. J. Texture Stud., 35, 395-414.
- Kohyama, K., and Nakayama, Y. (2004). The influence of eating cooked rice with different firmnesses on electromyograms. J. Jpn. Soc. Masticat. Sci. Health Promotion (in Japanese), 14, 43-49.
- Kohyama, K., Nakayama, Y., Watanabe, H., and Sasaki, T. (2005a). Electromyography of eating apples: Influences of cooking, cutting, and peeling. J. Food Sci., 70, S257-S261.
- Kohyama, K., Nakayama, Y., Yamaguchi, I., Yamaguchi, M., Hayakawa, F., and Sasaki, T. (2007a). Mastication efforts on block and finely cut foods studied by electromyography. Food Qual. Prefer., 18, 313-320.
- Kohyama, K., Ohtsubo, K., Toyoshima, H., and Shiozawa, K. (1998). Electromyographic study on cooked rice with different amylose contents. J. Texture Stud., 29, 101-113.
- Kohyama, K., Sawada, H., Nonaka, M., Kobori, C., Hayakawa, F., and Sasaki, T. (2007b). Textural evaluation of rice cake by chewing and swallowing measurements on human subjects. Biosci. Biotechnol. Biochem., 71, 358-365.
- Kohyama, K., Yamaguchi, M., Kobori, C., Nakayama, Y., Hayakawa, F., and Sasaki, T. (2005b). Mastication effort estimated by electromyography for cooked rice of differing water content. Biosci. Biotechnol. Biochem. 69, 1669-1676.
- Mioche, L., Bourdiol, P., Martin, J. F., and Noël, Y. (1999). Variations in human masseter and temporalis muscle activity related to food texture during free and side-imposed mastication. Arch. Oral Biol., 44, 1005-1012.
- Miyaoka, Y., Ashida, I., Kawakami, S., Tamaki, Y., and Miyaoka, S. (2010). Activity patterns of the suprahyoid muscles during swallowing of different fluid volumes. J. Oral Rehabil., 37, 575-582.
- Miyawaki, S., Ohkochi, N., Kawakami, T., and Sugimura, M. (2000). Effect of food size on the movement of the mandibular first molars and condyles during deliberate unilateral mastication in humans. J. Dent. Res., 79, 1525-1531.
- Nakatsu, S., Kohyama, K., Watanabe, Y., Hayakawa, F., Shibata, K., Sakamoto, K., and Shimoda, M. (2014). A trial of human electromyography to evaluate texture of softened foodstuffs prepared with freeze-thaw impregnation of macerating enzymes. Innov. Food Sci. Emerg. Technol., 21, 188-194.
- Nakazawa, F., and Togashi, M. (2000). Evaluation of food texture by mastication and palatal pressure, jaw movement and electromyography. In “Hydrocolloids Part 2,” ed by K. Nishinari, Elsevier, Amsterdam, pp. 413-454.
- Nishinari, K. (2009). Texture and rheology in food and health. Food Sci. Technol. Res., 15, 99-106.
- Palmer, P. M., Luschei, E. S., Jaffe, D., and McCulloch, T. M. (1999). Contributions of individual muscles to the submental surface electromyogram during swallowing. J. Speech Lang. Hear. Res., 42, 1378-1391.
- Sakamoto, H., Harada, T., Matsukubo, T., Takaesu, Y., and Tazaki, M. (1989). Electromyographic measurement of textural changes of foodstuffs during chewing. Agric. Biol. Chem., 53, 2421-2433.
- Shiozawa, K., Kohyama, K., and Yanagisawa, K. (1995). Cooked rice mastication in humans. -Influence of physical property of cooked rice on the human masticatory behavior-. J. Jpn. Soc. Masticat. Sci. Health Promotion (in Japanese), 5, 27-42.
- Shiozawa, K., Kohyama, K., and Yanagisawa, K. (1999a). Influence of ingested food texture on jaw muscle and tongue activity during mastication in humans. Jpn. J. Oral Biol., 41, 27-34.
- Shiozawa, K., Kohyama, K., and Yanagisawa, K. (1999b). Food bolus texture and tongue activity just before swallowing in human mastication. Jpn. J. Oral Biol., 41, 297-302.
- Shiozawa, K., Kohyama, K., and Yanagisawa, K. (2003). Relationship between physical properties of a food bolus and initiation of swallowing. Jpn. J. Oral Biol., 45, 59-63.
- Takahashi, T., Tsuge, M., and Ogoshi, H. (2011). Physical properties of semi-liquid food and swallowing behaviors through measurement of electromyography from suprahyoid musculatures during swallowing. Nihon Reoroji Gakkaishi, 39, 93-98.
- Taniguchi, H., Tsukada, T., Ootaki, S., Yamada, Y., and Inoue, M. (2008). Correspondence between food consistency and suprahyoid muscle activity, tongue pressure, and bolus transit times during the oropharyngeal phase of swallowing. J. Appl. Physiol., 105, 791-799.
- Wilkinson, C., Dijksterhuis, G. B., and Minekus, M. (2000). From food structure to texture. Trends Food Sci. Technol., 11, 442-450.
- Woda, A., Foster, W., Mishellany, A., and Peyron, M. A. (2006). Adaptation of healthy mastication to factors pertaining to the individual or to the food. Physiol. Behav., 89, 28-35.