Introduction
Cassava (Manihot esculenta Crantz) is widely cultivated and consumed in tropical regions such as Southeast Asia, Africa and South America. In 2012, total world cassava root production was 260 million tons, of which 2.2 million tons were produced in the Philippines. Cassava production in the Philippines is increasing, with production in 2012 approximately 1.5 times greater than in 2002 (FAOi)). Cassava contains the largest amount of carbohydrate of any food crop other than sugarcane (Okigbo, 1980). Hence, cassava is an important source of carbohydrates for people in the tropics.
Cassava root, flour and starch are consumed in the Philippines in various kinds of food, while breeding of cassava varieties is targeted at improving particular properties, for example, to achieve higher yield, better disease resistance, higher starch content and lower cyanide content (Mariscal et al., 2002). However, fresh cassava root that is not kept under suitable storage conditions deteriorates rapidly due to physiological changes and microbial activity, and cassava root has a very short shelf-life, usually less than 2 days (Abera and Rakshit, 2003; Isamah, 2004). Therefore, cassava root must be processed into products such as flour and starch soon after harvesting.
Cassava varieties that can be used for preparing flour have been bred in the Philippines. One of the newest varieties, developed for higher fresh root yield, is Cv-46 (Philippine Root Crop Research and Training Center ii)). It has been reported that the Lakan 1 variety has better agronomic characteristics, such as water deficit resistance and high yield (Bergantin et al., 2004; Taguiam et al., 2010). In addition, it is recognized that the physicochemical properties of flour vary depending on the variety of cassava used. For example, Niba et al. (2002) and Charoenkul et al. (2011) determined the physicochemical properties of flours and starches from different cassava varieties grown in Nigeria and Thailand, respectively, and reported that the use of different varieties resulted in changes in chemical composition, pasting properties and thermal properties. Furthermore, cassava flours may be prepared by different methods, including milling dried roots directly into flour, pre-gelatinization prior to drying and milling, fermentation and water soaking. Pre-gelatinized cassava flour is commonly used for cooking traditional products such as cassava cake in the Philippines. In addition, different preparation methods lead to differences in the physicochemical properties of flours. For example, Adebowale et al. (2008) reported that cassava flours prepared by different roasting methods have different physicochemical properties such as sugar content and peak viscosity. A study on the effects of cooking method and storage temperature on the retrogradation of starch in cassava flours was carried out by Rodríguez-Sandoval et al. (2008). Since few studies are available on cassava flours processed in the Philippines, more technical information on the properties of cassava flours is needed for a better understanding of this ingredient. Thus, the objectives of this study were to characterize the physicochemical properties of 5 different cassava varieties developed in the Philippines and to investigate the effect of pre-gelatinization on flour properties.
Materials and Methods
Raw materials Six cassava varieties, namely Lakan 1, Sultan 6, Sultan 7, Rajah 2 and Rajah 4, were harvested from field plots at the Institute of Plant Breeding, University of the Philippines in Los Baños. Freshly harvested cassava roots were used for preparation of dry and pre-gelatinized flours within 2 days after harvesting.
Preparation of dry flours Cassava roots were peeled, washed, chipped and dried in a hot air oven at 40°C. The dried chips were milled by a blender and sifted through a sieve with an aperture of 180 µm. The samples were stored at 4°C before analysis.
Preparation of pre-gelatinized flours Cassava roots were peeled, washed and steamed in a home steamer. Steamed cassava roots were chipped and dried in a hot air oven at 40°C. The dried pre-gelatinized chips were milled in a blender and sifted through a sieve. The samples were stored at 4°C before analysis.
Analytical methods of chemical composition Moisture, crude protein, crude fat and ash content were determined by standard AOAC methods (2000). Total starch, amylose, damaged starch content and α-amylase activity were determined by Megazyme assay kits based on the methods of McCleary et al. (1997), Yun and Matheson (1990), Gibson et al. (1991) and McCleary and Sheehan (1987) (Megazyme International Co. Ltd.). Glucose, fructose and sucrose contents were determined by HPLC after extraction with 80% (v/v) ethanol. Mineral contents of magnesium, phosphorus, potassium and calcium were determined by inductively coupled plasma mass spectrometry (ICPS-8100, Shimadzu Co. Ltd.). After ashing of a 2 g sample, the resulting ash was dissolved in 2N-HCl and the solution was subjected to mineral analysis.
Analytical methods for physical properties Particle size distribution was determined using a compact laser diffraction particle size analyzer (LA-300, HORIBA Co. Ltd.). To determine the pasting properties of the flour, a 10% dry weight basis (dwb) slurry was subjected to analysis using a Rapid Visco Analyzer (RVA) (RVA-4, Newport Scientific, Inc.) with a paddle rotating at 960 rpm for the first 10 sec and then at a fixed speed of 160 rpm. The slurry was heated from 50 to 95°C at a rate of 12°C/min, held at 95°C for 2.5 min, cooled to 50°C at a rate of 12°C/min, and then kept at 50°C for 2 min. The pasting properties determined included peak viscosity (the highest viscosity observed during heating), hot paste viscosity (the viscosity at the end of the 95°C period), final viscosity (the viscosity at the end of the period at 50°C, breakdown (peak viscosity minus hot paste viscosity), setback (final viscosity minus hot paste viscosity) and pasting temperature (Limpisut and Jindal, 2002; Yadav et al., 2006). Thermal properties were determined using a differential scanning calorimeter (DSC) (Micro DSC II, Setaram, Inc.). A sample of 300 mg dwb was weighed in a DSC pan and distilled water was added to give a suspension of 30% dwb. The pan was sealed and allowed to stand overnight at 20°C. The scanning temperature range was set at 30 to 95°C and the heating rate was 1.5°C/min. 700 mg of water was used as a reference. Solubility and swelling power were determined using a method described by Sánchez et al. (2010) with slight modification. A 1% dwb flour suspension was heated from 35°C to 50, 60, 70, 80, 90 and 95°C at a rate of 6°C/min using a RVA. After holding at the set temperature for 2.5 min, the suspension was centrifuged at 3000 rpm for 15 min and both supernatant and sediment were collected. The sediment was used for analysis of swelling power and the supernatant was used for solubility analysis after drying at 105°C for 24 hrs.
Statistical analysis The physicochemical properties of dry and pre-gelatinized flours were statistically analyzed using SPSS for Windows (ver. 17.0). One-way analysis of variance and Duncan's multiple-range test were carried out for comparison of the physicochemical properties of dry and pre-gelatinized flours between 5 varieties at a 5% significance level. The effect of pre-gelatinization on flour properties for each variety was examined using t-test at 5% significance level. Multiple correlation analysis was performed to evaluate the correlationship between the chemical and physical properties of dry and pre-gelatinized flours, while principal component analysis was applied to assess overall flour quality and to evaluate the effect of pre-gelatinization on flour properties.
Results and Discussion
Proximate composition Table 1 presents the proximate compositions of dry and pre-gelatinized flours. The crude protein, crude fat, ash and total starch contents of the dry flours used were 1.31 – 1.98, 0.48 – 1.03, 2.13 – 3.36 and 72.99 – 78.76% dwb, respectively. These values were comparable to those reported by Moorthy et al. (1996), Aryee et al. (2006), Rodríguez-Sandoval et al. (2008) and Charoenkul et al. (2011). Aryee et al. reported that moisture is an important parameter in the storage of cassava flour, with a highest allowable moisture content of 12% for prevention of microbial growth and a longer shelf life. In the present study, all flours had a moisture content of less than 12%; therefore, they all had a relatively safe and long shelf life.
Table 1.
Proximate composition of dry and pre-gelatinized flours.
| Treatment |
Varieties |
Moisture (%) |
Crude protein |
Crude fat |
Ash |
Total starch |
| (%, dwb) |
| Drying |
Lakan 1 |
* 11.66 a |
1.52 b |
0.48 d |
2.46 c |
* 78.69 a |
| Sultan 6 |
* 10.57 e |
* 1.51 b |
0.72 bc |
3.02 b |
* 72.99 b |
| Sultan 7 |
* 10.88 c |
1.98 a |
0.88 ab |
3.36 a |
73.65 b |
| Rajah 2 |
* 11.19 b |
* 1.31 c |
1.03 a |
2.54 c |
* 76.77 a |
| Rajah 4 |
* 10.79 d |
* 1.57 b |
0.64 cd |
* 2.13 d |
* 78.76 a |
| Pre-gelatinization |
Lakan 1 |
9.38 b |
1.42 b |
0.45 |
* 2.74 b |
75.31 a |
| Sultan 6 |
9.76 a |
1.24 cd |
0.43 |
3.27 a |
64.10 c |
| Sultan 7 |
8.46 e |
1.91 a |
0.50 |
3.28 a |
71.79 ab |
| Rajah 2 |
9.11 c |
1.19 d |
0.60 |
2.55 c |
68.37 bc |
| Rajah 4 |
8.63 d |
1.28 c |
0.38 |
1.89 d |
68.17 bc |
Mean values in the same column with different letters are significantly different within the same treatment (p < 0.05).
Mean values in the same column with * are significantly higher than that of the corresponding flour of the same variety (p < 0.05).
Dry and pre-gelatinized flour from the variety Sultan 7 had significantly higher crude protein and ash contents than the other varieties (p < 0.05). In a comparison of the crude protein content of dry and pre-gelatinized flours, dry flours of 3 varieties had significantly higher values than pre-gelatinized flours (p < 0.05). The major cause of this significant decrease in the crude protein content may be the pre-gelatinization process, which allows elution and dissolution of water-soluble proteins during steam treatment. The total starch contents of the dry flours were similar to those observed by Niba et al. (2002). Pre-gelatinization also led to a significant decrease in the total starch content (p < 0.05), which may have been caused by enzymatic digestion of gelatinized starch, as reported by Sagum and Arcot (2000) in their study on the effect of heat processing on the starch content of rice.
Mineral composition The major mineral components of dry and pre-gelatinized flours such as magnesium, phosphorus, potassium and calcium are shown in Table 2. The most dominant mineral in all flours was potassium, at 642.53 – 1259.28 mg/100 g dwb. Charles et al. (2005) reported that the mean Mg, P, K and Ca contents of peeled and oven-dried cassava flours of 5 varieties from Thailand were 35.5, 134.1, 424.1 and 243.8 mg/100 g dwb, respectively. In comparison, we observed higher mean contents of Mg, P and K, but lower mean Ca contents, in flours from the Philippines. Such differences may be mainly caused by differences in genotype and in the cultivation conditions.
Table 2.
Mineral composition of dry and pre-gelatinized flours.
| Treatment |
Varieties |
Mg |
P |
K |
Ca |
| (mg/100 g, dwb) |
| Drying |
Lakan 1 |
53.23 ab |
434.81 a |
891.99 ab |
48.02 |
| Sultan 6 |
63.43 a |
407.17 a |
1061.98 a |
* 51.91 |
| Sultan 7 |
56.80 ab |
401.48 a |
1037.30 ab |
68.63 |
| Rajah 2 |
58.80 ab |
414.57 a |
1070.91 a |
70.74 |
| Rajah 4 |
39.28 b |
330.73 b |
642.53 b |
42.93 |
| Pre-gelatinization |
Lakan 1 |
62.31 b |
499.68 a |
* 1030.17 bc |
56.05 b |
| Sultan 6 |
58.71 b |
* 505.16 a |
1152.48 ab |
48.77 c |
| Sultan 7 |
82.41 a |
458.22 a |
1259.28 a |
63.28 a |
| Rajah 2 |
48.45 c |
385.72 b |
934.06 cd |
56.09 b |
| Rajah 4 |
47.84 c |
360.08 b |
821.82 d |
41.47 d |
Mean values in the same column with different letters are significantly different within the same treatment (p < 0.05).
Mean values in the same column with * are significantly higher than that of the corresponding flour of the same variety (p < 0.05).
Soluble sugar composition Table 3 indicates the soluble sugar composition of dry and pre-gelatinized flours. The major soluble sugar was sucrose, ranging between 16.17 and 47.92 mg/g dwb. Flours processed from the Lakan 1 variety contained significantly lower amounts of soluble sugar than those from other varieties (p < 0.05). The glucose and sucrose contents were similar to those reported by Carvalho et al. (2004) on peeled cassava root from Brazil, except for the dry flour from Lakan 1. Although Carvalho et al. also reported that cassava varieties used for starch production have a relatively lower soluble sugar content, the cassava varieties used in the present study are recommended for starch production, flour, food and feeds, regardless of soluble sugar content, by the Philippine Root Crop Research and Training Center ii). In a comparison of soluble sugar content in flours obtained by two different treatments, all pre-gelatinized flours showed significantly higher fructose and glucose contents. This may be caused by enzymatic hydrolysis of starch and sucrose during steam treatment in the pre-gelatinization process.
Table 3.
Soluble sugar composition of dry and pre-gelatinized flours.
| Treatment |
Varieties> |
Fructose |
Glucose |
Sucrose |
| (mg/g, dwb) |
| Drying |
Lakan 1 |
0.41 d |
0.73 d |
16.17 c |
| Sultan 6 |
2.27 c |
1.94 c |
39.37 a |
| Sultan 7 |
4.99 a |
5.12 a |
21.96 b |
| Rajah 2 |
3.05 b |
2.26 b |
21.73 b |
| Rajah 4 |
1.03 d |
1.78 c |
40.70 a |
| Pre-gelatinization |
Lakan 1 |
* 0.87 d |
* 1.01 d |
* 27.10 c |
| Sultan 6 |
* 7.90 b |
* 7.69 b |
* 46.51 a |
| Sultan 7 |
* 10.04 a |
* 10.84 a |
* 34.38 b |
| Rajah 2 |
* 5.87 c |
* 6.09 c |
34.07 b |
| Rajah 4 |
* 7.60 bc |
* 7.15 bc |
47.92 a |
Mean values in the same column with different letters are significantly different within the same treatment (p < 0.05).
Mean values in the same column with * are significantly higher than that of the corresponding flour of the same variety (p < 0.05).
Starch properties Table 4 shows the amylose and damaged starch contents and the α-amylase activities of dry and pre-gelatinized flours as starch properties. These results were similar to those reported by Aryee et al. (2006), Shittu et al. (2008) and Charoenkul et al. (2011).
Table 4.
Starch properties of dry and pre-gelatinized flours.
| Treatment |
Varieties> |
Amylose (%, w/w) |
Damaged stach (%, dwb) |
α-Amylase (Unit/g flour) |
| Drying |
Lakan 1 |
18.16 b |
0.71 c |
* 0.0061 d |
| Sultan 6 |
16.05 c |
1.06 b |
* 0.0074 c |
| Sultan 7 |
20.55 a |
1.61 a |
* 0.0147 a |
| Rajah 2 |
18.66 b |
0.87 bc |
* 0.0099 b |
| Rajah 4 |
18.21 b |
0.81 c |
* 0.0143 a |
| Pre-gelatinization |
Lakan 1 |
* 25.74 a |
* 45.44 |
0.0031 b |
| Sultan 6 |
* 21.89 c |
* 48.11 |
0.0030 b |
| Sultan 7 |
* 26.63 a |
* 48.95 |
0.0015 c |
| Rajah 2 |
* 22.18 bc |
* 45.45 |
0.0046 a |
| Rajah 4 |
* 23.66 b |
* 45.30 |
0.0017 c |
Mean values in the same column with different letters are significantly different within the same treatment (p < 0.05).
Mean values in the same column with * are significantly higher than that of the corresponding flour of the same variety (p < 0.05).
The highest amylose content was observed in the dry and pre-gelatinized flours of Sultan 7 variety. Compared to the dry flours, all pre-gelatinized flours showed a significant increase in amylose content (p < 0.05). This observation is in agreement with those of Yadav et al. (2006), who reported an increase in the amylose content of potato flours resulting from molecular degradation of starch granules under hydrothermal treatment.
The dry flour from Sultan 7 had the highest degree of damaged starch, and it was found that pre-gelatinization caused a significant increase in damaged starch content (p < 0.05). Steam treatment during pre-gelatinization resulted in degradation of the crystalline regions, and the subsequent drying and milling processes may have caused greater mechanical damage to the pre-gelatinized starch.
The α-amylase activity ranged from 0.0061 to 0.0147 for dry flour and 0.0015 to 0.0046 for pre-gelatinized flour. All pre-gelatinized flours showed significantly lower enzymatic activity than dry flours (p < 0.05), which may be due to inactivation of enzymes during steam treatment in pre-gelatinization.
Particle size distribution The mean particle size of the dry and pre-gelatinized flours ranged from 25.04 to 35.02 µm and 190.70 to 219.09 µm, respectively, as shown in Table 5. The mean particle sizes of the dry flours were greater than those observed by Charoenkul et al. (2011), who reported that the mean particle size of hot-air-oven-dried cassava flours from 12 varieties ranged between 12.58 and 14.95 µm. The mean particle sizes of all pre-gelatinized flours were significantly greater than those of the dry flours (p < 0.05) and this was attributed to swelling of the starch during pre-gelatinization.
Table 5.
Particle size distribution of dry and pre-gelatinized flours.
| Treatment |
Varieties |
Particle range |
Mean particle size |
| (µm) |
| Drying |
Lakan 1 |
3.82 – 135.01 |
25.04 b |
| Sultan 6 |
3.41 – 188.11 |
32.57 a |
| Sultan 7 |
3.91 – 188.71 |
34.37 a |
| Rajah 2 |
4.47 – 169.02 |
35.02 a |
| Rajah 4 |
4.36 – 181.77 |
29.86 ab |
| Pre-gelat inization |
Lakan 1 |
3.21 – 592.39 |
* 201.52 b |
| Sultan 6 |
3.49 – 592.39 |
* 200.16 be |
| Sultan 7 |
3.06 – 592.39 |
* 190.70 c |
| Rajah 2 |
3.72 – 592.39 |
* 209.99 ab |
| Rajah 4 |
3.78 – 592.39 |
* 219.09 a |
Mean values in the same column with different letters are significantly different within the same treatment (p < 0.05).
Mean values in the same column with * are significantly higher than that of the corresponding flour of the same variety (p < 0.05).
Pasting properties The pasting properties of dry and pre-gelatinized flours are shown in Table 6, and the pasting profile of Rajah 4 is shown in Fig. 1 as an example. The peak viscosities of the dry flours ranged between 3513.0 and 3788.0 cP, and the flour from the Rajah 4 variety had the highest peak viscosity among the 5 varieties examined. Rajah 4 also showed the greatest breakdown, indicating a low ability to withstand heating and shear stress, and the highest setback, indicating the highest potential for retrogradation (Newport Scientific, 1998).
Table 6.
Pasting properties of dry and pre-gelatinized flours.
| Treatment |
Varieties |
Peak viscosity |
Hot paste viscosity |
Final viscosity |
Breakdown |
Setback |
Pasting temperature (°C) |
| (cP) |
| Drying |
Lakan 1 |
* 3552.0 c |
* 2068.0 b |
* 2752.0 a |
* 1484.0 d |
684.0 b |
* 73.4 a |
| Sultan 6 |
* 3513.0 c |
* 1869.0 c |
* 2550.5 b |
* 1644.0 b |
* 681.5 b |
* 71.0 c |
| Sultan 7 |
* 3658.0 b |
* 2101.5 ab |
* 2730.0 a |
* 1556.5 c |
* 628.5 d |
* 71.4 be |
| Rajah 2 |
* 3555.0 c |
* 2131.0 a |
* 2788.5 a |
* 1424.0 e |
* 657.5 c |
* 71.7 b |
| Rajah 4 |
* 3788.0 a |
* 1825.5 c |
* 2588.0 b |
* 1962.5 a |
* 762.5 a |
* 70.2 d |
| Pre-gelatinization |
Lakan 1 |
770.0 a |
764.5 a |
1477.5 a |
5.5 |
713.0 a |
50.8 |
| Sultan 6 |
416.5 be |
395.0 c |
778.5 e |
1.5 |
383.5 d |
51.9 |
| Sultan 7 |
382.5 c |
380.5 c |
836.0 d |
2.0 |
455.5 c |
51.9 |
| Rajah 2 |
471.0 b |
469.5 b |
940.5 c |
1.5 |
471.0 c |
51.9 |
| Rajah 4 |
731.5 a |
725.0 a |
1346.5 b |
6.5 |
621.5 b |
51.6 |
Mean values in the same column with different letters are significantly different within the same treatment (p < 0.05).
Mean values in the same column with * are significantly higher than that of the corresponding flour of the same variety (p < 0.05).

Pre-gelatinization by steam treatment led to a decrease in viscosity; thus, all pre-gelatinized flours showed significantly lower values of peak viscosity, hot paste viscosity and breakdown than the corresponding dry flours (p < 0.05). In addition, the pre-gelatinized flours did not show distinct peak viscosity or breakdown, due to complete gelatinization and damage of starch during steaming and milling operations. These results agreed with reports by Hagenimana et al. (2006), Yadav et al. (2006) and Soison et al. (2014).
The value of final viscosity indicates the ability of materials to form a viscous paste or gel after cooking and cooling (Newport Scientific, 1998). Higher final viscosity was observed in the dry flours from Lakan 1, Sultan 7 and Rajah 2, while Lakan 1 showed the highest final viscosity among pre-gelatinized flours. The high final viscosities of these flours may be influenced by the low soluble sugar content and high amylose content.
Thermal properties Table 7 shows the thermal properties of the dry flours. The onset temperature (To), peak temperature (Tp), conclusion temperature (Tc) and enthalpy (ΔH) for gelatinization of dry flours ranged from 63.3 to 65.4°C, 68.7 to 70.7°C, 76.6 to 79.4°C and 12.2 to 13.4 J/g dwb, respectively. Charoenkul et al. (2011) reported higher To, Tp and Tc values than those observed in the present study, but similar ΔH values.
Table 7.
Thermal properties of dry flours.
| Treatment |
Varieties |
To |
Tp |
Tc |
ΔH (J/g, dwb) |
| (°C) |
| Drying |
Lakan 1 |
65.4 a |
70.7 a |
79.4 a |
13.4 a |
| Sultan 6 |
65.2 a |
70.1 b |
76.7 c |
13.1 ab |
| Sultan 7 |
63.7 b |
70.2 b |
77.7 b |
12.2 c |
| Rajah 2 |
63.3 b |
68.7 c |
76.6 c |
12.6 bc |
| Rajah 4 |
63.4 b |
68.9 c |
76.7 c |
13.2 ab |
Mean values in the same column with different letters are significantly different within the same treatment (p < 0.05).
Pre-gelatinized flours, in contrast, did not show an endothermic peak. The disappearance of the endothermic peak was explained by Rodríguez-Sandoval et al. (2008) in their studies on steamed and boiled cassava flours, where starch in cooked flour is completely gelatinized, thus losing crystalline region.
Solubility and swelling power Fig. 2 shows the solubility transitions of dry and pre-gelatinized flours. The solubility of the dry flours showed slight changes between 50 and 70°C, and significant increases at 80°C and above (p < 0.05). The solubility of all pre-gelatinized flours increased in a linear fashion with the rise in temperature. In a comparison of solubility between pre-gelatinized flours, these can be divided into two groups: a higher-solubility group consisting of Sultan 6 and Sultan 7, and a lower-solubility group consisting of Lakan 1, Rajah 2 and Rajah 4.

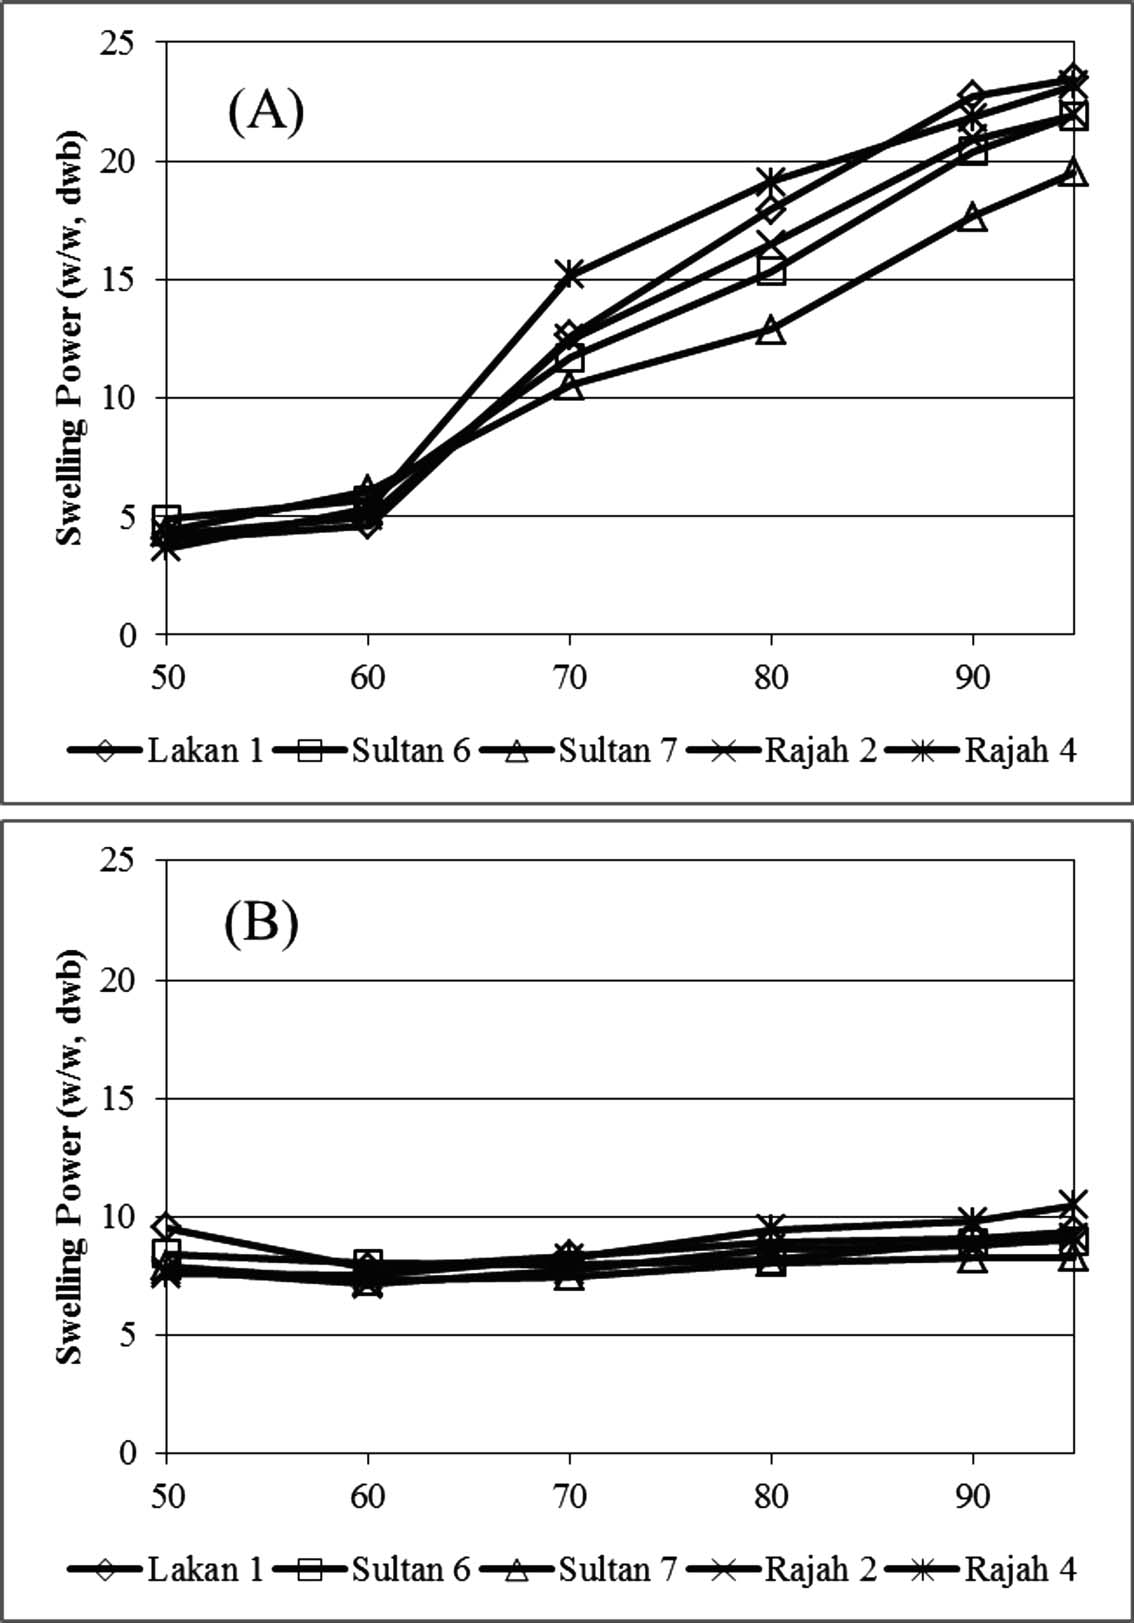
Transitions of the swelling power of dry and pre-gelatinized flours are illustrated in Fig. 3. In the dry flours, swelling power increased dramatically from 4.61 – 6.10 w/w dwb at 60°C to 10.55 – 15.18 w/w dwb at 70°C, followed by a constant increase with rising temperature. In contrast, the swelling power of pre-gelatinized flours remained constant around 10 w/w dwb and below, due to complete gelatinization of starch during steam treatment in pre-gelatinization and increased starch damage.
Pre-gelatinization and heat-moisture treatment have been applied in improvement of bread texture as anti-staling agents (Lorenz and Kulp, 1981; Purhagen et al., 2008), and pre-gelatinized flours obtained by steam treatment, as in this study, may also have potential in texture modification for bakery products.
Correlationship between chemical and physical properties Multiple correlation analysis was performed to evaluate the correlationship between the chemical and physical properties of dry and pre-gelatinized flours.
In the dry flours, swelling power was highly correlated with total starch content, negatively at 60°C and below (r = −0.802 to −0.883), and positively at 70°C and above (r = 0.786 to 0.881). At temperatures of 60°C and below, water absorption in the dry flours was very low, but this increased drastically at temperatures greater than 70°C, which is close to the gelatinization temperature, resulting in an increase in swelling power. In addition, the damaged starch content of dry flours showed a significant negative correlation with swelling power at 80°C and above (r = −0.922 to −0.984, p < 0.05), which clearly indicates that a higher damaged starch content leads to lower swelling power, due to the decrease in the crystalline region of starch.
In the pre-gelatinized flours, solubility over the temperature range showed a significant positive correlation with damaged starch content (r = 0.918 to 0.994, p < 0.05). According to Zhang et al. (2013), mechanical damage of starch granules increases the amorphous region of starch, and this allows a subsequent increase in solubility in pre-gelatinized cassava starch.
Principal component analysis of flour properties for 5 cassava varieties Principal component (PC) analysis was carried out to assess the overall quality of dry and pre-gelatinized flours produced from 5 cassava varieties based on their physicochemical properties. The proportion of variance of the first PC was 59.0%, and that of the second PC was 18.9%; the accumulated proportion of the first and second PC was 77.9%.
Fig. 4 shows a scattergram of the factor loading plot for the first and second PC. Factor loadings of the first PC showed relatively high positive correlation with damaged starch content, mean particle size and swelling power at 50°C, while negative correlation was observed from swelling power at 95°C and pasting properties. Thus, the first PC can be interpreted as the viscosity and swelling power of starch, which undergoes a drastic change in its granular structure caused by steam treatment during pre-gelatinization. The factor loading of the second PC was highly correlated with ash, Ca, K, Mg and crude protein contents.

Fig. 5 shows a PC score plot for the first and second PC. The dry and pre-gelatinized flours may be divided into two groups based on the first PC scores, with lower scores for the dry flours and higher scores for the pre-gelatinized flours. In the second PC scores, Lakan 1, Sultan 6 and Sultan 7 showed a slight decrease, which indicates low leaching of chemical components such as water-soluble proteins and minerals during steam treatment in pre-gelatinization. Therefore, these varieties may be suitable for production of pre-gelatinized flours.