Abstract
About 8 million tons of jujube pomace arise within a year in China. Bioconversion of food processing residues is receiving increased attention because these residual materials represent a possible and utilizable resource for conversion into useful products. To explore the application of Chinese jujube (Ziziphus jujube Mill.) seeds protein concentrate (ZPI) in food industry, its physiochemical and functional properties were analyzed in this study. The free sulfhydryl content of ZPI is 7.1 × 10⁻⁶ mol/g of protein at pH 8.0. Differential scanning calorimetry analyses showed that ZPI had only one endothermic peak with denaturation temperature of about 91°C. Amino acid analyses revealed that ZPI exhibited high levels of glutamic acid, aspartic acid and arginine. The least gelation concentration (LGC) of ZPI is ∼8% at pH 7.0, whereas the protein solubility, emulsifying activity, emulsion stability, and water-holding capacity of ZPI were much lower than those of soybean protein concentrate (SPI). These results suggest that ZPI could be used as a valuable source of protein and gel.
Introduction
Jujube (Zizyphus jujube Mill.), which is mainly distributed in tropical and subtropical regions of the world, is a tree of the Rhamnaceae family (Li et al., 2007; Mukhtar et al., 2004; Su et al., 2005). Jujube is a popular and profitable fruit, and is much admired due to its high nutritional value. Thus, Chinese jujube has been commonly used in traditional Chinese medicine and also used as food for thousands of years. The Chinese share of world jujube production is about 90% and its production has increased in the last ten years due to the demands for food and pharmaceutical applications (Li et al., 2005; Su et al., 2005), with a total yield of 36 million tons in 2008 (MOA, 2009). About 80% of the annual Chinese jujube production has been consumed in fresh, dried forms and juice, and therefore ∼8 million tons of jujube pomace arise annually. These wastes pose potential disposal and pollution problems along with loss of valuable biomass and nutrients. Bioconversion of food processing residues is receiving increased attention because these residues represent a possible and utilizable resource for conversion into useful products. In this context, the utilization of wastes of fruit processing as a source of functional ingredients is a promising field (Schieber et al., 2001). Jujube pomace is mainly composed of jujube seeds, which represents a potential source of edible protein. The plant seed is not only an organ of propagation and dispersal, but also the major plant tissue harvested by humankind. The amount of protein present in seeds varies from 10% to 40% of the dry weight, forming a major source of dietary protein (Shewry et al., 1995). However, to the best of our knowledge, little information is available concerning the physiochemical and functional properties of the protein components in jujube seeds. The objective of this work was to investigate the physiochemical and functional properties of the protein concentrate from Chinese jujube seeds (ZPI). The amino acid composition was also determined and compared with the FAO/WHO pattern. In addition, the properties of ZPI were compared with those of soybean protein concentrate (SPI), a widely used protein source from plant.
Material and Methods
Materials Chinese jujube seeds (Ziziphus jujube Mill.) were obtained from Henan Haoxiangni Co., Ltd. Dried soybean (Glycine max) seeds were obtained from the local market. All reagents used in the present study were of analytical grade or better grade.
Preparation of seed protein concentrate About 1.0 kg of jujube seeds or soybean seeds were soaked in distilled water overnight and homogenized in four volumes of an aqueous buffer (50 mM phosphate buffered saline (PBS), 1% polyvinylpolypyrrolidone, pH 9.0) using a Waring blender. The slurry was centrifuged at 12,000 × g for 15 min to separate the insoluble material. The supernatant was adjusted to 30% (NH4)2SO4 and stored for 3 h at 4°C followed by the addition of (NH4)2SO4 to make a final concentration of 70%. After 3 h at 4°C, the supernatant was centrifuged at 12,000 × g for 30 min. The pellet thus obtained was resuspended in distilled water and then dialyzed against distilled water twice prior to freeze-drying. For subsequent analyses, dry protein concentrate flours were packed in plastic bags, sealed and stored in an airtight box. The protein content and chemical compositions of ZPI and SPI were determined as previously described (Kjeldahl, 1986) and the Association of Official Analytical Chemists (AOAC, 1984) procedures, respectively.
Sodium dodecyl sulfate-polyacrylamide gel electrophoresis (SDS-PAGE) SDS-PAGE was performed on a discontinuous buffered system according to the reported method (Laemmli, 1970) using 15% separating gel and 5% stacking gel. Protein samples (∼10 µL) were suspended in 50 µL water to which was added 100 µL of sample buffer containing 25% glycerol, 12.5% 0.5 M Tris-HCl, pH 6.8, 2% SDS, 1% bromphenol blue, and 5% β-mercaptoethanol. After the solution was boiled for 5 min, the supernatant was concentrated by centrifugation at 10,000 × g for 10 min. Before the sample entered the separating gel, electrophoresis was performed at 12 mA, and afterwards it was performed at 18 mA. The gel was stained with 0.25% Coomassie Brilliant Blue (G-250) in 10% acetic acid [methanol/acetic/water, 500:100:400 (v/v/v)] and destained in 10% acetic acid [methanol/acetic/water, 300:100:600 (v/v/v)].
Amino acid composition analyses Amino acid analysis of ZPI was measured by the reported procedure (Marcone et al., 1997). ZPI was hydrolyzed with 1 – 2 mL of 6 M HCl containing 10 mM phenol and 0.2% (v/v) β-mercaptoethanol for 20 h at 110°C under a nitrogen atmosphere. After the removal of HCl, the amino acid composition was determined using HPLC (Agilent 1100, Santa Clara, CA, USA). The amino acid tryptophan was not determined.
Free sulfhydryl (SH) content The SH content was determined as previously described (Beveridge et al., 1974). Briefly, about 8 mg of each protein sample was solubilized in 8 mL of 0.086 M Tris buffer (pH 8.0), containing 0.09 M glycine, 0.004 M EDTA, and 8 M urea. One milliliter of protein solutions was then mixed with 40 mL of Ellman's reagent (4 mg/mL in methanol). The absorbance of the mixture was measured at 412 nm in a UV-vis spectrophotometer (Shanghai JINMI Science Instrument Co. Ltd., China), and the buffer with the same volume was used as the blank. The values of SH content were obtained by dividing the absorbance value by the molar extinction coefficient of 13,600 M−1cm−1. Each sample was determined in triplicate.
Particle size analyses The particle size (nm) of single solutions measurements was carried out with a Delsa-Nano Particle Analyzer (Beckman Coulter Inc., Brea, CA, USA). Each measurement was obtained from the average of three readings. The pH values of a series of solutions (10 mg/mL) were adjusted from 2.0 to 9.0 with 1.0 M HCl or 1.0 M NaOH, followed by measurements. Each experiment was repeated at least three times for all samples (Jiang et al., 2010).
Protein solubility (PS) PS was determined according to the reported method (Tomotake et al., 2002) with some modifications. Typically, protein dispersions (1.0%, w/v) were prepared in 0.05 M phosphate buffer adjusted to pH 2.0 – 10.0. To achieve desirable pH above 10, the dispersion was adjusted directly using 1.0 M NaOH. For total soluble protein content (control), the samples were dispersed in 0.1 M NaOH. The protein dispersions were stirred at ambient temperatures for 30 min, centrifuged (10,000 × g for 30 min), and filtered through filter paper. The protein content of the filtrate was determined according to the reported method (Bradford 1976) using bovine serum albumin as a standard sample. Protein solubility was calculated as PS (%) = (the protein content of sample/the protein content of control) × 100%. Each measurement was carried out in triplicate.
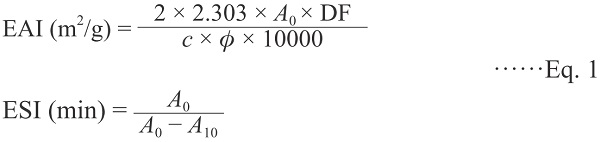
Emulsifying activity index (EAI) and emulsion stability index (ESI) EAI and ESI of the samples were determined as previously described (Pearce and Kinsella, 1978; Tang et al., 2005). For the emulsion formation, 6.0 mL of 0.2% ZPI or SPI dispersion in 0.05 M phosphate buffer adjusted to pH 7.0 and 2.0 mL of soybean oil were homogenized in the T10 basic homogenizer (ART Company, Müllheim, German) for 1 min at the maximum velocity. Fifty microliters of emulsion was taken from the bottom of the homogenized emulsion immediately (0 min) or 10 min after homogenization and diluted (1:100, v/v) in 0.1% (w/v) SDS solution. After shaking in a vortex mixer for about 5 s, the absorbance of diluted emulsions was read at 500 nm in the spectrophotometer. EAI and ESI values were calculated by the following equations:
where DF is the dilution factor (100),
c is the initial concentration of protein (g/mL),
φ is the fraction of oil used to form the emulsion (0.25), and
A0 and
A10 are the absorbance of the diluted emulsions at 0 and 10min. Measurements were performed in triplicate.
Water holding capacities (WHC) and fat absorption capacities (FAC) WHC and FAC was determined according to the reported method (Tomotake et al., 2002) with minor modifications. Two grams of sample was weighed into 25.0 mL preweighed centrifuge tubes. For each sample, the 15 mL deionized water was added in small increments to a series of tubes under continuous stirring with a glass rod. After the mixture was thoroughly wetted, samples were centrifuged (5,000 × g for 30 min). After centrifugation, the supernatant in the test tube was decanted and the volume measured. WHC (grams of water per gram of protein) was calculated as WHC = (W2 − W1)/W0, where W0 is the Weight of the dry sample (g), W1 is the weight of the tube plus the dry sample (g), and W2 is the weight of the tube plus the sediment (g). Each sample was determined in triplicate.
For FAC, 0.5 g of sample was weighed into 25.0 mL preweighed centrifuge tubes, and thoroughly mixed with 5.0 mL of sesame oil. After the protein-oil mixture was centrifuged at 5,000 × g for 30 min, the supernatant was carefully removed, and the tubes were weighed. FAC (grams of oil per gram of protein) was calculated as FAC = (F2 − F1)/F0, where F0 is the weight of the dry sample (g), F1 is the weight of the tube plus the dry sample (g), and F2 is the weight of the tube plus the sediment (g). Each sample was determined in triplicate.
Differential scanning calorimetry (DSC) The thermal denaturation of ZPI was examined using a TA Q100-DSC thermal analyzer (TA Instruments, New Castle, DE, USA), according to the reported procedure (Meng and Ma, 2001) with some modifications. Approximately 2.0 – 3.0 mg protein samples were accurately weighed into aluminum liquid pans, and 10.0 µL of 0.05 M phosphate buffer (pH 7.0) was added. The pans were hermetically sealed and heated from 20 to 110°C at a rate of 5°C/min. A sealed empty pan was used as a reference. Peak or denaturation temperature (Td) of different protein components and enthalpy of denaturation (ΔH), were computed from the thermograms by the Universal Analysis 2000, version 4.1D (TA Instruments-Waters LLC, New Castle, Delaware, USA).
Gelation properties Gelation properties were investigated, using the reported method (Coffman and Garcia, 1977). Sample suspensions of 2 – 20% were prepared in 0.05 M phosphate buffer (pH 7.0). Ten mL of each of the prepared dispersions was transferred into a test tube. It was heated in a boiling water bath for 1 h, followed by rapid cooling in a bath of cold water. The test tubes were further cooled at 4°C for 2 h. The least gelation concentration was determined as the concentration when the sample from the inverted test tube did not slip or fall.
Statistical analysis Data were analyzed by analysis of variance (ANOVA) using the general linear model (Version 8.0; SAS Institute Inc., Cary, NC, USA). Duncan's multiple range test was used to determine the differences among samples. Significant levels were defined as probabilities of 0.05 or less. All treatments were triplicated.
Results and discussion
Composition analyses of Chinese jujube (Ziziphus jujube Mill.) seeds protein concentrate (ZPI) Because SPI is the most typical and popular protein source from plant, in this study the property of ZPI was compared with that of soybean seed protein concentrate (SPI). Proximate composition of ZPI was determined with SPI as a control sample. ZPI was composed of (83.24 ± 0.25)% protein, (5.67 ± 0.03)% moisture, (3.46 ± 0.02)% ash, and (7.63 ± 0.03)% others (mainly carbohydrate), while SPI consisted of (84.85 ± 0.42)% protein, (5.18 ± 0.04)% moisture, (3.39 ± 0.03)% ash, and (6.58 ± 0.05)% others (mainly carbohydrate). Thus, ZPI and SPI are very similar in protein content.
The SDS-PAGE profiles of ZPI and SPI were shown in Fig. 1. In the presence of reducing agent β-mercaptoethanol (2-ME), ZPI and SPI showed similar protein constituents, which were separated in SDS-PAGE (Fig. 1, lanes 1 and 2). Very similar results were obtained with protein samples from three different protein preparations/purifications with ZPI and SPI, indicating that the observed SDS-PAGE profiles are not sample-dependent. Like SPI where glycinin consisting of acidic (AS) and basic (BS) polypeptides is a major component, ZPI also contains AS and BS with molecular weight (MW) of about 26 – 33.0 and 10 – 14.0 kDa, respectively, and both AS and BS are composed of three subunits (Fig. 1). Consistent with present observation, previous studies using crystallographic techniques showed that edestin resembled the hexamer of soy glycinin, whose subunit consists of AS and BS polypeptides linked by one disulfide bond (Patel et al., 1994).
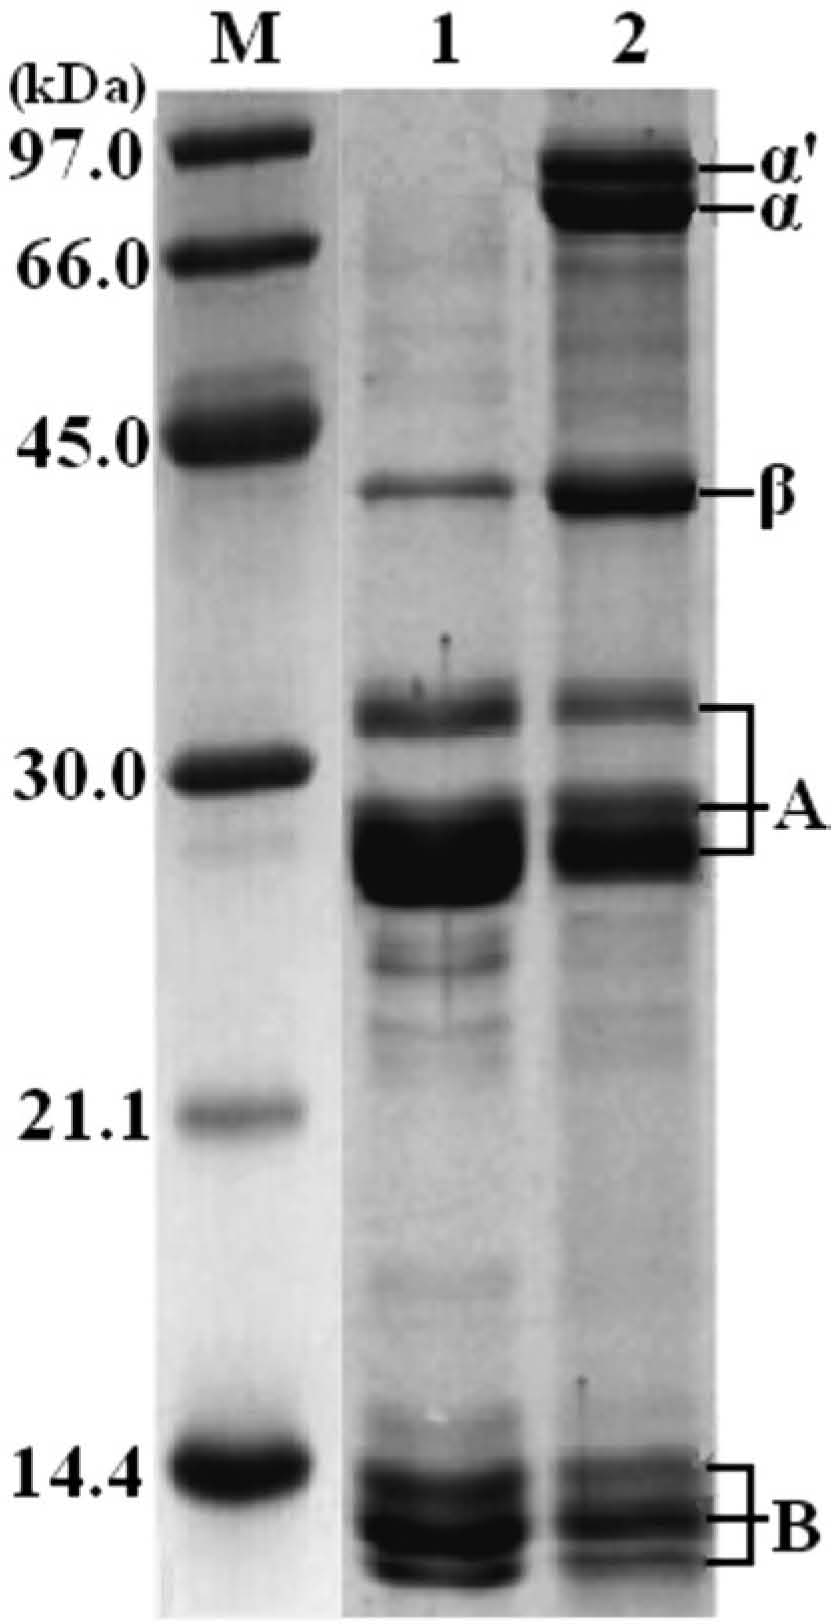
Besides the bands of the presumed acidic and basic polypeptides of ZPI, an obvious band at about 43.0 kDa was visualized (Fig. 1, lanes 1), which was similar to the β-subunit of β-conglycinin; however, other major subunits similar to α and α′-subunits of β-conglycinin were completely absent in ZPI.
Amino acids composition Amino acid composition of ZPI was analyzed and summarized in Table 1. Results indicated that a relatively high content of Glu, Asp and Arg was found in the ZPI, a result similar to SPI (Marcone et al., 1988a, b). The percentage of these three amino acids (Glu, Asp, and Arg) in the ZPI are 14.34%, 9.42%, 11.78%, which are similar to that in SPI (21.29% for Glu, 11.81% for Asp, and 7.57% for Arg), suggesting that these two proteins coming from different food resources may have similar function and structure. A comparable level of other amino acids was also shown in Table 1. Like other legume proteins, ZPI is also low in sulfur-containing amino acids such as methionine (∼1.32%) and cysteine (∼0.18%). Acidic, basic, uncharged polar and hydrophobic amino acids accounted for (23.76 ± 0.06)%, (17.67 ± 0.03)%, (38.00 ± 0.08)%, and (38.02 ± 0.04)%, respectively, of the total protein.
Table 1.
A comparison of amino acid composition of ZPI
a and SPI
b (mole amino acid/100 mol protein)
| Amino acid |
Molar percentage (%) for ZPI |
Molar percentage (%) for SPI |
| Asp |
9.42 ± 0.03 |
11.81 |
| Glu |
14.34 ± 0.05 |
21.29 |
| Ser |
7.93 ± 0.03 |
5.48 |
| Gly |
4.68 ± 0.15 |
3.86 |
| Hisc |
3.05 ± 0.01 |
2.9 |
| Arg |
11.78 ± 0.03 |
7.57 |
| Thrc |
3.24 ± 0.04 |
4.1 |
| Ala |
2.78 ± 0.02 |
3.83 |
| Pro |
6.73 ± 0.12 |
5.29 |
| Tyrc |
3.34 ± 0.06 |
3.71 |
| Valc |
3.94 ± 0.15 |
4.41 |
| Ilec |
4.25 ± 0.04 |
4.48 |
| Leuc |
8.91 ± 0.16 |
7.0 |
| Metc |
1.32 ± 0.02 |
0.93 |
| Cys |
0.18 ± 0.07 |
0.06 |
| Phec |
6.73 ± 0.06 |
5.3 |
| Lysc |
2.84 ± 0.02 |
5.39 |
It is noteworthy that ZPI contains all the essential amino acids (EAAs). The percentage of EAAs in total amino acids is about 37.62%, and the ratio of EAAs to non-EAAs is ∼0.60. Among them, leucine, phenylalanine, and isoleucine are abundant, accounting for 8.91%, 6.73% and 4.25% of the total amino acids of ZPI, respectively. The EAAs profile of the ZPI (Table 2) reveals that the levels of EAAs are comparable with those of the FAO/WHO amino acid reference pattern (WHO, 1973) established for humans. The total EAAs content of ZPI (395.05 mg/g protein, including cysteine and tyrosine) is higher than those of the FAO/WHO pattern (350 mg/g protein). According to the amino acid scores, the first limiting amino acids of ZPI are methionine and cysteine, and the second is lysine, followed by valine, whereas the contents of other EAAs are higher than the reference values recommended by FAO/WHO. Thus, ZPI appears to have a high nutritional value due to its well-balanced amino acid composition and high arginine content, and it could serve as an alternative dietary supplement of protein and amino acids.
Table 2.
Essential amino acid composition of ZPI
a compared with the FAO/WHO pattern
b (mg/g protein)
| Amino acid |
ZPI |
FAO/WHO pattern |
Amino acid scores |
| Isoleucine |
42.81 ± 0.23 |
40 |
1.07 ± 0.005 |
| Leucine |
89.63 ± 0.34 |
70 |
1.28 ± 0.006 |
| Lysine |
31.89 ± 0.12 |
55 |
0.58 ± 0.002 |
| Methionine+cysteine |
16.80 ± 0.15 |
35 |
0.48 ± 0.012 |
| Phenylalanine+tyrosine |
131.86 ± 0.76 |
60 |
2.20 ± 0.016 |
| Threonine |
46.48 ± 0.27 |
40 |
1.16 ± 0.004 |
| Valine |
35.45 ± 0.14 |
50 |
0.71 ± 0.002 |
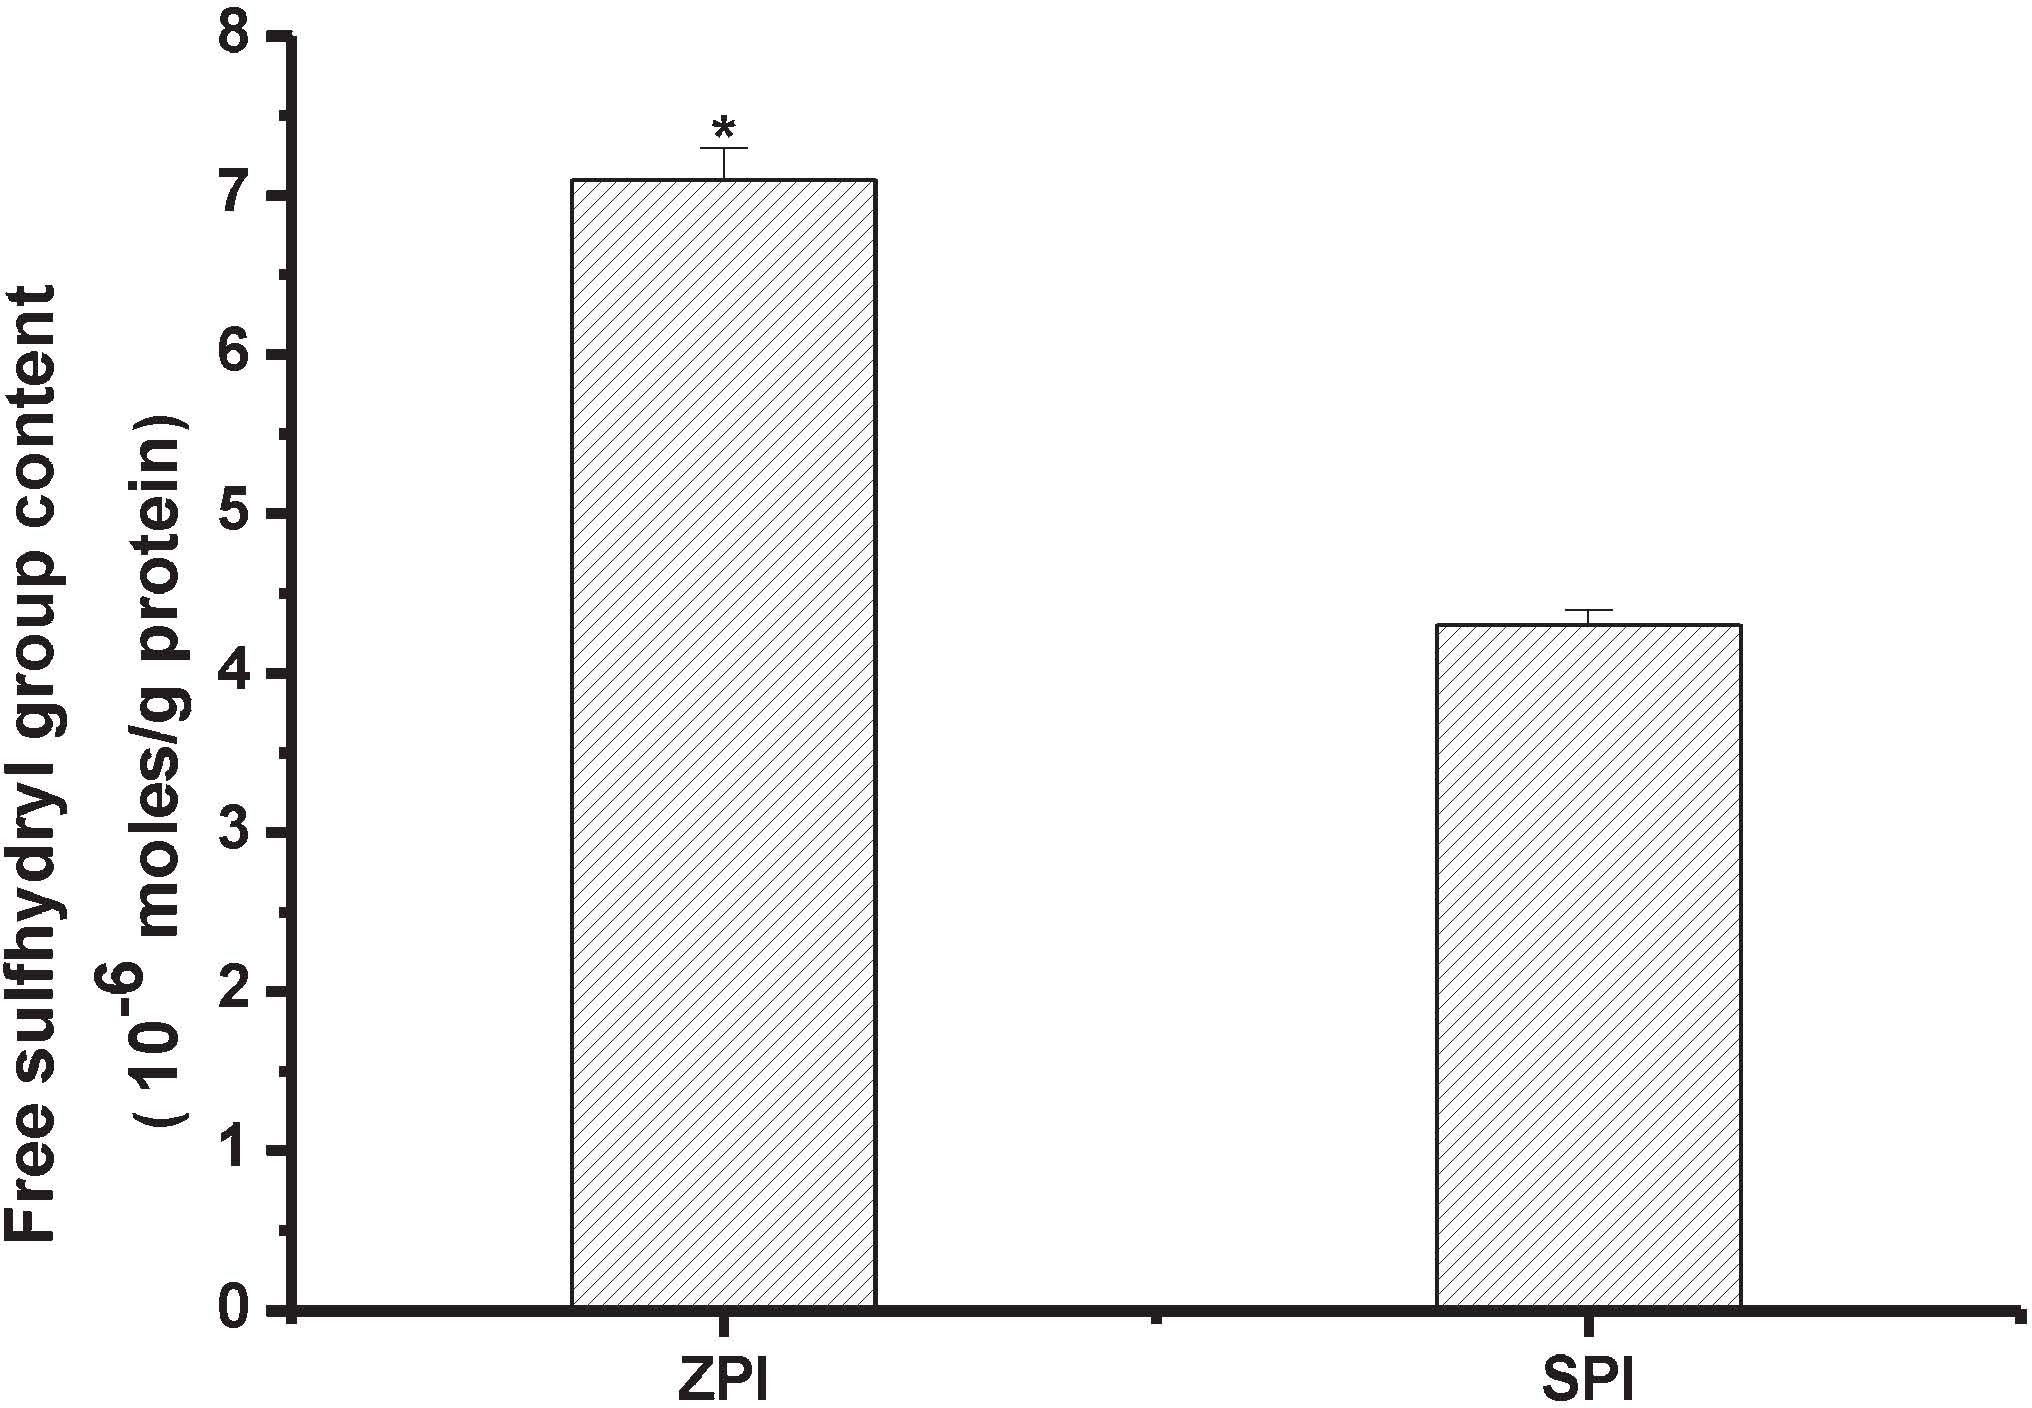
Free sulfhydryl (SH) content Figure 2 shows the free SH contents of ZPI and SPI at pH 8.0. The free SH content of ZPI (about 7.1 × 10⁻⁶ mol/g of protein) is significantly higher than that of SPI (P < 0.01). This result is in good agreement with the above mentioned methionine and cystine contents of ZPI and SPI (Table 1). Typically, proteins with high SH contents have a tendency to aggregate due to the formation of covalent disulphide bonds.
Particle size analysis Effect of pH on the size of ZPI particles was illustrated by means of light scattering, where the measured size was named as hydrodynamic size containing the size of water molecules layer adsorbed on the surface of the particles. The hydrodynamic size of ZPI particles reaches a maximum value (about 2041 nm) around pH 3.5 (Fig. 3a). It has been established that the increase in particle size is due to the protein flocculation caused by the disulfide linkages, intermolecular hydrogen bonds and van der Waals attractive force (Stading and Hermansson, 1990). As with ZPI, we believe that the isoelectric point (pI) of ZPI is around 3.5, at which protein association occurs mainly through van der Waals attractive force. Consistent with this idea, with increasing pH to 4.0 (a pH value higher than pI), ZPI particle sizes decrease quickly to 940 nm possibly due to electrostatic exclusion. Similarly, at pH ≥ 4.5, the hydrodynamic size of ZPI particles continued to decrease to around 460 nm. Upon the addition of 20 mM NaCl to ZPI, the protein particle size was first increased followed by a decrease with increasing pH from 2.0 to 9.0. Under such experimental conditions, ZPI particles have a maximal size likewise at around pH 3.5 (2846 nm). The presence of NaCl promotes the aggregation of the ZPI particles. This phenomenon is most likely derived from salting out effect. This effect is primarily a result of the competition between the added NaCl and the dissolved ZPI protein solutes for water molecules. At 20 mM of NaCl, so many of added ions are solvated that there is significantly less bulk solvent available to ZPI proteins.
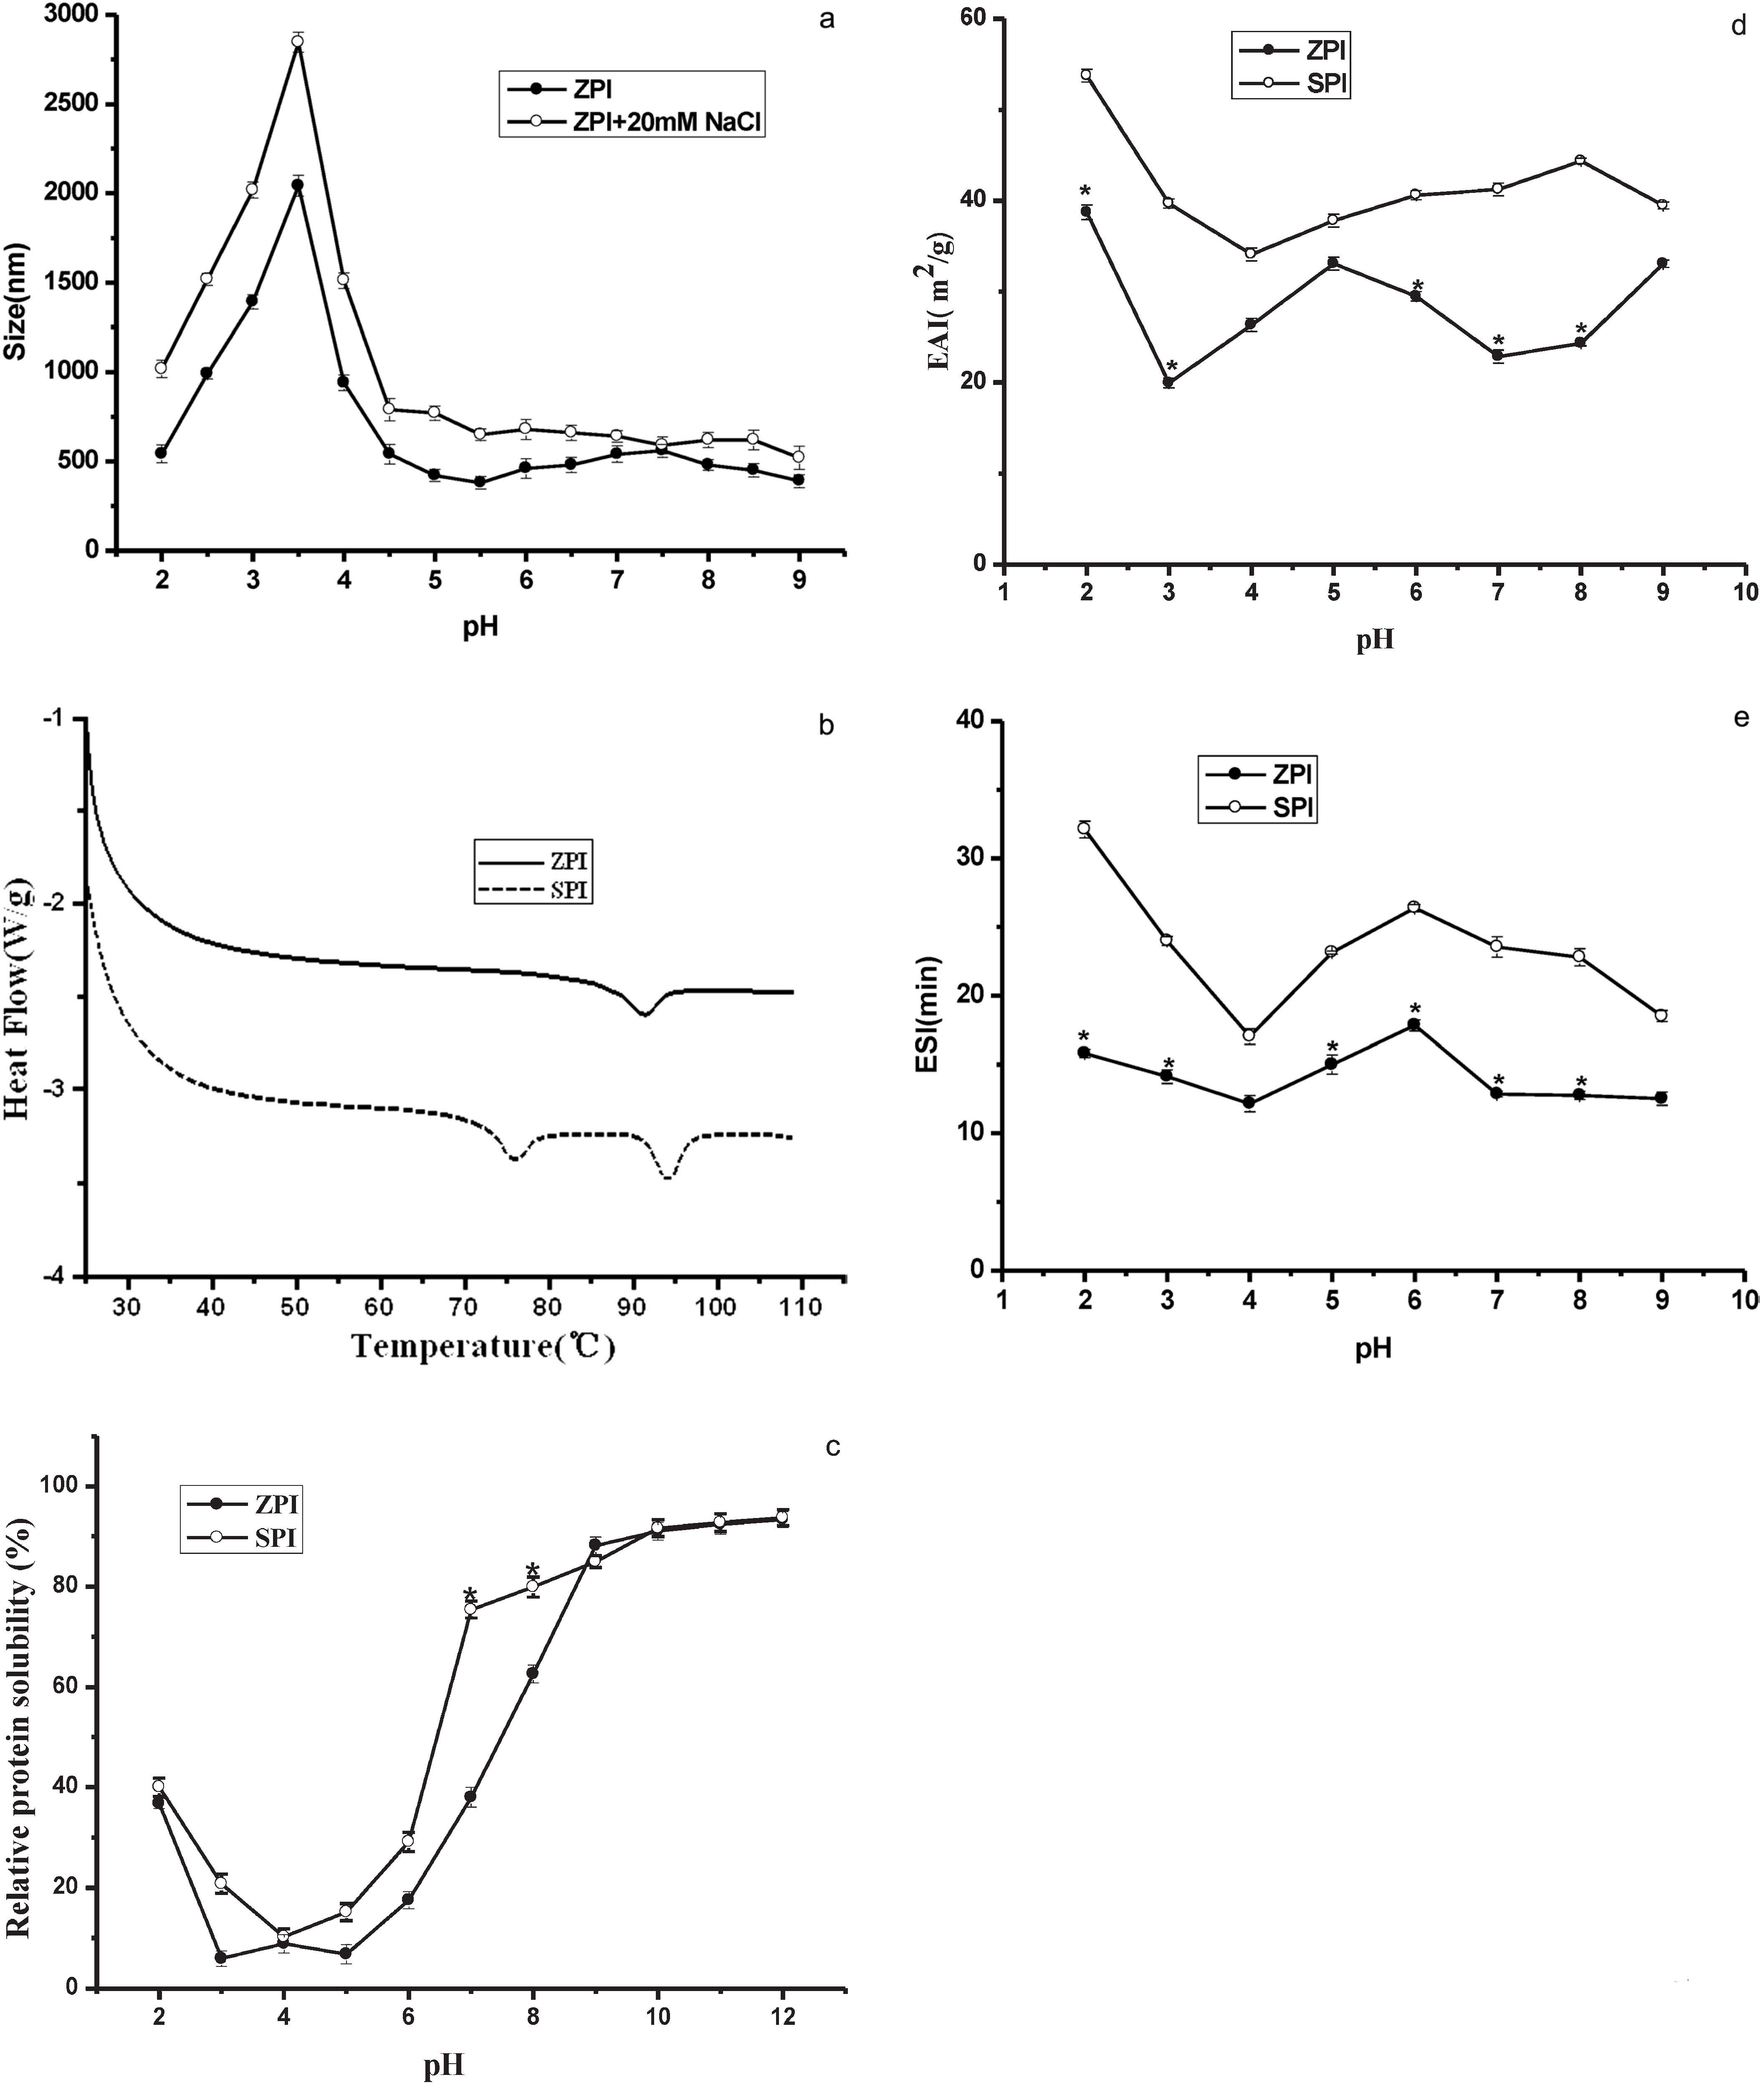
DSC characteristics Figure 3b shows the DSC profiles of ZPI and SPI, and their DSC characteristics are summarized in Table 3. SPI presented two endothermic peaks which represent the 7S and 11S components of SPI respectively, and the thermal denaturation temperature (Td) were about 76°C and 94°C, respectively. Consistent with present observation, nearly the same result was reported previously (Molina et al., 2002). However, ZPI presented a single endothermic peak with the thermal denaturation temperature (Td) of about (91.25 ± 0.34)°C, indicative of only one major protein component for ZPI. This result is supported by SDS-PAGE analyses (Fig. 1) showing that ZPI lacked the α and α′-subunits of 7S. Denatureation temperature (Td), denatureation enthalpy (ΔH), and half peak height of endothermic peak (ΔT1/2) reflect the thermal stability, the extent of ordered structure of a protein, and cooperativity of protein denaturetion, respectively (Koshiyama et al., 1981). Table 3 shows that Td, ΔH and ΔT1/2 of ZPI are significantly lower than those of SPI (P < 0.05). Such difference in thermal stability between ZPI and SPI is most likely due to their difference in subunit composition as shown in Figure 1. However, other possibility cannot be excluded. A detailed mechanism is under investigation.
Table 3.
Thermal characteristics of ZPI and SPI
†
| Samples |
T0 (°C)‡ |
Td (°C)‖ |
ΔH (J/g)£ |
ΔT1/2 (°C)¶ |
| ZPI |
88.16 ± 0.56b |
91.25 ± 0.34b |
9.45 ± 0.42b |
6.34 ± 0.43b |
| SPI§ |
91.34 ± 0.27a |
94.83 ± 0.51a |
13.35 ± 0.27a |
7.51 ± 0.35a |
† Means ± standard deviations of triplicate determinations. The different letter in the same column for the same fraction are significantly different (
P < 0.05).
‖ Denaturation temperature;
¶ Within at half peak height of endothermic peak;
§ Thermal characteristics of the second peak.
Protein solubility (PS) The protein solubility (PS) of ZPI was minimum at pH in the range of 3.0 – 5.0 and increased gradually below pH 3.0 and above pH 5.0 (Fig. 3c). At pH 7.0, only about 38% of protein was solubilized in 0.01 M phosphate buffer. However, at above pH 9.0, the PS increased up to more than ∼88%. The data suggest that ZPI is a kind of typical alkali-soluble protein. The underlying mechanism of solubilization at alkaline pH (especially at pH > 10.0) may be related to the dissociation of the quaternary structure due to the negative charge.
SPI had a similar PS profile, but the PS of SPI was higher than that of ZPI at pH less than 9.0 (Fig. 3c). SPI had an isoelectric point at about pH 4. At pH above 9.0, the PS of ZPI was similar to that of SPI. The difference in PS at pH < 7.0 may be attributed to differences of protein constituents and aggregation extent. The high content of cystine residues in ZPI (Table 1) may result in an increase in the formation of disulfide bonds between individual molecules, thus enhancing the extent of protein aggregation. In general, the solubility profile of ZPI is similar to the isolates or globulins of chick pea (Sanchez-Vioque et al., 1999), soy protein (Achouri et al., 1998), cowpea (Prinyawiwatkul et al., 1997), peanut (Beuchat, 1977) and lentil (Bora, 2002).
Emulsifying activities The emulsifying activity index (EAI) and emulsion stability index (ESI) of ZPI and SPI as a function of pH are shown in Figs. 3d and 3e. At any tested pH value (pH 2.0 – 9.0), the EAI of ZPI was significantly lower than that of SPI (P < 0.05). The ESI of ZPI was nearly unchanged in the range of pH 2.0 – 9.0. However, the ESI values at most pH values were significantly lower than those of SPI (P < 0.05) (Fig. 3e), indicating that the emulsifying activities of ZPI are lower as compared with those of SPI. It has been established that the conformation stability of proteins plays an important role in their emulsifying activities, and that intramolecular disulfide bonds have a great effect on the protein conformation. Based on the above results showing that ZPI contains much more free SH group than SPI, therefore it is reasonable to believe that the conformation stability of ZPI is lower than that of SPI, thereby resulting in its poorer emulsifying activity.
Water holding and fat absorption capacities (WHC and FAC) The WHC of ZPI was significantly lower than that of SPI (P < 0.05), but the FAC of ZPI was almost the same as that of SPI (Table 4), this observation in agreement with previous studies (Ahmedna et al., 1999). The relatively poor WHC of ZPI may be attributed to the severe extent of protein aggregation at neutral pH, since the polar groups of proteins would be buried in the interior of the aggregates. The comparative FAC values of ZPI and SPI suggest that these two proteins have similar surface hydrophobicity, since FAC can reflect the ability of the hydrophobic groups of proteins to interact with the lipids.
Table 4.
Water Holding and Fat Absorption Capacities of ZPI and SPI
| Samples |
WHC |
FAC |
| ZPI |
4.36 ± 0.17b |
4.79 ± 0.05a |
| SPI |
5.75 ± 0.05a |
4.96 ± 0.14a |
Results are given as the average of triplicate determinations ± standard deviation. Within the same column, different letters (a, b) indicate significant difference (P < 0.05).
Gelation properties Because food systems are mostly neutral, and ZPI has a lower solubility in partially acid conditions (Fig. 3c), the gelation property of ZPI is studied only at pH 7.0 as shown in Table 5. Using the least gelation concentration (LGC) as the index of gelation capacity, low LGC means better gelation property. At pH 7.0, the LGC of ZPI is 8% (w/v), which is significantly lower than that of SPI (12%). Due to the high SH content of ZPI (Fig. 2), ZPI may be more prone to form disulfide crosslinks after thermal treatment. Typically, proteins with high SH contents have stronger ability to associate or aggregate with themselves.
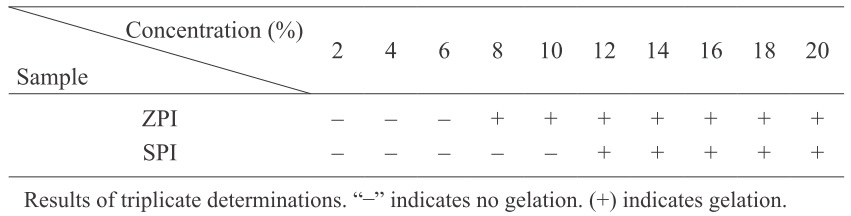
Table 5.
Effects of protein concentration on gelation of ZPI and SPI at pH 7.0
Conclusions
ZPI has an essential amino acid composition similar to SPI, and most of essential amino acids are sufficient for the FAO/WHO pattern. The gelation capacity of ZPI is better than that of SPI, while ZPI exhibits poorer protein solubility, emulsifying activities, and water holding capacity than SPI. Different from SPI, ZPI was obtained from jujube processing wastes, so it represents a new protein source. In future study, it will be essential to monitor conformational and structural changes in the proteins of ZPI due to various processing conditions during food manufacturing, because such changes could be either beneficial or detrimental in terms of the nutritional or functional properties of the processed food systems.
Acknowledgments This project was supported by the National Science and Technology Support Program (2011BAD23B04) and National Natural Science Foundation of China (31101251).
References
- Achouri, A., Zhang, W., and Shying, X.U. (1998). Enzymatic hydrolysis of soy protein isolate and effect of succinylation on functional properties of resulting protein hydrolysates. Food Res. Int., 31, 617-623.
- Ahmedna, M., Prinyawiwatkul, W., and Rao, R.M. (1999). Solubilized wheat protein isolate: functio- nal properties and potential food applications. J. Agric. Food Chem., 47, 1340-1345.
- AOAC (Association of Official Analytical Chemists). (1984). Official methods of analysis. In Washington, DC: Association of Official Analytical Chemists.
- Beuchat, L.R. (1977). Functional and electrophoretic characteristics of succinylated peanut flour protein. J. Agric. Food Chem., 25, 258-261.
- Beveridge, T., Toma, S.J., and Nakai, S. (1974). Determination of SH- and SS-groups in some food proteins using Ellman's reagent. J. Food Sci., 39, 49-51.
- Bora, P.S. (2002). Functional properties of native and succinylated (Lens culnaris) globulin. Food Chem., 77, 1271-1276.
- Bradford, M.M. (1976). A rapid and sensitive method for the quantitation of microgram quantities of protein utilizing the principle of protein-dye binding. Anal. Biochem., 72, 248-254.
- Coffman, C.W. and Garcia, V.V. (1977). Functional properties and amino acid content of protein isolate from mung bean flour. Int. J. Food Sci. Tech., 12, 473-484.
- Jiang, Y.F., Li, Y.X., Chai, Z., and Leng, X.J. (2010). Study of the physical properties of whey protein isolate and gelatin composite films. J. Agric. Food Chem., 58, 2125-2129
- Kjeltec. (1986). Instruction No.1000-0689. Klippan: Prabin and Co AB
- Koshiyama, I., Hamano, M., and Fukushima, D. (1981). A heat denaturation study of the 11S globulin in soybean seeds. Food Chem., 6, 309-322.
- Laemmli, U.K. (1970). Cleavage of structural proteins during the assembly of the head of bacteriophage T4. Nature, 227, 680-685.
- Li, J., Ding, S., and Ding, X. (2005). Comparison of antioxidant capacities of extracts from five cultivars of Chinese jujube. Process Biochem., 40, 3607-3613.
- Li, J.W., Fan, L.P., Ding, S.D., and Ding, X.L. (2007). Nutritional composition of five cultivars of Chinese jujube. Food Chem., 103, 454-460.
- Marcone, M.F., Kakuda, Y., and Yada, R.Y. (1988a). Salt-soluble seed globulins of various dicotyledon- ous and monocotyledonous plants. I. Isolation/purification and characterization. Food Chem., 62, 27-47.
- Marcone, M.F., Kakuda, Y., and Yada, R.Y. (1988b). Salt-soluble seed globulins of various dicotyledon -ous and monocotyledonous plants. II. Isolation/purification and characterization. Food Chem., 63, 265-274.
- Marcone, M.F., Yada, R.Y., Aroonkamonsri, W., and Kakuda, Y. (1997). Physicochemical properties of the purified isoforms of the “12S” seed globulin from mustard seed. Biosci. Biotech. Biochem., 61, 65-74.
- Meng, G.T. and Ma, C.Y. (2001). Thermal properties of Phaseolus angularis (red bean) globulin. Food Chem., 23, 453-460.
- MOA (Ministry of Agriculture of the People's Republic of China). (2009). MOA Statistical database. [Online]. Available: http://www.agri.gov.cn/sjzl/2008/109.htm.
- Molina, E., Defaye, A.B., and Ledward, D.A. (2002). Soy protein pressure-induced gels. Food Hydrocoll., 16, 625-632.
- Mukhtar, H.M., Ansari, S.H., Ali, M., and Naved, T. (2004). New compounds from Zizyphus vulgaris. Pharm Biol., 42, 508-511.
- Patel, S., Cudney, R., and McPherson, A. (1994). Crystallographic characterization and molecular symmetry of edestin, a legumin from hemp. J. Mol. Biol., 235, 361-363.
- Pearce, K.N. and Kinsella, J.E. (1978). Emulsifying properties of proteins: evaluation of a turbidietric technique. J. Agric. Food Chem., 26, 716-723.
- Prinyawiwatkul, W., Beuchat, L.R., McWatters, K.H., and Phillips, R.D. (1997). Functional properties of cowpea (Vigna unguiculata) flour as affected by soaking, boiling and fungal fermentations. J. Agric. Food Chem., 45, 480-486.
- Sanchez-Vioque, R., Clement, A., Vioque, J., Bautista, J., and Millan, F. (1999). Protein isolate from chickpea (Cicer arietinum L.): Chemical composition, functional properties and protein characterization. Food Chem., 64, 237-243.
- Schieber, A., Stintzing, F.C., and Carle, R. (2001). By-products of plant food processing as a source of functional compounds-recent developments. Trends Food Sci. Tech., 11, 401-413.
- Shewry, P.R., Napier, J.A., and Tatham, A.S. (1995). Seed storage proteins: structures and biosynthesis. Plant Cell, 7, 945-956.
- Stading, M. and Hermansson, A.M. (1990). Viscoelastic behaviour of β-lactoglobulin structures. Food Hydrocoll., 4, 121-135
- Su, P.X. and Liu, X.M. (2005). Photosynthetic characteristics of linze jujube in conditions of high temperature and irradiation. Sci. Hortic., 104, 339-350.
- Tang, C.H., Yang, X.Q., Chen, Z., Wu, H., and Peng, Z.Y. (2005). Physicochemical and structural properties of sodium caseinate biopolymers induced by microbial transglutaminase. J. Food Biochem., 29, 402-421.
- Tomotake, H., Shimaoka, I., Kayashita, J., Nakajoh, M., and Kato, N. (2002). Physicochemical and functional properties of buckwheat protein product. J. Agric. Food Chem., 50, 2125-2159.
- Wang, M., Hettiarachchy, N.S., Qi, M., Burks, W., and Siebenmorgen, T. (1999). Preparation and functional properties of rice bran protein isolate. J. Agric. Food Chem., 47, 411-416.
- WHO (World Health Organization). (1973). Energy and protein requirements. Report of a joint FAO/WHO ad hoc expert committee. Technical report series 522. Geneva.