Abstract
To evaluate the suppressive effects of green rooibos (Aspalathus linearis) unfermented tea on postprandial hyperglycemia, we orally administered four carbohydrates with or without green rooibos extract (GRE) and its major flavonoid aspalathin (Asp). GRE significantly suppressed the elevation of blood glucose levels after glucose, maltose, and starch intake. Asp also lowered the levels for all four carbohydrates. To clarify the mechanism underlying these results, we performed an intraperitoneal glucose tolerance test (IPGTT) and measured the ability of GRE and Asp to inhibit the activities of carbohydrate-hydrolyzing enzymes in vitro. In IPGTT, GRE and Asp did not show suppressive effects on blood glucose, while they dose-dependently inhibited the activities of α-glucosidase and α-amylase in vitro. These results showed that GRE and Asp suppress the elevation of blood glucose levels. It was indicated that these effects may result from the suppression of glucose absorption and the inhibition of carbohydrate-hydrolyzing enzyme activities by GRE and Asp.
Introduction
Rooibos (Aspalathus linearis) is a leguminous shrub native to Cederberg mountain, South Africa. Its leaves and stems are fermented, and their aqueous infusion is consumed as “rooibos tea,” which is red-colored and caffeine-free, and has a low tannin content (Morton, 1983). Rooibos tea contains various flavonoids (Krafczyk and Glomb, 2008) and has been reported to show anti-oxidant (Fukasawa et al., 2009, Joubert et al., 2012), anti-inflammatory (Baba et al., 2009), and anti-mutagenic (Snijman et al., 2007) effects.
On the other hand, unfermented rooibos tea, known as “green rooibos tea”, has been the focus of research because it contains higher levels of flavonoids and polyphenols than fermented rooibos tea, in which flavonoids and polyphenols are degraded and form dimers by oxidation during the fermentation process (Krafczyk et al., 2009, Heinrich et al., 2012). In particular, aspalathin (Asp), a major flavonoid in rooibos, is present at twice the level in unfermented compared to fermented tea (Bramati et al., 2002, Bramati et al., 2003). Asp is a dihydrochalcone-C-glucoside and has been reported to ameliorate hyperglycemia (Kawano et al., 2009, Muller et al., 2012, Son et al., 2013). Therefore, unfermented rooibos tea containing high levels of Asp is of great interest as a food material to promote human health.
Diabetes is a major lifestyle-related disease that is currently rapidly spreading throughout the world. According to the International Diabetes Federation (IDF) Diabetes Atlas 2012, it is estimated that more than 371 million people have diabetes, and the number is increasing in every country. Diabetes includes a group of diseases that are characterized mainly by hyperglycemia and a deficiency or resistance to the action of insulin. In the early stage of diabetes, rapid increases in blood glucose levels, particularly in the postprandial phase, are typical and frequent events (Ceriello, 2003). Postprandial hyperglycemia is linked to the onset of diabetic complications such as neural disorders, nephropathy, retinopathy, and cardiovascular and cerebrovascular diseases. In addition, carbohydrate intake has a direct effect on postprandial glucose levels in people with diabetes (Franz et al., 2010), and the consumption of a high-carbohydrate diet causes the elevation of postprandial hyperglycemia, progressing to full symptomatic type 2 diabetes (Gerrits and Tsalikian, 1993). Therefore, controlling postprandial glycemia after carbohydrate intake is one strategy in the prevention and improvement of diabetes and its complications.
For treating postprandial hyperglycemia, oral hypoglycemic drugs such as short-acting insulin secretagogues and α-glucosidase inhibitors are used. Recently, the focus has been on functional food materials such as guava leaves extract (Deguchi et al., 1998), wheat albumin (Kodama et al., 2005), indigestible dextrin (Wakabayashi et al., 1995, Wakabayashi et al., 1999), etc., as candidates to prevent or improve postprandial hyperglycemia.
In addition to these functional food components, green rooibos and Asp were reported to improve hyperglycemia in a mouse model of type 1 diabetes by Muller et al. (2012) and in type 2 diabetes by Kawano et al. (2009) and Son et al. (2013). However, there has been no report concerning the suppressive effects of green rooibos and Asp on postprandial hyperglycemia in a non-diabetic model. Therefore, we investigated the effects of green rooibos extract (GRE) and its component Asp on postprandial elevation of blood glucose levels after carbohydrate administration in normal mice. Further, because the degree of carbohydrate digestion is reflected in blood glucose levels, we also evaluated the inhibitory activities of GRE and Asp against carbohydrate-hydrolyzing enzymes such as α-amylase and α-glucosidase in vitro.
Materials and Methods
Materials GRE, Asp (purity, 91.5%) and dextrin (Max 1000) were obtained from Tama Biochemical Co., Ltd. (Tokyo, Japan), and Max 1000 was made by Matsutani Chemical Industry Co., Ltd. (Hyogo, Japan). The two GRE products used in this study differed in terms of their Asp and dextrin contents because of the variability in products manufactured in different years. The Asp and dextrin contents in the GRE were 20% and 10%, respectively, in Product 1, and 24.8% and 26%, respectively, in Product 2. Product 1 was used for oral administration tests with glucose, maltose, and sucrose, and for determining inhibitory activities against carbohydrate-hydrolyzing enzymes. Product 2 was used for oral administration tests with starch and intraperitoneal glucose tolerance test (IPGTT). D-glucose, maltose hydrate, sucrose hydrate, and starch (soluble, biochemical grade) were purchased from Wako Pure Chemicals (Osaka, Japan). Intestinal acetone powder from rats (I1630-10G), which was used as the α-glucosidase and α-amylase source (Type VI-B: from porcine pancreas, A3176-500KU), was purchased from Sigma-Aldrich (St Louis, MO, USA).
Animals and diets Male ddY mice (4 wks old) were purchased from Japan SLC, Inc. (Shizuoka, Japan). The animals were housed in groups of 5∼6 in plastic cages under controlled temperature (20 ± 2°C), humidity (45 – 60%), and light-dark cycle (12 h/12 h). Mice were permitted free access to tap water and CE-2 pelleted food (CLEA Japan, Inc., Tokyo, Japan) until the start of the experimental period. The animal experiment was conducted in accordance with the guidelines for the use of experimental animals, and was approved by the Bioethical Committee at Yamaguchi Prefectural University.
Carbohydrate tolerance test The ddY mice (21∼33 wks of age) were fasted overnight (15∼16 h) and then randomly divided into two groups (n = 7∼8). Tolerance tests were performed on different days using the carbohydrates and GRE or Asp. Animals were allowed free access to water while fasting. After overnight fasting, the mice were orally administered the glucose, maltose, or sucrose solution (0.2 g/mL/100 g body weight [BW]) with or without GRE (40 mg/mL) and Asp (8 mg/mL). Because GRE (Product 1) included dextrin to adjust the Asp concentration, Max 1000 dextrin was added to the carbohydrate solutions (4 mg/mL) of the control group for the GRE treatment. On the other hand, for the starch administration, because GRE Product 2 was used, starch (0.2 g/mL/100 g BW) with or without GRE (32 mg/mL) and Asp (8 mg/mL) was used, and Max 1000 dextrin was added to the carbohydrate solutions (8.32 mg/mL) of the control group for the GRE treatment, as in the glucose, maltose, and sucrose administration tests. Blood samples were taken from the tail vein at 0, 30, 60, 120 and 180 min after the administration of glucose, sucrose, and maltose, and at 0, 30, 60, 90, and 120 min after the administration of starch. Blood glucose levels were measured using the Glucose CII commercial assay kit (Wako Pure Chemicals) based on the glucose oxidase method. The area under the curve (AUC) was calculated using the unified protocol of the Japanese Association for the Study of Glycemic Index. The AUCs of the GRE and Asp groups were compared to those of the dextrin and control groups, expressed as 100% in each carbohydrate administration.
IPGTT The IPGTT was performed using the method described previously by Kawano et al. (2009) with slight modification. Briefly, the ddY mice (8 wks of age) were randomly divided into three groups (n = 10) and fasted overnight (15 h) with free access to water. After overnight fasting, the mice were orally administered each sample solution (control group [dex]: dextrin 20.8 mg/mL/100 g BW; GRE group: GRE 80 mg/mL/100 g BW; Asp group: dextrin 20.8 mg and Asp 20 mg/mL/100 g BW). These doses were determined based on that the GRE (Product 2) used in this experiment contained 26% dextrin and 24.8% Asp. Two hours later, blood samples were taken from the tail vein (0 min). Immediately after the blood collection, the mice received an intraperitoneal injection of glucose solution (0.2 g/mL/100 g BW). Blood samples were successively collected at 30, 60, 90 and 120 min after intraperitoneal injection, and blood glucose levels were measured as above.
Inhibitory effects of GRE and Asp on α-glucosidase and α-amylase in vitro (1) Measurement of α-glucosidase (maltase and sucrase) inhibitory activities. The α-glucosidase inhibitory assay was performed according to the method of Deguchi et al. (1998) with modification. Briefly, as the source of maltase and sucrase, rat intestinal acetone powder (1 g) was dissolved and homogenized in 20 mL of 0.1 M phosphate buffer (pH 6.0), and then centrifuged at 12,000 rpm, 4°C for 20 min. The supernatant was used as a crude enzyme solution and diluted 5-fold or 2-fold with 0.1 M phosphate buffer (pH 6.0) for measurement of the inhibition of maltase or sucrase, respectively. A 150-µL volume of 2% maltose or sucrose solution and 150 µL of sample solution (GRE 0, 2.5, 5, 10, 20 and 40 mg/mL or Asp 0, 0.5, 1, 2, 4 and 8 mg/mL) were mixed in a 1.5-mL micro-tube and pre-incubated for 5 min at 37°C. Enzyme solution (150 µL) was added to the mixture to start the reaction. The enzymatic reaction was allowed to proceed at 37°C for 30 min or 37°C for 60 min (maltase or sucrase, respectively), before being stopped by heating at 95°C for 5 min. The reacted solution was centrifuged at 5,000 rpm, 25°C for 5 min, and the glucose level of the supernatant was measured using the Glucose CII test (Wako Pure Chemicals). The presence of glucose was detected by measuring absorbance at 505 nm using a microplate reader (Synergy™ Multi-Mode Microplate Readers and Gen5™ Data Analysis Software, BioTek Instruments, Inc., Burlington, VT, USA). The inhibitory activities were calculated using the glucose levels with sample solutions (i.e., 2.5, 5, 10, 20 and 40 mg/mL GRE or 0.5, 1, 2, 4 and 8 mg/mL Asp) and the glucose levels without sample solutions (control; i.e., 0 mg/mL GRE or Asp). As an enzyme blank test, sample solutions of each concentration were also reacted with thermally deactivated enzymes, and the glucose levels (blank) were subtracted from the sample and the control after the reaction, since the color of the sample solution (such as red-brown or yellow) might affect the absorbance readings of glucose. Therefore, the α-glucosidase inhibitory activity was expressed as an inhibition rate (%), and was calculated as follows:
Although GRE 0, 2.5, 5, 10, 20, 40 mg/mL and Asp 0, 0.5, 1, 2, 4, 8 mg/mL solutions were used as sample solutions, the final concentrations of these solutions were GRE 0, 0.83, 1.67, 3.33, 6.67, 13.33 mg/mL and Asp 0, 0.17, 0.33, 0.67, 1.33, 2.67 mg/mL after the maltase and sucrase reactions, respectively. For each concentration, triplicate experiments were performed.
(2) Measurement of α-amylase inhibitory activities. The α-amylase inhibitory activity assay was performed according to the method of Saito et al. (2007) with slight modification. Briefly, 625 µL of 0.5% (w/v) starch – 0.1 M sodium phosphate buffer (pH 6.7), 150 µL of 0.1 M sodium phosphate buffer (pH 6.7), and 125 µL of 1% (w/v) sodium chloride solution were mixed in a 2-mL microtube. A 50-µL aliquot of sample solution (GRE 0, 2.5, 5, 10, 20 and 40 mg/mL or Asp 0, 0.5, 1, 2, 4 and 8 mg/mL) was added, and the reaction mixture was incubated at 37°C for 10 min. After pre-incubation, 50 µL of α-amylase solution (30 µg/mL) was added, and the reaction mixture was incubated at 37°C for 20 min. Then, the reaction was stopped with 125 µL of 2 M sodium hydrate solution and 125 µL of 1% (w/v) 3,5-dinitrosalicylic acid (DNS). The reaction mixture was incubated in a boiling water bath for 5 min and cooled to room temperature. By measuring the absorbance of the reaction mixture at 540 nm, the amount of produced reducing sugar (D-glucose equivalent) was calculated. The α-amylase inhibitory activity was calculated as described in Measurement of α-glucosidase (maltase and sucrase) inhibitory activities.
Although GRE 0, 2.5, 5, 10, 20, 40 mg/mL and Asp 0, 0.5, 1, 2, 4, 8 mg/mL solutions were used as sample solutions, the final concentrations of these reactive mixtures were GRE 0, 0.13, 0.25, 0.50, 1.00, 2.00 mg/mL and Asp 0, 0.03, 0.05, 0.10, 0.20, 0.40 mg/mL after the α-amylase reaction, respectively. For each concentration, triplicate experiments were performed.
Statistical analysis Data were expressed as means ± standard errors of the mean. In the carbohydrate tolerance test, two-group comparison was carried out using the F test, and differences were determined by a t-test between the control group vs. the GRE or Asp group. In IPGTT, significant differences between multiple groups were analyzed by one-way ANOVA.
Results
Effects of GRE and Asp on blood glucose levels with oral administration of carbohydrate solutions in ddY mice To investigate the effect of GRE and its component Asp on blood glucose levels, we examined the oral administration of carbohydrates such as glucose, maltose, sucrose and starch in ddY mice. As shown in Fig. 1A, the blood glucose levels in the control group of mice administered glucose + dex (dextrin) rapidly increased at 30 min after administration (142.1 ± 14.2 mg/dL). However, GRE significantly suppressed the increase in blood glucose levels of mice (87.9 ± 6.1 mg/dL) at 30 min after glucose administration compared to control (dex). In addition, the suppressive effect was also observed after 60 min in mice administered GRE (71.2 ± 8.0 mg/dL) compared to the control (dex) (111.0 ± 8.1 mg/dL). On the other hand, Asp also lowered blood glucose levels at 30 min after glucose administration (93.5 ± 10.2 mg/dL) compared to control (128.1 ± 9.0 mg/dL), although a similar effect was not found at 60 min (Fig. 1B).

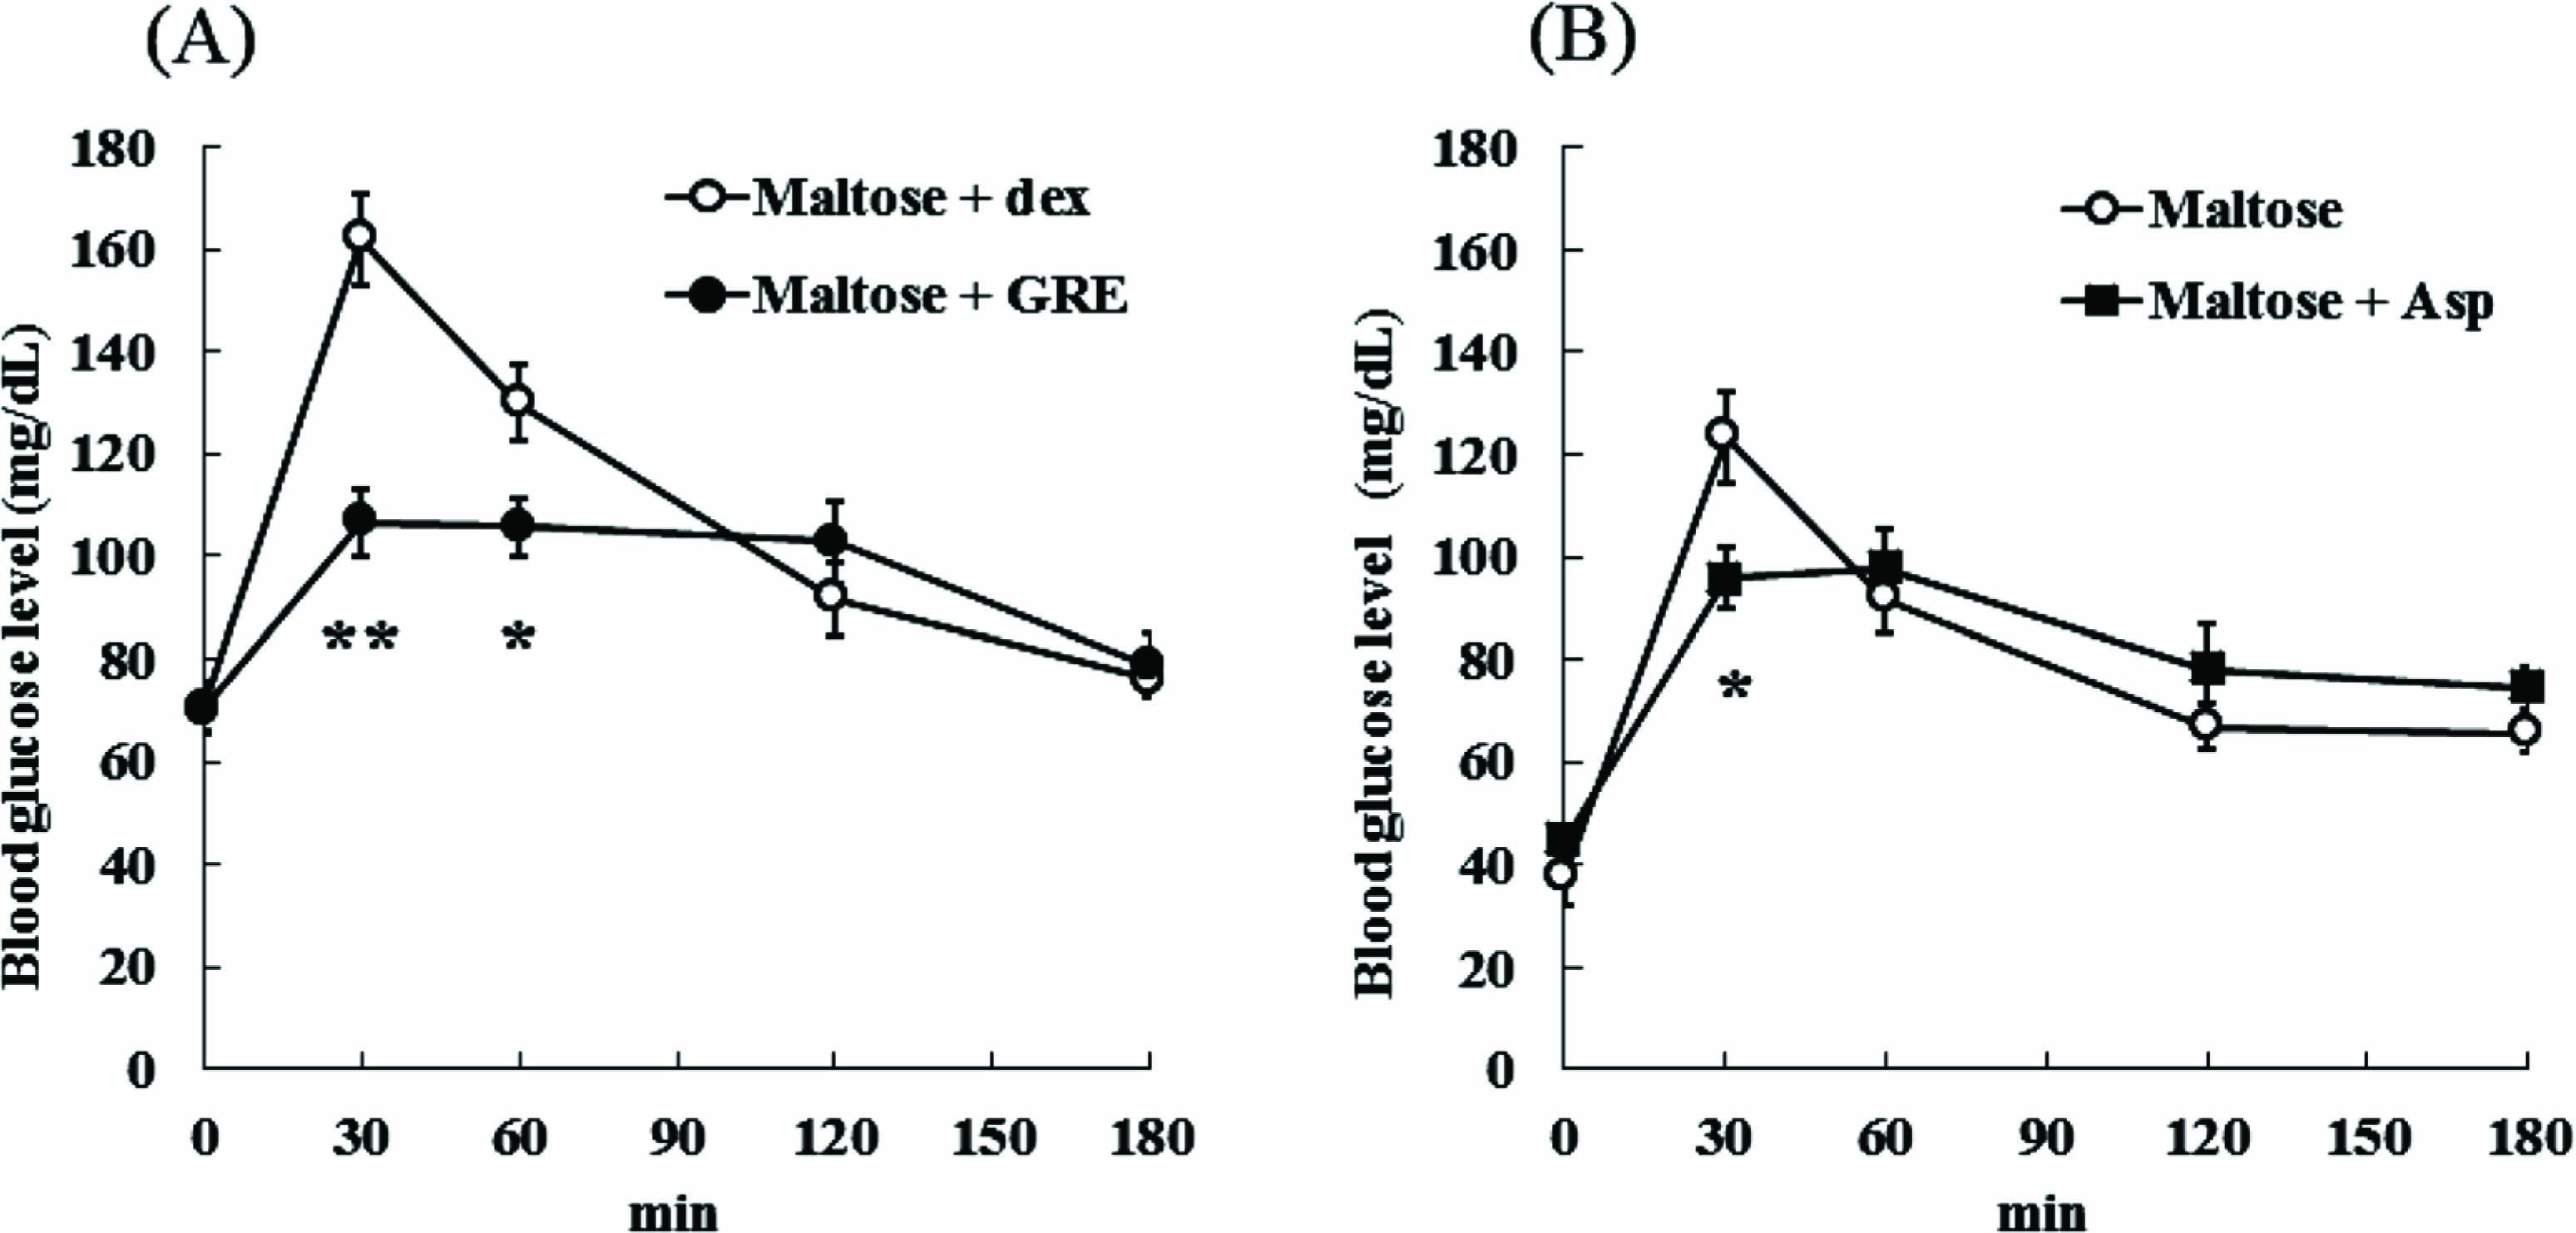
With maltose administration, the blood glucose levels of the GRE group were significantly lower than those of the dex group at 30 and 60 min after administration (GRE 30 min; 106.5 ± 6.6 mg/dL, GRE 60 min; 105.7 ± 5.5 mg/dL, dex 30 min; 161.9 ± 8.7 mg/dL and dex 60 min; 129.9 ± 7.3 g/dL) (Fig. 2A). Although an acute increase of blood glucose levels was observed from 0 min to 30 min and the increase was maintained at 60 min in the control group, it was suppressed in the GRE group. Moreover, Asp also significantly suppressed the increase in blood glucose levels at 30 min after administration compared to control (Fig. 2B).
With sucrose administration, GRE did not lower the blood glucose levels at any point compared to control (Fig. 3A). On the other hand, Asp suppressed the increase of blood glucose levels 30, 60, 90 and 120 min after administration (Fig. 3B).
With starch administration, the blood glucose level of the control group increased dramatically at 30 min (175.0 ± 12.0 mg/dL) and was maintained at a high level at 60 min (159.8 ± 7.0 mg/dL) after administration (Fig. 4A). However, in the GRE group, levels were significantly suppressed to 120 mg/dL at 30 and 60 min compared to the dex group. In addition, Asp was also significantly lower than the control at 60 min (Fig. 4B).
AUC of blood glucose levels after administrations of the four carbohydrates is shown in Fig. 5A and 5B. AUCs of GRE decreased significantly after glucose and starch administration, and tended to decrease after sucrose and maltose administration compared to the dex group (Fig. 5A). On the other hand, with Asp, a significant decrease was only observed after sucrose administration (Fig. 5B), although blood glucose levels tended to decrease with the administration of the other carbohydrates.

Effects of GRE and Asp on IPGTT Since it was previously reported that Asp increased glucose uptake in a skeletal muscle-derived cell line (Kawano et al., 2009, Son et al., 2013), we investigated whether this mechanism, through GRE- and Asp-enhanced glucose utilization in tissues such as skeletal muscle, contributed to the suppressive effects on elevated blood glucose levels in the present study. Particularly, we performed IPGTT using GRE and Asp. As shown in Fig. 6, blood glucose levels in all groups were elevated at 30 min after intraperitoneal glucose administration and no significant differences were observed between the three groups. Moreover, no differences were observed between 60 min and 120 min.

Effects of GRE and Asp on the inhibition of α-glucosidase and α-amylase activities in vitro As shown in Fig. 1∼6, GRE and Asp suppressed the elevation of blood glucose levels after carbohydrate administration. To investigate the underlying reasons for this effect, we measured the inhibitory activities of carbohydrate-hydrolyzing enzymes present in the small intestine epithelium in vitro. In maltase, GRE and Asp showed high inhibitory activities (Fig. 7A and 7B). In particular, GRE inhibited 57.3% of activity, even at the lowest concentration (2.5 mg/mL; final concentration was 0.83 mg/mL). Asp also inhibited the activities at each concentration. Sucrase activity was also inhibited by GRE and Asp in a dose-dependent manner (Fig. 8A and 8B). In a comparison of the inhibition of maltase and sucrase, the rate was higher for maltase than for sucrase at identical concentrations of GRE and Asp (Fig. 7 and 8).

Furthermore, GRE and Asp also inhibited α-amylase activities; 97.9% at 40 mg/mL GRE and 70.0% at 8 mg/mL Asp (Fig. 9A and 9B).
Based on these results, the inhibitory concentrations (IC50) for each carbohydrate-hydrolyzing enzyme were obtained and are summarized in Table 1. GRE and Asp showed the highest inhibitory activity against maltase (IC50 < 2.5 mg/mL and 0.8 mg/mL, respectively). Moreover, when controlling for the Asp concentration in GRE and Asp alone on the IC50 for maltase, levels in GRE were lower than those for Asp alone. This tendency was also shown against α-amylase. Therefore, this indicates that compounds in GRE besides Asp might also exert inhibitory effects on carbohydrate-hydrolyzing enzymes.
Table 1.
Comparison of the inhibitory activities (IC
50) of green rooibos extract (GRE) and aspalathin (Asp) against maltase, sucrase, and α-amylase
in vitro.
|
IC50(mg/mL) 【Final concentration(mg/mL)】 |
| Green rooibos extract(GRE) (Aspalathin contents) |
Aspalathin(Asp) |
| Maltase |
<2.5 【<0.83】 |
|
| (<0.5) 【<0.17】 |
0.9 【0.3】 |
| Sucrase |
7.8 【2.6】 |
|
| (1.6) 【0.52】 |
1.5 【0.50】 |
| α-Amylase |
18.0 【0.9】 |
|
| (3.6) 【0.18】 |
5.8 【0.29】 |
Discussion
Hyperglycemia, a typical symptom of type 2 diabetes, is a state characterized by a rapid rise in blood glucose levels. In particular, postprandial hyperglycemia has been linked to severe diabetes complications. Therefore, controlling the postprandial blood glucose level in the early stage of diabetes is very important in preventing the development of diabetic complications.
In this study, we demonstrated that GRE and its component Asp suppressed the elevation of blood glucose levels after carbohydrate administration in normal ddY mice. Notably, postprandial blood glucose levels were suppressed by GRE and Asp after oral glucose administration (Fig. 1). These results suggested that GRE and Asp may inhibit glucose absorption in the digestive tract or increase glucose uptake into tissues such as muscle, liver, adipose, etc. In a previous study, it was reported that Asp increases glucose uptake by cultured L6 myotubes and insulin secretion from cultured RIN-5F pancreatic β-cells, and improved glucose tolerance in IPGTT (Kawano et al., 2009). To investigate whether GRE and Asp decrease blood glucose levels via glucose uptake in tissues, we performed an IPGTT after the oral administration of sample solutions following the protocol of Kawano et al. (2009). Contrary to expectations, blood glucose levels did not differ at any time point compared to the control (Fig. 6), and our data indicated that GRE and Asp did not decrease blood glucose levels by increasing glucose uptake from the blood into tissues after intraperitoneal glucose administration. This discrepancy could be attributed to differences in the treatment period of Asp (single dose or daily administration for 5 weeks) and the mouse model employed (normal mice or type 2 diabetic mice). Moreover, our findings suggested that GRE and Asp must coexist with glucose in the gut tract to show their suppressive effects. Glucose is mainly absorbed through two transporters such as SGLT (Na-dependent glucose co-transporter) and GLUT (glucose transporter) in small intestinal epithelial cells (Helliwell and Kellett, 2002, Cermak et al., 2004). According to previous studies, many flavonoids have been shown to possess inhibitory effects on glucose uptake in intestinal cells through the transporters (Kobayashi et al., 2000, Shimizu et al., 2000, Cermak et al., 2004, Johnston et al., 2005, Alzaid et al., 2013). In addition, GRE includes flavonoids such as quercetin glucosides (Cermak et al., 2004), the effects of which were previously reported. Although we did not examine the effects of flavonoids including Asp in green rooibos on glucose uptake in intestinal cells, it was speculated that the suppressive effect of GRE and Asp on the elevation of blood glucose levels may be due to their inhibition of glucose absorption in the digestive tract.
With the administration of other carbohydrates such as maltose and starch, both GRE and Asp also showed suppressive effects on the elevation of blood glucose levels (Fig. 2 and Fig. 4). Maltose is composed of two glucoses, and sucrose is composed of glucose and fructose. In addition, starch is composed of two types of glucose-linked molecules, linear amylose and highly branched amylopectin. Basically, these disaccharides and polysaccharides are hydrolyzed and finally absorbed as glucose. As demonstrated above, because GRE and Asp suppressed the elevation of blood glucose levels resulting from oral glucose administration (Fig. 1), it was suggested that they may also inhibit the absorption of glucose produced from maltose and starch, and may show the same suppressive effects on postprandial blood glucose levels. Meanwhile, GRE did not affect blood glucose levels after sucrose administration. Comparing the levels in (A) and (B) of Figures 1, 2, and 4, (i.e., the glucose, maltose, and starch administrations), blood glucose levels of the control group were increased by dextrin (dex), which was digestible and included in the GRE. However, in sucrose administration (Fig. 3), the elevation of levels appeared to be suppressed even in the control, and although we have previously made this observation a number of times (data not shown), the mechanism remains unclear. Additional detailed studies focusing on the effect of GRE in sucrose administration without dextrin is anticipated.
Moreover, GRE and Asp are also considered to inhibit carbohydrate-hydrolysis in the digestive tract prior to the absorption of carbohydrates as glucose, possibly indicating the reason they suppress the elevation of postprandial blood glucose levels with maltose, sucrase, and starch administration. To clarify this point, we measured the inhibitory activities of GRE and Asp on carbohydrate-hydrolyzing enzymes such as α-glucosidase and α-amylase in vitro. As shown in Fig. 7∼9, GRE and Asp inhibited the activities of maltase, sucrase, and α-amylase dose-dependently. The inhibitory activities were expressed as IC50 levels and are summarized in Table 1. The IC50 values of Asp for the three enzymes were much higher compared to those reported for salacinol, an α-glucosidase inhibitor isolated from Salacia species used in Ayurvedic traditional medicine. For example, the value for maltase was 0.3 mg/mL (300 µg/mL) in Asp, but 2.0 µg/mL in salacinol (Muraoka et al., 2011). However, for the inhibition of α-glucosidase and α-amylase, tea materials such as guava leaves extract (Deguchi et al., 1998) showed IC50 values similar to those of GRE and Asp; the values for guava leaves extract were 2.1 mg/mL for maltase, 3.6 mg/mL for sucrase, and 0.6 mg/mL for α-amylase. Further, in a comparison of IC50 values between GRE and Asp, the values for the three enzymes were lower in GRE than in Asp alone, when controlling for the Asp content (Table 1). As previously reported, green rooibos is known to include various flavonoids other than Asp, such as orientin, isoorientin, rutin, vitexin, isovitexin, quercetin, isoquercitrin, hyperoside, luteolin and chrysoeryol (Bramati et al., 2003). Particularly, it has been shown that quercetin, isoquercetin, and rutin have inhibitory effects on α-amylase (Li et al., 2009), maltase, and sucrase (Kim et al., 2011). Therefore, our results suggested that the inhibitory effect of Asp in combination with other components of GRE is greater than that of Asp alone.
In the present study, we showed that GRE and its main flavonoid Asp suppressed the increase of blood glucose levels after the oral administration of glucose, maltose, and starch. Moreover, they also showed inhibitory activities against carbohydrate-hydrolyzing enzymes such as maltase, sucrase, and α-amylase. Therefore, it is considered that their suppressive effects on the elevation of blood glucose levels are invoked at least in part through inhibiting glucose absorption as well as hydrolytic enzyme activities with respect to carbohydrates. Further, because Asp is more effective in GRE than alone (controlling for Asp concentration), GRE including Asp and various other flavonoids are potential accessible and convenient anti-hyperglycemic agents derived from tea materials. As a first approach in postprandial hyperglycemia treatment, we evaluated the effect of single dose GRE and Asp on blood glucose levels in a normal mouse model and observed the suppressive effects. Further investigation of the adverse effects of GRE and Asp administration is required in order to apply this research to developing diabetes therapeutics.
References
- Alzaid, F., Cheung, HM., Preedy, VR., and Sharp, PA. (2013). Regulation of glucose transporter expression in human intestinal caco-2 cells following exposure to an anthocyanin-rich berry extract. PLoS One, 8, e78932.
- Baba, H., Ohtsuka, Y., Haruna, H., Lee, T., Nagata, S., Maeda, M., Yamashiro, Y., and Shimizu, T. (2009). Studies of anti-inflammatory effects of Rooibos tea in rats. Pediatr. Int., 51, 700-704.
- Bramati, L., Minoggio, M., Gardana, C., Simonetti, P., Mauri, P., and Pietta, P. (2002). Quantitative characterization of flavonoid compounds in Rooibos tea (Aspalathus linearis) by LC-UV/DAD. J. Agric. Food Chem., 50, 5513-5519.
- Bramati, L., Aquilano, F., and Pietta, P. (2003). Unfermented rooibos tea: quantitative characterization of flavonoids by HPLC-UV and determination of the total antioxidant activity. J. Agric. Food Chem., 51, 7472-7274.
- Ceriello, A. (2003). The possible role of postprandial hyperglycaemia in the pathogenesis of diabetic complications. Diabetologia, 46, Suppl 1:M9-16.
- Cermak, R., Landgraf, S., and Wolffram, S. (2004). Quercetin glucosides inhibit glucose uptake into brush-border-membrane vesicles of porcine jejunum. Br. J. Nutr., 91, 849-855.
- Deguchi, Y., Osada, K., Uchida, K., Kimura, H., Yoshizawa, M., Kudo, T., and Yasui, H. (1998). Effects of extract of guava leaves on the development diabetes in the db/db mouse and on the postprandial blood glucose of human subjects. Nippon Nogeikagaku Kaishi, 72, 923-931 (in Japanese).
- Franz, MJ., Powers, MA., Leontos, C., Holzmeister, LA., Kulkarni, K., Monk, A., Wedel, N., and Gradwell, E. (2010). The evidence for medical nutrition therapy for type 1 and type 2 diabetes in adults. J. Am. Diet. Assoc., 110, 1852-1889.
- Fukasawa, R., Kanda, A., and Hara, S. (2009). Anti-oxidative effects of rooibos tea extract on autoxidation and thermal oxidation of lipids. J. Oleo Sci., 58, 275-283.
- Gerrits, PM. and Tsalikian, E. (1993). Diabetes and fructose metabolism. Am. J. Clin. Nutr., 58, 796-799.
- Heinrich, T., Willenberg, I., and Glomb, MA. (2012). Chemistry of color formation during rooibos fermentation. J. Agric. Food. Chem., 60, 5221-5228.
- Helliwell, PA. and Kellett, GL. (2002). The active and passive components of glucose absorption in rat jejunum under low and high perfusion stress. J. Physiol., 544, 579-589.
- Johnston, K., Sharp, P., Clifford, M., and Morgan, L. (2005). Dietary polyphenols decrease glucose uptake by human intestinal Caco-2 cells. FEBS Lett., 579, 1653-1657.
- Joubert, E., Beelders, T., de Beer, D., Malherbe, CJ., de Villiers, AJ., and Sigge, GO. (2012). Variation in phenolic content and antioxidant activity of fermented rooibos herbal tea infusions: role of production season and quality grade. J. Agric. Food Chem., 60, 9171-9179.
- Kawano, A., Nakamura, H., Hata, S., Minakawa, M., Miura, Y., and Yagasaki, K. (2009). Hypoglycemic effect of aspalathin, a rooibos tea component from Aspalathus linearis, in type 2 diabetic model db/db mice. Phytomedicine, 16, 437-443.
- Kim, SH., Jo, SH., Kwon, YI., and Hwang, JK. (2011). Effects of onion (Allium cepa L.) extract administration on intestinal α-glucosidases activities and spikes in postprandial blood glucose levels in SD rats model. Int. J. Mol. Sci., 12, 3757-3769.
- Kobayashi, Y., Suzuki, M., Satsu, H., Arai, S., Hara, Y., Suzuki, K., Miyamoto, Y., and Shimizu, M. (2000). Green tea polyphenols inhibit the sodium-dependent glucose transporter of intestinal epithelial cells by a competitive mechanism. J. Agric. Food Chem., 48, 5618-5623.
- Kodama, T., Miyazaki, T., Kitamura, I., Suzuki, Y., Namba, Y., Sakurai, J., Torikai, Y., and Inoue, S. (2005). Effects of single and long-term administration of wheat albumin on blood glucose control: randomized controlled clinical trials. Eur. J. Clin. Nutr., 59, 384-392.
- Krafczyk, N. and Glomb, MA. (2008). Characterization of phenolic compounds in rooibos tea. J. Agric. Food Chem., 56, 3368-3376.
- Krafczyk, N., Heinrich, T., Porzel, A., and Glomb, MA. (2009). Oxidation of the dihydrochalcone aspalathin leads to dimerization. J. Agric. Food Chem., 57, 6838-6843.
- Li, Y., Gao, F., Gao, F., Shan, F., Bian, J., and Zhao, C. (2009). Study on the interaction between 3 flavonoid compounds and alpha-amylase by fluorescence spectroscopy and enzymatic kinetics. J. Food Sci., 74, 199-203.
- Morton, JF. (1983). Rooibos tea, Aspalathus linearis, a caffeineless, low tannin beverage. Econ. Bot., 37, 164-173.
- Muller, CJ., Joubert, E., de Beer, D., Sanderson, M., Malherbe, CJ., Fey, SJ., and Louw, J. (2012). Acute assessment of an aspalathin-enriched green rooibos (Aspalathus linearis) extract with hypoglycemic potential. Phytomedicine, 20, 32-39.
- Muraoka, O., Morikawa, T., Miyake, S., Akaki, J., Ninomiya, K., Pongpiriyadacha, Y., and Yoshikawa, M. (2011). Quantitative analysis of neosalacinol and neokotalanol, another two potent α-glucosidase inhibitors from Salacia species, by LC-MS with ion pair chromatography. J. Nat. Med., 65, 142-148.
- Saito, Y., Nishi, S., Koaze, H., Hironaka, K., and Kojima, M. (2007). Antioxidant and inhibitory activity on α-amylase and α-glucosidase in legume polyphenols. Nippon Shokuhin Kagaku Kogaku Kaishi, 54, 563- 567 (in Japanese).
- Shimizu, M., Kobayashi, Y., Suzuki, M., Satsu, H., and Miyamoto, Y. (2000). Regulation of intestinal glucose transport by tea catechins. Biofactors, 13, 61-65.
- Snijman, PW., Swanevelder, S., Joubert, E., Green, IR., and Gelderblom, WC. (2007). The antimutagenic activity of the major flavonoids of rooibos (Aspalathus linearis): some dose-response effects on mutagen activation-flavonoid interactions. Mutat. Res., 631, 111-123.
- Son, MJ., Minakawa, M., Miura, Y., and Yagasaki, K. (2013). Aspalathin improves hyperglycemia and glucose intolerance in obese diabetic ob/ob mice. Eur. J. Nutr., 52, 1607-1619.
- Wakabayashi, S., Kishimoto, Y., and Matsuoka, A. (1995). Effects of indigestible dextrin on glucose tolerance in rats. J. Endocrinol., 144, 533-538.
- Wakabayashi, S., Kishimoto, Y., Nanbu, S., and Matsuoka, A. (1999). Effects of indigestible dextrin on postprandial rise in blood glucose levels in man. J. Jpn Assoc. Dietary Fiber Res., 3, 13-19.