Original papers
Effect of Yacon Tuber (Smallanthus sonchifolius)-derived Fructooligosaccharides on the Intestinal Flora and Immune System of OVA-sensitized BALB/c Mice
2015 Volume 21 Issue 2 Pages 255-262
Details
2015 Volume 21 Issue 2 Pages 255-262
Yacon (Smallanthus sonchifolius) tuber contains fructooligosaccharides (FOS). FOS are known as prebiotics that beneficially affect the host, i.e., improve the intestinal flora balance and enhance the immunomodulatory potential. In this study, we investigated the effect of a yacon extract rich in FOS (YOS) on the intestinal flora and immune system of BALB/c mice sensitized and challenged with ovalbumin in comparison with an extract with acid-degraded FOS (YAH). During the 4-week test period, the amount of YOS intake was lower than that of YAH; however, a significant increase in body weight was not shown among any of the test groups. Sneezing events were observed in OVA-treated mice. It was found that administration of yacon FOS improved the intestinal flora. Further, it was suggested that administration of yacon-derived FOS could epidemiologically improve the Th1/Th2 cytokine balance through its prebiotic effect on the number of beneficial bacteria in the animal gut.
Yacon (Smallanthus sonchifolius), which is a tuber crop originally cultivated in the Andean region of South America, has been used as a health food by the local population. The tuber has a slightly sweet taste and a unique crisp texture. Yacon was introduced to Japan in 1985, and has gained increasing interest because of its functional components. The yacon plant contains high levels of fructooligosaccharides (FOS) in the tubers (Asami et al., 1989; Campos et al., 2012), whereas the leaves are high in flavonoids, phenolic acids, and tryptophan. These components are able to stimulate immune defense by exerting antioxidant, anti-inflammatory, antimicrobial, and anticancer effects (Graefe et al., 2004; Simonovska et al., 2003; Yan et al., 1999). FOS in yacon tubers are characterized by a low degree of polymerization (DP) of fructose and are present in high amounts in tissues (60 ∼ 70%, dry matter) (Goto et al., 1995). Similar polyfructoses with higher DP are sometimes referred to as inulin. FOS and inulin are traditionally known as prebiotics, which have health-promoting effects such as improvement of the intestinal flora balance and growth promotion of probiotic organisms, through selective fermentation of FOS by one or a limited number of potential beneficial bacteria such as lactobacilli and bifidobacteria, in the colon. FOS and inulin are known for several functional properties such as calcium absorption, lipid metabolism, and modification of intestinal flora (Roberfroid 2005). It was reported that the growth of beneficial bacteria after FOS and inulin consumption, which inhibit the growth of pathogenic and saprogenic bacteria, is directly related to colon cancer prevention in experimental models (Poo-Zobel et al., 2002).
Several studies have shown increased immune system efficiency after the consumption of oligosaccharides (Vos et al., 2006; Fujitani et al., 2007). For example, it has been reported that these compounds promote increased resistance to infection and reduce allergies (Watzl et al., 2005; Kelly-Quagliana et al., 2003). Furthermore, Fullar (1989) showed the epidemiological importance of intestinal flora in the prevention of allergic diseases. OVA-sensitized BALB/c mice have been extensively studied in evaluating several inflammatory and immunological features that resemble those of asthma, including airway eosinophilia, the development of bronchial hypersensitivity, and the expression of cytokines such as interleukin (IL)-4 and IL-5 in the allergen-exposed sensitized lung (Elwood et al., 1991; Haczu et al., 1996; Nakajima et al., 1992; Coyle et al., 1995). In this investigation, we hypothesized that yacon tubers have immunomodulatory potential through the fermentation of FOS by probiotic bacteria. The mediation of allergic responses by the intestinal flora in OVA-sensitized mice fed yacon FOS has been poorly understood because yacon FOS is easily hydrolyzed by endogenous glycosidase (fructan β-fructosidase, EC 3.2.1.80). Therefore, we investigated the effect of a yacon extract high in FOS on the intestinal flora and immune system of OVA-sensitized BALB/c mice in comparison with a yacon extract containing acid-degraded FOS.
Animals and diets Female 4-week-old BALB/c mice were purchased from Charles River (Tokyo, Japan), and were housed in individual cages (143 mm × 293 mm × 148 mm) in a temperature-controlled (23 ± 2°C) room with a 12 hour light/dark cycle. Mice were allowed free access to water and AIN-93G basic diet (Reeves et al., 1993) prior to the start of the experiment. The AIN-93G diet contained 18.3% protein, 7.1% fat, 5.0% fiber, 63.2% carbohydrate and 3.89 kcal/g energy.
The present study was approved by the Ibaraki University animal use committee (permission number 132 – 2013), and animal experimentation was conducted in accordance with the guidelines of the animal care and use committee of Ibaraki University.
Yacon Yacon tubers (cultivar Salada-Otome), cultivated in Ibaraki, Japan, were obtained from Tsukuba Yacon Co., Ltd. (Ibaraki, Japan). The tubers were immediately frozen and stored at −20°C to prevent the degradation of FOS by fructan β-fructosidase. The frozen yacon tubers were subjected to high pressure saturated steam at 121°C for 20 min using a BS-245 autoclave (TOMY, Tokyo, Japan).
After the heat-treated yacon tubers were peeled and squeezed, the obtained extract was added to a 3X volume of 80% ethanol. The solution was centrifuged (5403 × g, 4°C for 20 min) and the supernatant was obtained. The ethanol fraction was thoroughly removed from the supernatant using a rotary evaporator (type RE301; Yamato Scientific, Tokyo, Japan), and a concentrate was generated. The obtained yacon extract containing FOS (YOS) was stored at −20°C until use. To alter the saccharide composition of the yacon extract, YOS added to an equal volume of 1 mol/L citric acid was heated at 100°C for 1 h to hydrolyze the FOS in YOS. After that, the pH of the treated solution was adjusted with 2 M sodium carbonate to pH 5.7, the original pH of yacon juice, to generate an acid hydrolysate of yacon (YAH). The YAH solution was stored at −80°C until use. The FOS content in YOS and YAH were determined by high-performance liquid chromatography using a Hitachi-HPLC system (Hitachi high-technologies, Tokyo Japan) equipped with a Shodex-Asahipack NH-2P-50G 4A column (Showa Denko, Tokyo, Japan). Yacon saccharides were identified by refractive index and categorized by comparison with the retention standards of glucose, fructose, sucrose (GF), 1-kestose (GF2), nystose (GF3) and fructofuranosylnystose (GF4). Total saccharide content of the yacon extract was measured by the phenol-sulfuric acid method (DuBois et al., 1956). The content of other FOS with DP of fructose greater than 5 (>GF5) was determined on the basis of the molar ratio of glucose and fructose. For yacon extract administration in mice, the saccharide concentration of the YOS solution was adjusted to 12.6% for administration of a total of 5% FOS such as GF2, GF3 and GF4. The saccharide concentration of the YAH solution was adjusted to that of YOS using distilled water.
Experimental schedule The control diets were consumed for one week, and the mice were then assigned to four test groups (7 animals per group) receiving yacon extract (YAH or YOS) supplementation and ovalbumin (OVA) treatment: 1) YAH without OVA treatment, YAH (CON); 2) YAH with OVA treatment, YAH (OVA); 3) YOS without OVA treatment, YOS (CON); and 4) YOS with OVA treatment, YOS (OVA) (Figure 1). The AIN-93G basic diet and distilled water were supplied ad libitum between 5 and 7 weeks of age; yacon water (diluted yacon extract containing either YAH or YOS) was administered instead of distilled water between 7 and 11 weeks of age. For OVA treatment, mice were intraperitoneally injected with 14.7 µL/g (body weight) of 5.5 µg OVA and 1.8 µg aluminum hydroxide gel at 5 and 7 weeks of age. A control experiment was conducted by injecting phosphate buffered saline. The mice were intranasally challenged with aerosolization of 2% OVA by an ultrasonic nebulizer (NE-C28; Omron, Tokyo, Japan) for 10 min every day between 7 and 11 weeks of age. The number of sneezing events was then counted for 10 min, beginning 1 min from the intranasal instillation. Cecal content was collected to determine the proportion of intestinal bacteria immediately following a lethal dose of ether at 11 weeks of age. Spleen and lung tissues were also collected to measure various cytokines after death.

Experimental schedule for the OVA treatment and yacon extract supplementation of mice.
Four-week-old BALB/c mice were fed basic diet between 5 and 7 weeks of age. The mice were intraperitoneally injected with OVA at 5 and 7 weeks of age (OVA sens). Then the mice were intranasally challenged by aerosol OVA between 7 and 11 weeks of age (OVA challenge). YAH, yacon extract treated with citric acid; YOS, original yacon extract; CON, mice were not treated with OVA; OVA, mice were treated with OVA.
Intestinal bacterial counts Bacterial quantification in the cecum was done by real-time PCR. Briefly, DNA was extracted from the cecal content using a QIAamp DNA Stool Mini Kit (Qiagen, Venlo, Netherlands) according to the manufacturer's instructions. After the DNA solution was added to a 1/10 volume of 3 mol/L sodium acetate and 2.5X volume of 99.5% ethanol, the solution was centrifuged (12000 × g, 4°C, 15 min). The obtained precipitate was washed with 70% ethanol and the DNA concentration was determined spectroscopically at OD260. To quantify lactobacilli, bifidobacteria, coliforms and clostridia, different primers were designed in reference to previous reports (Nadkarni et al., 2002; Bej et al., 1991).
These primers were synthesized by Hokkaido System Science (Hokkaido, Japan). Real-time quantitative PCR was carried out with Dice Real Time System Single TP870 (Takara, Tokyo, Japan) using 0.2 mL semi-skirted 96-well PCR plates in a final volume of 16 µL. Analyses were performed in triplicate, and mean values were calculated. Each PCR mixture was composed of 10 µL of Thunderbird SYBR qPCR Mix (QPS-201; Toyobo, Tokyo, Japan), 10 pmol/µL of each bacterial primer and 4 µL DNA in each reaction. Each PCR cycle included 15 sec of denaturation at 95°C, 15 sec of primer annealing at different temperatures for each pair and 30 sec of extension at 72°C. Bacterial gene expression levels were normalized to 16S rRNA gene expression. Each bacterial expression level was expressed as a relative value, with the control group of YAH fed mice set as 1.
Cytokine measurement Total RNA was isolated from spleen and lung tissues using Trizol reagent (Invitrogen, CA, USA) according to the manufacturer's protocol. Total RNA samples were dispersed into DEPC-treated water. After the chloroform-added solution was centrifuged (12000 × g, 4°C, 15 min), the resultant upper phase containing RNA was added to isopropanol to precipitate RNA. After the RNA pellet was washed with 75% ethanol and redissolved in DEPC-treated water. cDNA was synthesized from the RNA with a ReverTra Ace qPCR RT Kit (FSQ-101; Toyobo) according to the manufacturer's protocol.
To quantify mRNA levels of interferon (IFN)-γ, tumor necrosis factor (TNF)-α, IL-4 and IL-5, primers were designed using Primer3Plus software (http://www.bioinformatics.nl/cgi-bin/primerplus/primer3plus.cgi) (Renfu et al., 2010). These designed primers were synthesized by Hokkaido System Science. Real-time quantitative PCR was carried out with Dice Real Time System Single TP870 (Takara) as for the bacterial quantification described above.
Cytokine gene expression levels were normalized to 18S rRNA gene expression in spleen or lung tissue. Each cytokine level was expressed as a relative value, with the control group of YAH fed mice set as 1. Further, the ratio of gene expression level of INF-γ and IL-4 was calculated to evaluate the Th1/Th2 balance in spleen and lung.
Statistical analysis Data were subjected to one-way analysis of variance (ANOVA) with a 5% level (P < 0.05) of significance using MS Excel 2010. When the ANOVA showed significant differences between the groups, differences in group means were evaluated using Tukey's test for multiple comparisons as above.
Figure 2 shows the saccharide composition of YAH and YOS. YAH were composed of 73% fructose, 20% glucose and 7% sucrose. While no FOS were contained in YAH, YOS contained large amounts of FOS (GF2, GF3 and GF4) and higher degree fructose polymers (>GF5). The total volume of fructose, glucose and sucrose was only about 20%.

The saccharide compositions of YAH and YOS obtained as yacon extract.
F, fructose; G, glucose; GF, sucrose; GF2, 1-kestose; GF3, nystose; GF4, fructofuranosylnystose; >GF5, the other fructooligosaccharides. YAH and YOS are referred to in Fig. 1.
Table 1 shows the effect of FOS supplementation on the intake of feed and water, and body weight of OVA-sensitized mice. During the 4-week test period, the amount of feed intake ranged from 94.42 ± 0.18 to 105.12 ± 0.10 g/4 weeks/mouse, and showed no significant difference among all test groups. The total amounts of water consumed were significantly higher in the YAH groups than in the YOS groups, with or without OVA treatment. The body weight of YAH (CON) mice increased significantly from 22.14 ± 0.55 to 23.93 ± 0.58 g/week during the 4-week test period. However, no significant increases in body weight were observed in the other three groups.
| YAH | YOS | |||
|---|---|---|---|---|
| CON | OVA | CON | OVA | |
| Feed intake (g/day) | ||||
| 1st week | 3.32 ± 0.18a | 3.68 ± 0.09ab | 3.74 ± 0.13ab | 4.02 ± 0.26b |
| 2nd week | 3.40 ± 0.08ab | 3.64 ± 0.16ab | 3.44 ± 0.11ab | 3.77 ± 0.22ab |
| 3rd week | 3.40 ± 0.18ab | 3.67 ± 0.12ab | 3.37 ± 0.10ab | 3.59 ± 0.14ab |
| 4th week | 3.37 ± 0.18ab | 3.64 ± 0.16ab | 3.27 ± 0.09ab | 3.64 ± 0.15ab |
| Total (g/4 wks) | 94.42 ± 0.07x | 102.43 ± 0.06x | 96.74 ± 0.06x | 105.12 ± 0.10x |
| Drinking water with yacon extract (mL/day) | ||||
| 1st week | 2.72 ± 0.18b | 2.88 ± 0.19b | 2.17 ± 0.08a | 2.19 ± 0.09a |
| 2nd week | 3.96 ± 0.14c | 4.10 ± 0.12c | 2.66 ± 0.11b | 2.74 ± 0.09b |
| 3rd week | 3.69 ± 0.17bc | 3.33 ± 0.14b | 2.34 ± 0.09a | 2.39 ± 0.08a |
| 4th week | 3.85 ± 0.12c | 3.30 ± 0.07b | 2.73 ± 0.03b | 2.75 ± 0.05b |
| Total (mL/4 wks) | 75.96 ± 0.09x | 72.59 ± 0.08x | 52.36 ± 0.06y | 53.29 ± 0.04y |
| Body weight (g/week number) | ||||
| 0th week | 22.14 ± 0.55a | 22.08 ± 0.10a | 21.71 ± 0.31a | 22.36 ± 0.28a |
| 1st week | 22.23 ± 0.83a | 22.18 ± 0.18a | 21.77 ± 0.29a | 22.24 ± 0.36a |
| 2nd week | 22.00 ± 0.35a | 22.48 ± 0.27a | 22.09 ± 0.33a | 22.66 ± 0.34ab |
| 3rd week | 23.24 ± 0.68a | 22.98 ± 0.32ab | 22.86 ± 0.35ab | 22.89 ± 0.40ab |
| 4th week | 23.93 ± 0.58b | 23.00 ± 0.45ab | 23.01 ± 0.36ab | 23.14 ± 0.45ab |
YAH, YOS, CON and OVA are referred to in Fig. 1.
OVA, Data bearing the same superscripts are not significant different (P > 0.05).
Table 2 shows the average frequency of sneezing events of OVA-sensitized mice administered yacon extracts. In the YAH groups, no sneezing events were observed during the 4-week test period. In the case of OVA treatment, sneezing events were observed after the 2nd week of the test period in both YAH and YOS groups. At the 4th week, the frequency of sneezing events was not significantly different between YAH and YOS.
| Sneezing event frequency (days/week/mouse) | ||||
|---|---|---|---|---|
| Week | 1st | 2nd | 3rd | 4th |
| YAH (CON) | 0.00d | 0.00d | 0.00d | 0.00d |
| YAH (OVA) | 0.00d | 2.00c | 6.16a | 6.83a |
| YOS (CON) | 0.00d | 0.00d | 0.00d | 0.00d |
| YOS (OVA) | 0.00d | 1.42c | 4.57b | 6.14a |
Figure 3 shows the effect of yacon extract on the intestinal flora of mice with or without OVA treatment. In mice not sensitized with OVA, the numbers of lactobacilli and bifidobacteria were higher in the YOS group than in the YAH group. In the case of YAH supplementation, OVA treatment decreased significantly the proportion of lactobacilli and bifidobacteria. Coliforms and clostridia were not affected by OVA treatment. Administration of YOS also did not affect the numbers of coliforms and clostridia. The numbers of lactobacilli and bifidobacteria in OVA-sensitized mice were not significantly different from those without OVA treatment.

Effect of yacon extract supplementation on the intestinal flora of mice during OVA treatment.
Each bacterial number was expressed as a relative value, with the control group of YAH fed mice set as 1. YAH, YOS, CON and OVA are referred to in Fig. 1. Data represent the mean ± SE for 7 mice per group. Mean values with unlike letters are significantly different (P < 0.05).
Figure 4 shows the effect of yacon extract intake on the spleen and lung weights of mice with and without OVA treatment. OVA treatment increased significantly the spleen weight with both YAH and YOS administration. OVA treatment also increased the lung weight with both YAH and YOS administration.

Effect of yacon extract administration on the spleen and lung weight of OVA-sensitized mice.
YAH, YOS, CON and OVA are referred to in Fig. 1. Data represent the mean ± SE for 7 mice per group. Mean values with unlike letters are significantly different (P < 0.05).
Figure 5 shows the effect of yacon extract on splenic cytokine expression in mice with or without OVA treatment. Levels of splenic cytokines, such as INF-γ, IL-4, TNF-α and IL-5, were not influenced by OVA treatment in groups administered either YAH or YOS.

Effect of yacon extract intake on splenic immunocytokine gene expression levels in OVA-sensitized mice.
Cytokine levels are expressed as relative values, with the control group of YAH fed mice set as 1. YAH, YOS, CON and OVA are referred to in Fig. 1. Data represent the mean ± SE for 7 mice per group. Mean values with unlike letters are significantly different (P < 0.05).
Figure 6 shows the effect of yacon extract on cytokine expression in mouse lung with or without OVA treatment. In the case of YAH administration, OVA treatment significantly decreased the INF-γ level but increased IL-4 and IL-5 levels. Meanwhile, the TNF-α level was not altered by OVA treatment. When YOS was given to mice, OVA treatment significantly decreased INF-γ and TNF-α levels in lung. However, IL-4 and IL-5 levels were not influenced by OVA treatment.
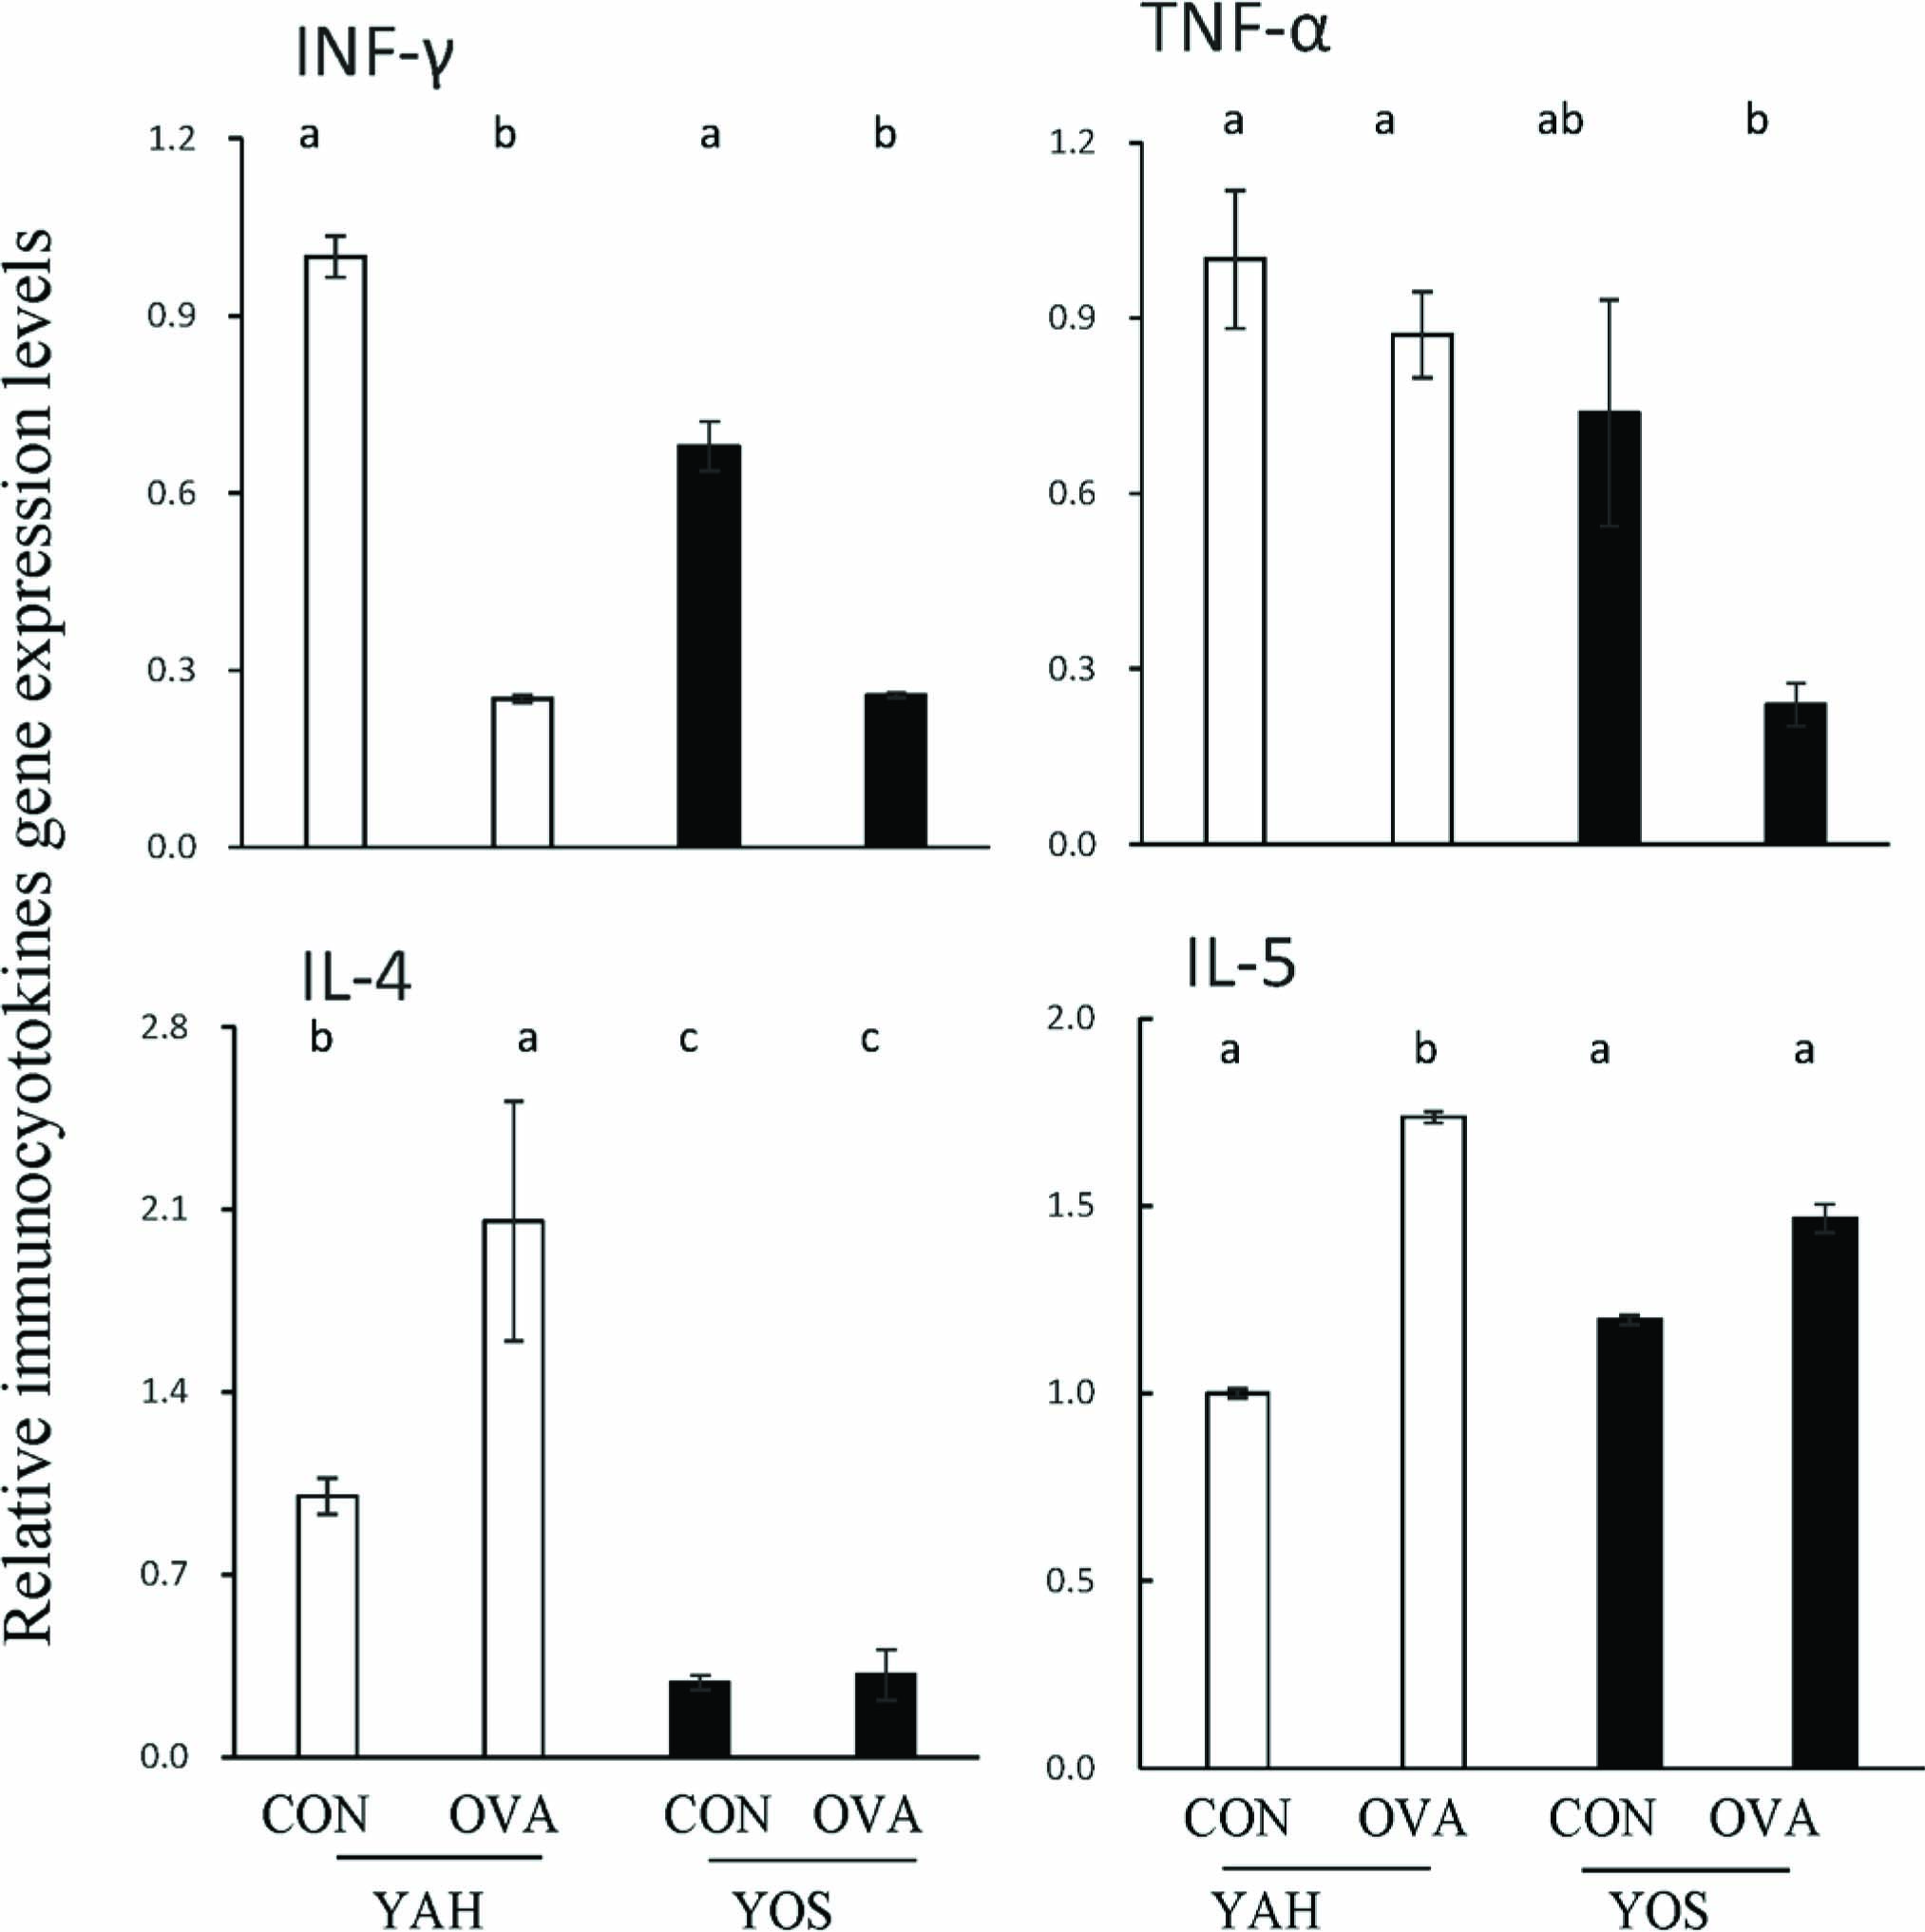
Effect of yacon extract intake on pulmonary immunocytokine gene expression levels in OVA-sensitized mice.
Cytokine levels are expressed as relative values with the control group of YAH fed mice set as 1. YAH, YOS, CON and OVA are referred to in Fig. 1. Data represent the mean ± SE for 7 mice per group. Mean values with unlike letters are significantly different (P < 0.05).
Further, the effect of yacon extract intake on splenic and pulmonary Th1/Th2 balance in OVA-sensitized mice are shown in Fig. 7. The columns oriented upward and downward in the figure show Th1 and Th2 dominant conditions, respectively. In the case of spleen, a Th1 dominant condition was shown in mice fed YOS without OVA treatment. YAH administration did not alter the Th1/Th2 balance of mice. In the case of lung, a Th2 dominant condition was shown in OVA-sensitized mice fed YAH. The shift toward a Th2 response was not shown with YOS supplementation, with or without OVA treatment.

Effect of yacon extract intake on splenic and pulmonary Th1/Th2 balance in OVA-sensitized mice.
Data are shown as the ratio of gene expression of Th1 (INF-γ) and Th2 (IL-4) in spleen or lung. YAH, YOS, CON and OVA are referred to in Fig. 1. Data represent the mean ± SE for 7 mice per group. Mean values with unlike letters are significantly different (P < 0.05).
It is known that FOS are easily hydrolyzed by heating under acidic conditions (L'homme et al., 2003). In a previous paper, we found high pressure steam treatment of yacon tuber before peeling was an excellent preparation method for yacon extract with high FOS yield (Miyaguchi et al., 2012). Using this technique, two different kinds of yacon extracts (YAH and YOS) were obtained. However, due to their highly hygroscopic property, our attempts to generate powdered yacon extracts by desiccation proved challenging. Therefore, the yacon extracts (YAH or YOS) were administrated orally in the drinking water.
During the 4-week test period, the amount of feed intake did not significantly differ among all test groups. On the other hand the total consumption of water was significantly higher in the YAH groups than in the YOS groups, regardless of OVA treatment. A significant increase in body weight was observed between the 0 and 4th weeks in only the YAH (CON) group. Kim et al. (2010) reported that rats fed a high-fat diet with 10% yacon flour lost weight over 4 weeks compared with rats fed a high fat diet alone. In contrast, it was reported that the daily intake of yacon did not affect the body weight of mice (Grethel et al., 2012). However, a significant difference in the body weight of mice was not shown among the four groups after feeding of YAH or YOS, even though YAH contained with higher calories (4 kcal/g) than FOS (2 kcal/g) (Lopez et al., 1997), suggesting that intake of calories (fructose) likely does not affect the intestinal flora and immune system of mice in this study.
To elucidate the underlying mechanism of allergic rhinitis, several studies have reported on an OVA-sensitized model of rhinitis, which induces eosinophil infiltration into the lungs and widespread mucus occlusion of the airways, resulting in sneezing, rhinorrhea and nasal obstruction (Takubo et al., 2006; Yatsuzuka et al., 2007). As clearly shown in our results, sneezing events were observed with OVA treatment with or without YOS supplementation, indicating that FOS did not have a direct alleviating action on rhinitis.
It is known that YOS intake increases some beneficial bacteria like bifidobacteria (Mitsuoka et al., 1987; Bouhnik et al., 1999). These beneficial bacteria could ferment FOS, resulting in reduced pH from the production of lactic acid and acetic acid in the intestinal environment. Our study showed that FOS intake could improve the intestinal flora regardless of OVA treatment. It has been reported that the intestinal flora plays an epidemiologically important role in the prevention of allergic diseases (Fuller, 1989).
Several researchers reported that the lung and spleen of mice increased in size with symptoms of allergy (Eyre, 1972; Ishigame et al., 2009). Our study suggested that enlargement of the spleen and lung of mice is likely due to inflammatory responses by OVA treatment.
Helper T cells, which protect our bodies from foreign bacteria, differentiate Th1 and Th2 cells. It is known that the increase in Th2 type immune responses leads to asthma and dermatitis as a result of allergic responses mediated through the derivation of inflammatory cells such as Th2, mast and B cells (Cohn et al., 2004; Medoff et al., 2008). These cells invade the respiratory tract and produce Th2 cytokines such as IL-4, IL-5 and IL-13 (Leigh et al., 2004). Yasuda et al. (2010) reported that dietary FOS supplementation could prevent allergic airway inflammation induced by mite allergen. In this study, various splenic cytokines were not influenced by OVA treatment with either YAH or YOS administration. In the case of lung, OVA treatment significantly increased IL-4 and IL-5 levels in the YAH group. However, in the YOS group, these cytokine levels were not influenced by OVA treatment. Although INF-γ levels were expected to increase with FOS administration, because of its prebiotic activity, after OVA treatment, levels did not differ between YAH and YOS groups. Therefore, we need to further investigate the relationship between INF-γ expression and allergenic activity.
It is known that IL-5 plays a prominent role in the pathogenesis of allergic inflammation (Till et al., 1997). In this study, IL-5 levels in the lung of OVA-sensitized mice did not increase in the YOS group but increased in the YAH group, suggesting that FOS intake may attenuate allergic airway eosinophilia. Supporting this, TNF-α, which is a potentially important cytokine in allergic respiratory reactions, decreased in OVA-sensitized mice fed YOS. Administration of YAH tilted the pulmonary Th1/Th2 balance toward Th2 in OVA-sensitized mice. However, administration of YOS suppressed the shift toward Th2 with OVA treatment, suggesting that yacon FOS could improve the Th1/Th2 cytokine balance through its prebiotic effects on beneficial gut bacteria. However, it remains unclear why the immune response in the spleen did not correspond to that in the lung. Furthermore, quantification of serum levels of IgE, IgG and IgA antibodies was not conducted in this study. Therefore, we are continuing to investigate the modulation of immune responses by FOS from yacon tubers.
The effect of FOS derived from yacon tubers on the intestinal flora balance and immune system of BALB/c mice sensitized and challenged with OVA was investigated. The findings are as follows. When the mice were supplied with yacon FOS and challenged with OVA for 4 weeks, FOS intake did not prevent sneezing behavior in challenged mice but improved the intestinal flora through an increase in lactobacilli and bifidobacteria. Further, epidemiological improvement of the Th1/Th2 cytokine balance by yacon FOS intake was suggested.
Acknowledgement We thank the members of the Laboratory of Animal Health and Hygiene at Ibaraki University for providing the animal breeding facilities. This research was partially supported by the Grant-in-Aid for Morinaga Houshikai.