Abstract
The purpose of this study was to compare the antioxidative activity of 68 culinary herbs and spices, and to evaluate the hepatoprotective effects of highly antioxidative plants (selected after an in vitro study) on carbon tetrachloride-induced oxidative stress in rats. Six Lamiaceae plants (oregano, common thyme, peppermint, lemon balm, sweet marjoram and rosemary) were found to be among the top 10 plants showing high total oxygen radical absorbance capacity (T-ORAC: sum of hydrophilic and lipophilic ORAC (H- and L-ORAC)). Their T-ORACs were composed of > 90% H-ORACs. Next, we prepared hydrophilic fractions of three selected Lamiaceae plants (peppermint, lemon balm and rosemary), in which bitterness and lipophilic odorants were reduced. Oral administration of these fractions in rats decreased aspartate aminotransferase and alanine aminotransferase activities in serum, inhibited lipid peroxidation, and restored superoxide dismutase and glutathione S-transferase activities in carbon tetrachloride-treated rats. Antioxidants in plants could exert a hepatoprotective effect by scavenging free radicals.
Introduction
A state of oxidative stress occurs when there is an excess of reactive species such as reactive oxygen and reactive nitrogen in relation to available antioxidants (Asimov, 2007). Oxidative stress is reported to lead to various diseases such as atherosclerosis, diabetes, inflammatory bowel disease and cancer (Schatz, 2007). Antioxidants synthesized in vivo and taken in from the diet play an important role in defending against reactive species (Reth, 2007).
Culinary herbs and spices are sources of dietary antioxidants. These natural materials contain components that differ in properties, e.g., hydrophilic and lipophilic compounds, and function as antioxidants at different reaction rates. Therefore, to evaluate the antioxidative activity of each culinary plant, it is necessary to assay both the hydrophilic and lipophilic fractions. Comparative studies on the antioxidative activities of culinary plants have been reported (Zheng and Wang, 2001; Wu et al., 2004; Ninfali et al., 2005; Shan et al., 2005). However, most of these have focused on hydrophilic compounds, such as polyphenolic compounds and ascorbic acid, and there are few studies on the oxidative activity of both the hydrophilic and lipophilic fractions of plants.
The oxygen radical absorbance capacity (ORAC) assay is based on the measurement of antioxidant scavenging activity against peroxyl-radical-induced-oxidation initiated by 2,2′-azobis(2-amidino-propane) dihydrochloride (AAPH) at physiological pH (Ou et al., 2001). In addition, the ORAC assay can be performed in both an aqueous solution and a lipophilic environment (Huang et al., 2002, 2005; Prior et al., 2003; Prior et al., 2005). Therefore, this assay is considered to be biologically relevant and suitable for both hydrophilic and lipophilic components in natural materials.
In vitro assays such as the ORAC do not measure bioavailability, in vivo stability, and reactivity in situ. Therefore, an in vivo study is useful in confirming whether the administration of potent antioxidants evaluated by the initial in vitro study improves oxidative stress levels.
Carbon tetrachloride (CCl4)-induced liver injury is an oxidative-stress model used for screening hepatoprotective materials (McCay et al., 1984; Recknagel et al., 1989; Plaa, 2000; Weber et al., 2003). A toxic intermediate, trichloromethyl radical (CCl3•), which is metabolized from CCl4 by the cytochrome P450 enzyme system in liver microsomes, is reported to produce liver damage. CCl3• might attack biological molecules directly, causing covalent modification and/or initiation of lipid peroxidation by abstracting H• from membrane lipids. In addition, a highly reactive trichloromethylperoxyl radical (CCl3O2•), which is a reactive intermediate arising from CCl3• and oxygen, initiates lipid peroxidation by H• abstraction from membrane lipids. Some studies have reported the protective effects of commercially available culinary herbs and spices on CCl4-induced hepatotoxicity (Deshpande et al., 1998; Sotelo-Félix et al., 2002; Botsoglou et al., 2008; Park, 2010; Farhoudi, 2011). However, in general, many of the phytonutrients in foods that possess biological activities are also unpalatable because of bitter tastes and odors (Drewnoski and Gomez-Carneros, 2000; Lesschaeve and Noble, 2005; Soares et al., 2013). For ease of consumption, improving unfavorable tastes, especially bitterness, and removing undesirable odors in healthy foods is desirable.
The objectives of this study were to compare the hydrophilic ORAC (H-ORAC), lipophilic ORAC (L-ORAC) and T-ORAC (sum of H-ORAC and L-ORAC) values of 68 culinary herbs and spices grouped into 25 families and assess the hepatoprotective effect of the hydrophilic fractions of three selected Lamiaceae plants (peppermint, lemon balm and rosemary), in which both the bitterness components and lipophilic odorants of each plant were reduced, on CCl4-induced oxidative stress in rats.
Materials and Methods
Plant materials Sixty-eight herbs and spices from a variety of countries/regions were purchased through import merchants (Table 1). These plants are distributed throughout 25 families (Apiaceae, Asteraceae, Brassicaceae, Cannabaceae, Fabaceae, Illiciaceae, Iridaceae, Lamiaceae, Lauraceae, Liliaceae, Myristicaceae, Myrtaceae, Orchidaceae, Papaveraceae, Pedaliaceae, Piperaceae, Poaceae, Ranunculaceae, Rosaceae, Rubiaceae, Rutaceae, Solanaceae, Tiliaceae, Verbenaceae and Zingiberaceae) (Table 2).
Table 1.
General information regarding 68 culinary herbs and spices.
| no |
common name |
scientific name |
country/region |
| 1 |
clove |
Syzygium aromaticum (L.) Merrill et Perry |
Madagascar |
| 2 |
oregano |
Origanum vulgare L. |
Albania |
| 3 |
common thyme |
Thymus vulgaris L. |
Morocco |
| 4 |
peppermint |
Mentha x piperita L. |
Egypt |
| 5 |
lemon balm |
Melissa officinalis L. |
Bulgaria |
| 6 |
Sichuan pepper |
Zanthoxylum bungeanum Maxim. |
China |
| 7 |
sweet marjoram |
Origanum majorana L. |
Egypt |
| 8 |
tarragon |
Artemisia dracunculus L. |
East Europe |
| 9 |
damask rose |
Rosa damascena Mill. |
Pakistan |
| 10 |
rosemary |
Rosmarinus officinalis L. |
Albania |
| 11 |
winter savory |
Satureja montana L. |
Albania |
| 12 |
Japanese pepper |
Zanthoxylum piperitum DC. |
Japan |
| 13 |
cinnamon |
Cinnamomum verum Presl |
Sri Lanka |
| 14 |
common linden |
Tilia x europaea L. |
France |
| 15 |
bay laurel |
Laurus nobilis L. |
Turkey |
| 16 |
perilla |
Perilla frutescens Britton var. acuta Kubo |
China |
| 17 |
true lavender |
Lavandula angustifolia (L.) Mill. |
France |
| 18 |
Japanese mugwort |
Artemisia princeps Pamp. |
Japan |
| 19 |
sage |
Salvia officinalis L. |
Greece |
| 20 |
Roman chamomile |
Chamaemelum nobile (L.) All. |
Egypt |
| 21 |
star anise |
Illicium verum Hook., f. |
China |
| 22 |
nigella |
Nigella sativa L. |
India |
| 23 |
curry leaf tree |
Murray a koenigii (L.) Spreng. |
India |
| 24 |
turmeric |
Curcuma longa L. |
India |
| 25 |
hyssop |
Hyssopus officinalis L. |
Hungary |
| 26 |
allspice |
Pimenta dioica (L.) Merrill |
Mexico |
| 27 |
anise |
Pimpinella anisum L. |
Spain |
| 28 |
brown mustard |
Brassica juncea (L.) Czern. |
India |
| 29 |
nutmeg |
Myristica fragrans Houtt. |
Indonesia |
| 30 |
vanilla |
Vanilla planifolia Andr. |
Madagascar |
| 31 |
Japanese mint |
Mentha arvensis L. var. piperascens Malinv. |
China |
| 32 |
German chamomile |
Matricaria chamomilla L. |
Egypt |
| 33 |
cape jasmine |
Gardenia jasminoides Ellis |
China |
| 34 |
cumin |
Cuminum cyminum L. |
Iran |
| 35 |
lemongrass |
Cymbopogon citratus (DC. Ex Nees) Stapf |
Thailand |
| 36 |
parsley |
Petroselinum crispum (Mill.) Nym. ex A.W. Hill. |
USA |
| 37 |
sweet basil* |
Ocimum basilicum L. |
Egypt |
| 38 |
saffron |
Crocus sativus L. |
Spain |
| 39 |
licorice |
Glycyrrhiza glabra L. |
China |
| 40 |
garden chervil |
Anthriscus cerefolium (L.) Hoffm. |
Germany |
| 41 |
common juniper |
Juniperus communis L. |
Mediterranean |
| 42 |
celery |
Apium graveolens L. |
India |
| 43 |
ginger |
Zingiber officinale Rosc. |
China |
| 44 |
ajwain |
Carum ajowan BENITH. |
India |
| 45 |
pepper |
Piper nigrum L. |
Vietnam |
| 46 |
sweet orange |
Citrus sinensis (L) Osbeck |
Spain |
| 47 |
red pepper |
Capsicum annuum L. |
China |
| 48 |
caraway |
Carum carvi L. |
Netherlands |
| 49 |
cardamon |
Elettaria cardamomum (L.) Maton |
Guatemala |
| 50 |
fenugreek |
Trigonella foenum-graecum L. |
India |
| 51 |
dill** |
Anethum graveolens L. |
India |
| 52 |
fennel |
Foeniculum vulgare Mill. |
China |
| 53 |
coriander*** |
Coriandrum sativum L. |
Morocco |
| 54 |
angelica |
Angelica archangelica L. |
Poland |
| 55 |
sweet basil* |
Ocimum basilicum L. |
Egypt |
| 56 |
chives |
Allium schoenoprasum L. |
China |
| 57 |
common wormwood |
Artemisia absinthium L. |
China |
| 58 |
dill** |
Anethum graveolens L. |
India |
| 59 |
hemp |
Cannabis sativa L. |
China |
| 60 |
sesame |
Sesamum indicum L |
Myanmar |
| 61 |
asafoetida |
Ferula assafoetida L. |
India |
| 62 |
coriander*** |
Coriandrum sativum L. |
Morocco |
| 63 |
watercress |
Nasturtium officinale R. Br. |
France |
| 64 |
poppy |
Papaver somniferum L. |
Turkey |
| 65 |
horseradish |
Armoracia rusticana (Lam) Gaertn., Mey. et Scherb. |
China |
| 66 |
garlic |
Allium sativum L. |
China |
| 67 |
onion |
Allium cepa L. |
USA |
| 68 |
tamarind |
Tamarindus indica L. |
India |
* sweet basil (no. 37: leaf; no. 55: seed),
** dill (no. 51: leaf; no. 58: seed),
*** coriander (no. 53: leaf; no. 62: seed).
Table 2.
ORAC values of 68 culinary herbs and spices.
| no |
common name |
family name |
parts used |
H-ORAC (mmol of TE/g of dry plant) |
L-ORAC (mmol of TE/g of dry plant) |
T-ORAC (mmol of TE/g of dry plant) |
H-ORAC/T-ORAC (%) |
L-ORAC/T-ORAC (%) |
|
|
|
|
means ± SEM |
means ± SEM |
means ± SEM |
ratio of means |
ratio of means |
| 1 |
clove |
Myrtaceae |
bud |
1.19 ± 0.05 |
1.70 ± 0.12 |
2.89 ± 0.17 |
41.2 |
58.8 |
| 2 |
oregano |
Lamiaceae |
leaf |
2.15 ± 0.08 |
0.14 ± 0.03 |
2.29 ± 0.11 |
93.9 |
6.1 |
| 3 |
common thyme |
Lamiaceae |
leaf |
1.55 ± 0.03 |
0.03 |
1.58 ± 0.03 |
98.1 |
1.9 |
| 4 |
peppermint |
Lamiaceae |
leaf |
1.45 ± 0.04 |
0.03 ± 0.01 |
1.48 ± 0.05 |
98.0 |
2.0 |
| 5 |
lemon balm |
Lamiaceae |
leaf |
1.46 ± 0.05 |
0.02 |
1.48 ± 0.05 |
98.6 |
1.4 |
| 6 |
Sichuan pepper |
Rutaceae |
fruit |
1.10 ± 0.07 |
0.29 ± 0.05 |
1.39 ± 0.12 |
79.1 |
20.9 |
| 7 |
sweet marjoram |
Lamiaceae |
leaf |
1.36 ± 0.09 |
0.02 ± 0.01 |
1.38 ± 0.10 |
98.6 |
1.4 |
| 8 |
tarragon |
Asteraceae |
leaf, stem |
1.37 ± 0.05 |
0.01 |
1.38 ± 0.05 |
99.3 |
0.7 |
| 9 |
damask rose |
Rosaceae |
flower |
1.23 ± 0.08 |
0.01 |
1.24 ± 0.08 |
99.2 |
0.8 |
| 10 |
rosemary |
Lamiaceae |
leaf |
1.14 ± 0.06 |
0.06 ± 0.01 |
1.20 ± 0.07 |
95.0 |
5.0 |
| 11 |
winter savory |
Lamiaceae |
leaf |
1.12 ± 0.09 |
0.04 ± 0.01 |
1.16 ± 0.10 |
96.6 |
3.4 |
| 12 |
Japanese pepper |
Rutaceae |
peel |
0.99 ± 0.04 |
0.11 ± 0.01 |
1.10 ± 0.05 |
90.0 |
10.0 |
| 13 |
cinnamon |
Lauraceae |
bark |
1.05 ± 0.05 |
0.01 |
1.06 ± 0.05 |
99.1 |
0.9 |
| 14 |
common linden |
Tiliaceae |
leaf, flower |
0.98 ± 0.03 |
0.02 |
1.00 ± 0.03 |
98.0 |
2.0 |
| 15 |
bay laurel |
Lauraceae |
leaf |
0.91 ± 0.08 |
0.08 |
0.99 ± 0.08 |
91.9 |
8.1 |
| 16 |
perilla |
Lamiaceae |
leaf |
0.91 ± 0.04 |
0.08 ± 0.01 |
0.99 ± 0.05 |
91.9 |
8.1 |
| 17 |
true lavender |
Lamiaceae |
flower |
0.92 ± 0.06 |
0.06 |
0.98 ± 0.06 |
93.9 |
6.1 |
| 18 |
Japanese mugwort |
Asteraceae |
leaf |
0.78 ± 0.09 |
0.01 |
0.79 ± 0.09 |
98.7 |
1.3 |
| 19 |
sage |
Lamiaceae |
leaf |
0.58 ± 0.04 |
0.20 ± 0.01 |
0.78 ± 0.05 |
74.4 |
25.6 |
| 20 |
Roman chamomile |
Asteraceae |
flower |
0.75 ± 0.01 |
0.01 |
0.76 ± 0.01 |
98.7 |
1.3 |
| 21 |
star anise |
Illiciaceae |
fruit |
0.29 |
0.42 ± 0.02 |
0.71 ± 0.02 |
40.8 |
59.2 |
| 22 |
nigella |
Ranunculaceae |
seed |
0.15 ± 0.06 |
0.52 ± 0.03 |
0.67 ± 0.09 |
22.4 |
77.6 |
| 23 |
curry leaf tree |
Rutaceae |
leaf |
0.40 ± 0.06 |
0.11 ± 0.01 |
0.51 ± 0.07 |
78.4 |
21.6 |
| 24 |
turmeric |
Zingiberaceae |
rhizome |
0.24 |
0.26 ± 0.04 |
0.50 ± 0.04 |
48.0 |
52.0 |
| 25 |
hyssop |
Lamiaceae |
leaf, flower |
0.48 ± 0.02 |
0.02 |
0.50 ± 0.02 |
96.0 |
4.0 |
| 26 |
allspice |
Myrtaceae |
fruit |
0.31 ± 0.01 |
0.18 ± 0.02 |
0.49 ± 0.03 |
63.3 |
36.7 |
| 27 |
anise |
Apiaceae |
seed |
0.16 ± 0.01 |
0.30 ± 0.09 |
0.46 ± 0.10 |
34.8 |
65.2 |
| 28 |
brown mustard |
Brassicaceae |
seed |
0.45 |
0.01 |
0.46 |
97.8 |
2.2 |
| 29 |
nutmeg |
Myristicaceae |
kernel |
0.12 ± 0.01 |
0.33 ± 0.07 |
0.45 ± 0.08 |
26.7 |
73.3 |
| 30 |
vanilla |
Orchidaceae |
fruit |
0.13 ± 0.01 |
0.32 ± 0.03 |
0.45 ± 0.04 |
28.9 |
71.1 |
| 31 |
Japanese mint |
Lamiaceae |
leaf, stem |
0.39 ± 0.01 |
0.05 |
0.44 ± 0.01 |
88.6 |
11.4 |
| 32 |
German chamomile |
Asteraceae |
flower |
0.38 ± 0.01 |
0.06 |
0.44 ± 0.01 |
86.4 |
13.6 |
| 33 |
cape jasmine |
Rubiaceae |
fruit |
0.21 ± 0.01 |
0.20 ± 0.03 |
0.42 ± 0.04 |
50.0 |
47.6 |
| 34 |
cumin |
Apiaceae |
seed |
0.34 ± 0.01 |
0.08 ± 0.03 |
0.42 ± 0.01 |
81.0 |
19.0 |
| 35 |
lemongrass |
Poaceae |
leaf |
0.25 ± 0.01 |
0.15 ± 0.02 |
0.40 ± 0.03 |
62.5 |
37.5 |
| 36 |
parsley |
Apiaceae |
leaf, stem |
0.39 ± 0.01 |
0.01 ± 0.01 |
0.40 ± 0.02 |
97.5 |
2.5 |
| 37 |
sweet basil |
Lamiaceae |
leaf |
0.37 ± 0.01 |
0.02 |
0.39 ± 0.01 |
94.9 |
5.1 |
| 38 |
saffron |
Iridaceae |
pistil |
0.35 ± 0.01 |
0.03 |
0.38 ± 0.01 |
92.1 |
7.9 |
| 39 |
licorice |
Fabaceae |
rhizome |
0.36 ± 0.01 |
0.01 |
0.37 ± 0.01 |
97.3 |
2.7 |
| 40 |
garden chervil |
Apiaceae |
leaf |
0.36 ± 0.01 |
0.01 |
0.37 ± 0.01 |
97.3 |
2.7 |
| 41 |
common juniper |
Verbenaceae |
fruit |
0.19 ± 0.01 |
0.17 ± 0.05 |
0.36 ± 0.06 |
52.8 |
47.2 |
| 42 |
celery |
Apiaceae |
seed |
0.19 ± 0.01 |
0.16 ± 0.03 |
0.35 ± 0.04 |
54.3 |
45.7 |
| 43 |
ginger |
Zingiberaceae |
rhizome |
0.07 ± 0.01 |
0.26 ± 0.05 |
0.33 ± 0.06 |
21.2 |
78.8 |
| 44 |
ajwain |
Apiaceae |
seed |
0.22 ± 0.01 |
0.12 ± 0.01 |
0.33 ± 0.03 |
66.7 |
36.4 |
| 45 |
pepper |
Piperaceae |
fruit |
0.17 ± 0.01 |
0.15 ± 0.01 |
0.32 ± 0.02 |
53.1 |
46.9 |
| 46 |
sweet orange |
Rutaceae |
peel |
0.30 ± 0.01 |
0.01 |
0.31 ± 0.01 |
96.8 |
3.2 |
| 47 |
red pepper |
Solanaceae |
fruit |
0.14 ± 0.01 |
0.16 ± 0.05 |
0.30 ± 0.06 |
46.7 |
53.3 |
| 48 |
caraway |
Apiaceae |
seed |
0.11 |
0.14 ± 0.04 |
0.25 ± 0.04 |
44.0 |
56.0 |
| 49 |
cardamon |
Zingiberaceae |
fruit |
0.04 ± 0.01 |
0.21 ± 0.03 |
0.25 ± 0.04 |
16.0 |
84.0 |
| 50 |
fenugreek |
Fabaceae |
seed |
0.16 ± 0.01 |
0.09 ± 0.01 |
0.25 ± 0.02 |
64.0 |
36.0 |
| 51 |
dill |
Apiaceae |
leaf |
0.23 ± 0.01 |
0.02 ± 0.01 |
0.25 ± 0.02 |
92.0 |
8.0 |
| 52 |
fennel |
Apiaceae |
seed |
0.11 ± 0.01 |
0.11 |
0.22 ± 0.01 |
50.0 |
50.0 |
| 53 |
coriander |
Apiaceae |
leaf |
0.19 ± 0.01 |
0.01 |
0.20 ± 0.01 |
95.0 |
5.0 |
| 54 |
angelica |
Apiaceae |
root |
0.13 |
0.06 ± 0.01 |
0.19 ± 0.01 |
68.4 |
31.6 |
| 55 |
sweet basil |
Lamiaceae |
seed |
0.08 ± 0.01 |
0.10 ± 0.01 |
0.18 ± 0.02 |
44.4 |
55.6 |
| 56 |
chives |
Liliaceae |
leaf |
0.17 ± 0.01 |
0.00 |
0.17 ± 0.01 |
>99.9 |
<0.1 |
| 57 |
common wormwood |
Asteraceae |
leaf |
0.16 |
0.01 |
0.17 |
94.1 |
5.9 |
| 58 |
dill |
Apiaceae |
seed |
0.14 |
0.02 ± 0.01 |
0.16 ± 0.01 |
87.5 |
12.5 |
| 59 |
hemp |
Cannabaceae |
seed |
0.03 |
0.12 ± 0.01 |
0.15 ± 0.01 |
20.0 |
80.0 |
| 60 |
sesame |
Pedaliaceae |
seed |
0.03 |
0.11 ± 0.01 |
0.14 ± 0.01 |
21.4 |
78.6 |
| 61 |
asafoetida |
Apiaceae |
rhizome |
0.09 |
0.04 ± 0.01 |
0.13 ± 0.01 |
69.2 |
30.8 |
| 62 |
coriander |
Apiaceae |
seed |
0.05 |
0.08 ± 0.03 |
0.13 ± 0.03 |
38.5 |
61.5 |
| 63 |
watercress |
Brassicaceae |
leaf |
0.08 ± 0.01 |
0.03 |
0.11 ± 0.01 |
72.7 |
27.3 |
| 64 |
poppy |
Papaveraceae |
seed |
0.01 |
0.07 ± 0.01 |
0.08 ± 0.01 |
12.5 |
87.5 |
| 65 |
horseradish |
Brassicaceae |
rhizome |
0.04 |
0.01 |
0.05 |
80.0 |
20.0 |
| 66 |
garlic |
Liliaceae |
bulb |
0.03 ± 0.01 |
0.01 |
0.04 ± 0.01 |
75.0 |
25.0 |
| 67 |
onion |
Liliaceae |
bulb |
0.04 |
0.00 |
0.04 |
>99.9 |
<0.1 |
| 68 |
tamarind |
Fabaceae |
fruit |
0.03 |
0.00 |
0.03 |
>99.9 |
<0.1 |
Each value represents the mean ± SEM (n = 3).
In vitro assay of ORAC values The ORAC for each plant material was evaluated according to the methods of Prior et al. (2003). Hexane (10 mL × 2) was added to the dried plant (1 g), followed by vortexing (30 sec) and sonication (37°C, 5 min). After centrifugation (2500 g, 15 min), the hexane layer was collected.
The solution for the L-ORAC assay was prepared as follows. The hexane solution was concentrated. The dried hexane extract was dissolved in acetone (10 mL) and then diluted with 7% (w/v) randomly methylated β-cyclodextrin (RMCD) solution (50% acetone/50% water, v/v). The 7% RMCD solution was used as a blank.
The solution for the H-ORAC assay was prepared as follows. The residue, which was separated by hexane extraction, was extracted with acetone/water/acetic acid (70:29.5:0.5, v/v/v, 10 mL). The extract was vortexed (30 sec), followed by sonication (37°C, 5 min). After standing for 10 min with occasional shaking, the extract was filtered. The filtrate was diluted to a total volume of 25 mL with acetone/water/acetic acid (70:29.5:0.5, v/v/v).
The H-ORAC and L-ORAC assays were carried out as follows. As the standard, trolox (6-hydroxy-2,5,7,8-tetra-methylchroman-2-carboxylic acid; Sigma-Aldrich, St. Louis, MO, USA) calibration solutions (0 – 200 µM) were pipetted into a 96-well microplate. Each sample (15 µL) and 150 µL of 0.2 µM fluorescein sodium salt (Sigma-Aldrich) solution diluted with 75 mM phosphate buffer (pH 7.0) were pipetted into the 96-well microplate, and incubated at 37°C for 10 min. After the addition of 60 µL of 30 mM AAPH (Wako Pure Chemical Industries, Ltd., Osaka, Japan) solution diluted with 75 mM phosphate buffer (pH 7.0), the microplate was placed immediately in a microplate reader (Wallac 1420 Victor 2, Perkin-Elmer Inc., Minneapolis, MN, USA) preheated to 37°C. Fluorescence was recorded at an excitation wavelength of 485 nm and an emission wavelength of 535 nm. The calculation of net area under the curve (AUC) was obtained from the difference of AUC between the sample and the blank (phosphate buffer only). ORAC was expressed as mmol/Trolox equivalents (TE)/g of dried plant, which was calculated using the calibration curve generated in each assay.
Sensory testing of 10 Lamiaceae plants possessing high T-ORAC values Hot water (100°C, 50 mL) was added to each dry material (0.5 g) of 10 plants (clove, oregano, common thyme, peppermint, lemon balm, Sichuan pepper, sweet marjoram, tarragon, damask rose and rosemary). The extract was obtained after immersing samples in boiling water for 3 min. Lemon balm extract was used as the standard of bitterness intensity because it had the lowest bitterness among the 10 plants. The bitterness intensity of each extract was evaluated by four evaluators using a two-fold dilution method. The evaluation was carried out with nose clips to exclude the effect of odor.
Preparation of hydrophilic fractions of three Lamiaceae plants Lamiaceae plants (peppermint, lemon balm, rosemary; 10 g each) were crushed and extracted with 50% aqueous ethanol (100 g) for 10 min at room temperature. After filtration of the mixture, distilled water (DW) was added to the filtrate to adjust the concentration to 30% ethanol. The 30% aqueous ethanol solution was passed through SEPABEADS® SP70 (Mitsubishi Chemical Co., Ltd., Tokyo, Japan), a synthetic absorbent, and subjected to the H-ORAC assay. Then, the eluent was evaporated and freeze-dried under vacuum. The yields of hydrophilic fractions of peppermint (PE), lemon balm (LB) and rosemary (RM) were 2.0 g, 2.3 g and 1.4 g, respectively.
HPLC analysis of PE, LB and RM The HPLC/UV chromatograms of PE, LB and RM were obtained using an Agilent 1200 Series HPLC system equipped with a diode array detector (Agilent Technologies, Santa Clara, CA, USA) and a CAPCELL PAK C18MG column (250 mm × 4.6 mm i.d.; particle size, 5 µm; Shiseido, Tokyo, Japan). The operating conditions were as follows: column oven temperature, 40°C; mobile phase, a linear gradient from 100% solvent A (10% acetonitrile adjusted to pH 2.5 by phosphoric acid) to 100% solvent B (acetonitrile) in 30 min; flow rate, 1 mL/min; and injection volume, 20 µL, detection, 280 nm (eriocitrin) and 310 nm (rosmarinic acid). All samples were filtered through a 0.45 µm PTFE membrane-filter (DISMIC-13HP, Toyo Roshi Kaisha, Ltd., Tokyo, Japan) prior to injection.
Animals and experimental design All procedures were performed in accordance with the Guidelines for Animal Experiments of the College of Bioresource Sciences of Nihon University (approval number, AP11B013). Six-week-old male Sprague-Dawley SPF rats (weighing 230 – 250 g at the onset of experiments) (Japan SLC, Inc., Shizuoka, Japan) were used in this study. Rats were housed individually at 22 ± 2°C under a controlled 12 h light/darkness cycle with free access to chow (CE-2, CLEA Japan, Inc., Tokyo, Japan) and tap water for one week. The rats were randomly allocated to 8 groups of 6 animals each (group I (DW, normal control), group II (PE), group III (LB), group IV (RM), group V (DW + CCl4, CCl4 model control), group VI (PE + CCl4), group VII (LB + CCl4) and group VIII (RM + CCl4)). PE, LB or RM was dissolved in water at a final concentration of 10% (w/v) and intragastrically administered (1 g/kg of body weight) for 5 days under unanesthetized conditions. The same volume of water was administered to groups I and V. On the sixth day, 50% CCl4 in olive oil (1 mL/kg) was intraperitoneally injected into the rats belonging to groups V – VIII. After fasting for 20 hours, blood and liver samples of all rats (groups I – VIII) were collected under anesthesia. Blood samples were drawn from the abdominal aorta. Liver samples were homogenized with 0.1 M potassium phosphate buffer containing 0.25 M sucrose solution (pH 7.4, 4 times the liver weight) and centrifuged (10000 g, 4°C, 15 min). The supernatant was further centrifuged (105000 g, 4°C, 60 min) to separate the cytosolic (supernatant) and microsomal (precipitate) fractions. The mixture of 0.1 M potassium phosphate buffer containing 0.25 M sucrose solution (pH 7.4, 5 mL) was added to the precipitate.
Biochemical assays After centrifugation (1500 g, 4°C, 15 min) of the blood samples, the supernatants were obtained as serum samples. Aspartate aminotransferase (AST) and alanine aminotransferase (ALT) activities in each serum sample were measured using the dry clinical chemical analyzer SpotChem™ EZ SP-4403 (Arkray Inc., Kyoto, Japan).
Liver lipid peroxidation was determined by measuring the formation of thiobarbituric acid reactive substances (TBARS) (Uchiyama and Mihara, 1978). A mixture of 1% phosphoric acid (0.3 mL) and 0.67% thiobarbituric acid (TBA, 1.0 mL) was added to the liver homogenate solution (0.5 mL), the reference solution of malondialdehyde (MDA) (0.5 mL) for a calibration curve and saline (0.5 mL) as a control, respectively. Each mixture was heated at 95°C for 45 min with continuous stirring. After cooling to room temperature, n-butanol (4 mL) was added to the mixture, followed by vigorous shaking. The n-butanol layer was separated by centrifugation (2650 g, 10 min). The value of TBARS was calculated from the difference in absorbance at 535 nm and 520 nm using a spectrophotometer (Cary 50; Varian Medical Systems, Inc., Palo Alto, CA, USA). The value of TBARS was expressed as nmol of MDA equivalents per mg of protein.
Superoxide dismutase (SOD) activity was obtained by measuring the inhibition rate of the formation of water insoluble blue formazan produced from the reaction of nitro blue tetrazolium (NBT) and O2−• (Beauchamp and Fridovich, 1971). A mixture of 50 mM sodium carbonate buffer (pH 10.2, 960 µL) containing 0.1 mM xanthine, 0.025 mM NBT and 0.1 mM sodium-EDTA was preincubated at 25°C. The absorbance of the mixture at 560 nm was defined as the initial value. The liver cytosolic fraction (20 µL) and xanthine oxidase (20 µL) were added to the mixture to form formazan. The absorbance of formazan was measured at 560 nm for 5 min using a spectrophotometer (Cary 50). The value of the blank was measured by the addition of 0.1 M potassium phosphate buffer containing 0.25 M sucrose (pH 7.4) instead of the liver cytosolic fraction. The activity of SOD was expressed as units/min/mg of protein.
The activity of glutathione S-transferase (GST) was obtained by measuring the formation rate of S-(2,4-dinitrophenyl)glutathione produced by the conjugation of glutathione with 1-chloro-2,4-dinitrobenzene (Habig et al., 1974). A mixture of 30 mM glutathione (60 µL) and 0.1 M potassium phosphate buffer (pH 7.4, 1.48 mL) was prepared and maintained at 37°C. The absorbance of the mixture at 340 nm was defined as the initial value. The liver cytosolic fraction (300 µL) and 30 mM 1-chloro-2,4-dinitrobenzene (60 µL) were added to the mixture. The absorbance of S-(2,4-dinitrophenyl)-glutathione was measured at 340 nm for 5 min using a spectrophotometer (Cary 50). The value of the blank was obtained by measurement of 0.1 M potassium phosphate buffer containing 0.25 M sucrose (pH 7.4) instead of the cytosolic fraction. The activity of GST was expressed as µmol/min/mg of protein.
The activity of CYP2E1 was obtained by measuring the formation rate of p-nitrocatechol produced by the hydroxylation of p-nitrophenol (Chang et al., 1998). A mixture containing 440 µL of 50 mM potassium phosphate buffer (pH 7.4), 10 µL of 5 mM p-nitrophenol in potassium buffer (pH 7.4), 25 µL of solution containing 26 mM NADP+, 66 mM D-glucose-6-phosphate and 66 mM magnesium chloride, and 5 µL of 5 mM sodium citrate solution containing glucose-6-phospate dehydrogenase (40 U/mL) was warmed at 37°C. The liver microsomal fraction (equivalent to 5 mg/mL of protein) was added to the mixture, followed by incubation at 37°C for 30 min in the dark. Then, 20% trichloroacetic acid (100 µL) was added to stop the reaction. After cooling under ice-cold conditions and centrifugation (13000 g, 5 min), the supernatant (500 µL) was separated. A solution of 2 M sodium hydroxide (250 µL) was added to the supernatant. The absorbance of p-nitrocatechol at 535 nm was measured using a spectrophotometer (UV-mini 1240, Shimadzu Corp., Kyoto, Japan). The value of the blank was obtained from the microsomal fraction boiled for 5 min to inactivate the enzyme. The activity of CYP2E1 was expressed as nmol/min/mg of protein.
Protein contents were determined by a BCA™ protein assay kit (Wako Pure Chemical Industries, Ltd.) using bovine serum albumin as a standard.
Statistical analysis Results are presented as means ± SEM. Statistical analysis was conducted by one-way ANOVA with Tukey's multiple-comparison post-hoc test using the commercially available software package GraphPad Prism version 5 (GraphPad Software, Inc., San Diego, CA, USA). A probability value of p < 0.05 was regarded as significant.
Results
Antioxidant activities of 68 culinary herbs and spices H-, L- and T-ORAC values of 68 culinary herbs and spices are shown in Table 2. T-ORAC values ranged from 0.03 ± 0.00 to 2.89 ± 0.17 mmol of TE/g of dry plant. Clove possessed the highest T-ORAC (2.89 ± 0.17 mmol of TE/g of dry plant) of all plants, with L-ORAC (1.70 ± 0.12 mmol of TE/g of dry plant) being higher than H-ORAC (1.19 ± 0.05 mmol of TE/g of dry plant). Six Lamiaceae leaves (oregano, common thyme, peppermint, lemon balm, sweet marjoram and rosemary; T-ORAC from 1.20 ± 0.07 to 2.29 ± 0.11 mmol of TE/g of dry plant) were included among the top 10 plants exhibiting high T-ORAC (from 1.20 ± 0.07 to 2.89 ± 0.17 mmol of TE/g of dry plant). Their H-ORACs made up 93.9 – 98.6% of T-ORAC. In addition, even for other Lamiaceae leaves or flowers (winter savory, perilla, true lavender, sage, hyssop, Japanese mint and sweet basil leaf), H-ORAC was higher than L-ORAC. In contrast, sixteen plants (clove, star anise, nigella, turmeric, anise, nutmeg, vanilla, ginger, red pepper, caraway, cardamom, sweet basil seed, hemp, sesame, coriander seed and poppy) showed higher L-ORAC compared to H-ORAC. As for the plant parts assessed, eight were seeds (nigella, anise, caraway, sweet basil seed, hemp, sesame, coriander seed and poppy), four were fruits (star anise, vanilla, red pepper and cardamom) and two were rhizomes (turmeric and ginger).
Bitterness of extracts of top 10 plant extracts possessing high T-ORAC values As shown in Fig. 1, the bitterness intensity of the hot water extracts decreased in the order: clove > rosemary > oregano > Sichuan pepper > damask rose > sweet marjoram > common thyme > peppermint, tarragon > lemon balm.
Content and dose of eriocitrin and rosmarinic acid The content of eriocitrin, a main component of PE, was 296 mg/g in PE, and that of rosmarinic acid, a main component of LB and RM, was 157 mg/g in LB and 119 mg/g in RM, respectively. Therefore, the dose of eriocitrin was 296 mg/kg of body weight for the PE administered group, and that of rosmarinic acid was 157 mg/kg of body weight for the LB administered group and 119 mg/kg of body weight for the RM administered group.
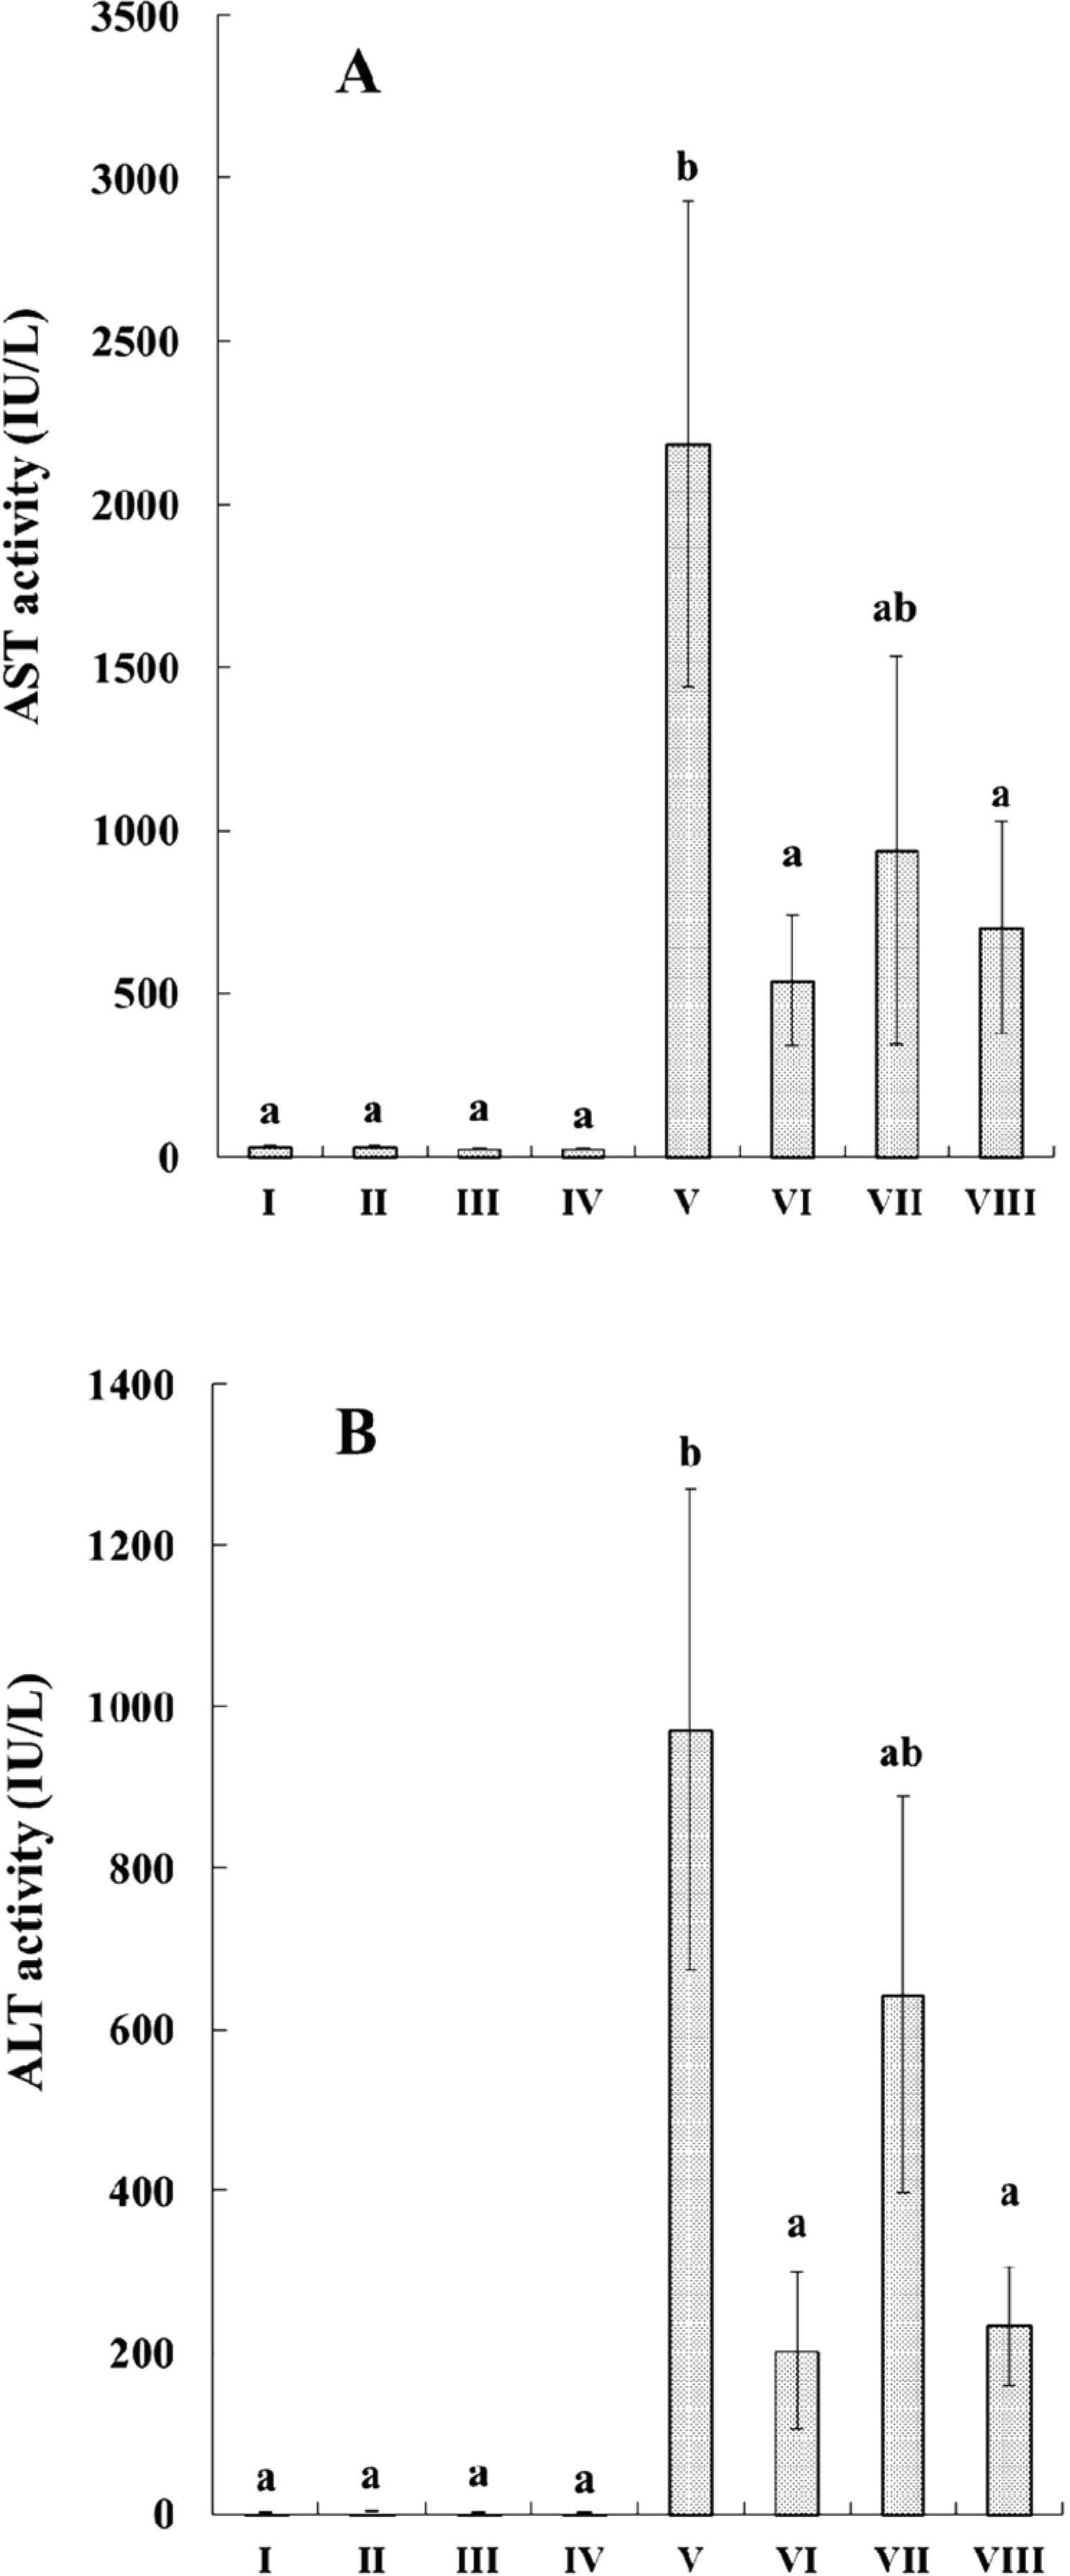
Effects on hepatotoxicity indices AST and ALT activities in serum were used for the evaluation of hepatic disorder. As shown in Fig. 2A and 2B, the administration of LB, PE or RM did not affect the enzyme activities of either normal control. However, after CCl4 administration, the activities of AST and ALT significantly increased compared to that of the normal controls. In contrast, the administration of PE or RM significantly reduced elevated AST and ALT activities induced by CCl4 administration. As for LB administration, a similar tendency was observed.
Effects on hepatic oxidative indices As shown in Fig. 3, CCl4 administration significantly increased the TBARS level compared to the normal control. In contrast, the administration of PE, LB or RM significantly suppressed the elevation of TBARS induced by CCl4 administration.
Effects on antioxidant enzyme As shown in Fig. 4, the administration of LB, PE or RM did not induce SOD, an endogenous antioxidant enzyme. After CCl4 administration, SOD activity significantly decreased compared to that of the normal control, and was significantly recovered by the administration of PE, LB or RM.
Effects on detoxification enzymes As shown in Fig. 5, the administration of LB, PE or RM did not induce GST, a phase II detoxification enzyme. After CCl4 administration, the GST activity significantly decreased compared to that of normal control, and was recovered by the administration of PE, LB or RM, although not significantly so.
As shown in Fig. 6, the administration of LB, PE or RM did not affect the activity of CYP2E1, a phase I detoxification enzyme. After CCl4 administration, CYP2E1 activity significantly decreased compared to that of the normal control. PE, LB or RM administration did not restore CYP2E1 activity.
Discussion
In identifying antioxidants from culinary plants effective against oxidative stress in vivo, initial comparative study on their activities in vitro represents a good starting point. However, to date, reports on culinary herbs and spices remain limited (Zheng and Wang, 2001; Wu et al., 2004; Shan et al., 2005). In general, it is difficult to make comparisons between the antioxidative activity of plant extracts from these reports because of differences in assay conditions and the form of plant materials (fresh or dried). The aim of this study was to compare the data on 68 culinary herbs and spices, which comprised 25 families, under the same experimental conditions. Cultivating conditions such as production area, weather and harvest time can affect the content of secondary metabolites in plants. However, this study did not evaluate factors that influence antioxidative activity.
In this study, Lamiaceae leaves or flowers were found to have higher antioxidative activity compared to plants belonging to the other 24 families. In addition, the activities of the hydrophilic fractions were significantly higher than those of the lipophilic fractions. The ORAC assay is based on a hydrogen atom transfer (HAT) mechanism; therefore, phenolic compounds might predominantly contribute towards transferring one hydrogen atom to the peroxyl radical (ROO•). While the relation between total polyphenolic components and antioxidative capacity is not strong (Kähkönen et al., 1999), any hydrophilic polyphenols could predominantly contribute to the high H-ORAC values in Lamiaceae plants (Carnat et al., 1998; Dorman et al., 2003, 2004; Koşar et al., 2004; Fecka and Turek, 2007; Torras-Claveria et al., 2007; Dastmalchi et al., 2008; Barros et al., 2013).
Furthermore, the H-ORAC to L-ORAC ratio was associated not only with the plant family but also with the plant part assessed. In general, the seeds of many plants show higher L-ORAC compared to H-ORAC. For sweet basil (Fam. Lamiaceae), the seeds provided higher L-ORAC than H-ORAC; in contrast, the leaf showed higher H-ORAC than L-ORAC. Coriander seed and leaf also showed a similar tendency. Seed oil, obtained from herbs, spices and fruits, contains a variety of lipophilic compounds such as tocopherols, carotenoids, lignans and unsaturated fatty acids, which act differently in vivo compared to hydrophilic compounds (Yu et al., 2005; Parry et al., 2006). Therefore, it is necessary to properly select the plant species and parts for in vivo study.
In the context of high antioxidative activity and low bitterness, we selected peppermint and lemon balm from the top 10 plants possessing high T-ORAC values for an in vivo study of oxidative stress. Rosmarinic acid is commonly the main component in both rosemary and lemon balm. In addition, rosemary is well-known and widely used as an antioxidant in foods (Shahidi, 2000; Etter, 2004). Therefore, although the bitterness intensity of the hot water extract of rosemary was not weak, rosemary was included in vivo study.
Furthermore, to improve the flavor of foods, any odorants enhancing bitterness through odor-taste interactions should be eliminated (Caporale et al., 2004; Salles, 2006). Therefore, we removed the lipophilic odorants (essential oils) from the extracts of peppermint, lemon balm and rosemary, and prepared the hydrophilic fractions, PE, LB and RM, respectively. Through this process, carnosol and carnosic acid, which are reported to be highly bitter lipophilic-diterpenoids in rosemary (Charles, 2012), were also removed. Consequently, the bitterness intensity of PE, LB and RM decreased compared to peppermint, lemon balm and rosemary extracts, respectively (data not shown).
Lipid peroxidation by CCl4 administration plays a significant role in hepatic injury, such as inactivation of the endogenous antioxidative enzymes and damage to cell membranes followed by the release of marker enzymes into the serum (Lee and Park, 1995; Koh et al., 1999; Weber et al., 2003; Masuda, 2006).
The TBARS assay can measure hydroperoxides and aldehydes produced during lipid peroxidation, and is usually expressed as MDA equivalents. TBARS is used as an index of oxidative damage (Botsoglou et al., 1994; Devasagayam, et al., 2003). SOD, an endogenous antioxidant enzyme that defends against reactive oxygen species formed by oxidative stress, is reported to transform O2−• into H2O2, which is finally converted to H2O by the action of catalase and glutathione peroxidase (Halliwell et al., 1992). In addition, the leakage of marker enzymes such as AST and ALT in serum after CCl4 administration is reported to be strongly related to histological changes in hepatic cells (Nagase and Tanaka, 1980; Sallie et al., 1991).
In the present study, hepatic injury was evidenced by a significant elevation in TBARS, decrease in the activity of SOD, and increase in AST and ALT activities in CCl4-treated rats. Notably, the administration of PE, LB or RM decreased TBARS levels and restored SOD activity, leading to decreases in the activities of AST and ALT in serum. As the H-ORAC values of peppermint, lemon balm and rosemary were high in the in vitro study, any antioxidative components in PE, LB and RM could have significantly contributed to the inhibition of lipid peroxidation by scavenging free radical species.
Peppermint extract contains a variety of antioxidants (Duband et al., 1992; Guédon et al., 1994; Fecka and Turek, 2007; Koşar et al., 2004). Among them, eriocitrin was identified as the main polyphenolic component. Eriocitrin is reported to have high antioxidative activities such as 1,1-diphenyl-2-picrylhydrazyl (DPPH) radical scavenging activity, superoxide anion radical scavenging activity, inhibition of linoleic acid peroxidation and H2O2 scavenging activity (Miyake et al., 1997; Miyake et al., 1998; Sroka et al., 2005; Miyake et al., 2007). In addition, Minato et al. (2003) reported that eriocitrin in lemon peel might control changes in glutathione redox status, followed by the prevention of oxidative damage induced by acute exercise. Miyake et al. (2000) suggested that eriocitrin metabolites such as eriodictyol and 3,4-dihydroxyhydrocinnamic acid formed by the action of intestinal bacteria would be absorbed into plasma followed by an inhibition of lipid peroxidation. Therefore, eriocitrin in PE and its metabolites would prevent oxidative stress by scavenging free radicals produced from CCl4 and controlling redox system. Further studies are needed to assess the hepatoprotective effects of eriocitrin administration on CCl4-induced oxidative stress.
As for the rosemary extract, the hepatoprotective effect on CCl4-induced oxidative damage in rats has been reported (Sotelo-Félix et al., 2002; Gutiérrez et al., 2010). In addition, Aruoma et al. (1992) reported that carnosol and carnosic acid, powerful antioxidative components in rosemary extract, strongly contributed to the antioxidative activity of rosemary extract and effectively inhibited lipid peroxidation. However, in this study, carnosol and carnosic acid were not detected in RM. Therefore, components other than carnosol and carnosic acid might contribute to the hepatoprotective effect of RM. Li et al. (2010) and Domitrović et al. (2013) reported that rosmarinic acid exerted hepatoprotective effects against CCl4-induced oxidative stress. The DPPH and H2O2 scavenging activities of rosmarinic acid were reported to be almost equal to those of eriocitrin (Sroka et al., 2005). Rosmarinic acid was absorbed and metabolized as conjugated and/or methylated forms, and the majority of rosmarinic acid absorbed was also degraded into conjugated and/or methylated forms of caffeic acid, ferulic acid and m-coumaric acid (Baba et al., 2004). Therefore, rosmarinic acid and its metabolites would contribute to the suppression of oxidative stress by scavenging free radicals and H2O2. Rosmarinic acid is a main polyphenolic component not only in RM but also in LB. The content of rosmarinic acid in LB was higher than that in RM, but the activities of AST and ALT with LB administration were lower compared to those with RM administration. Therefore, further study of the relation between the rosmarinic acid dose and its hepatoprotective effect is needed.
GST, a phase II detoxification enzyme, plays an important role in detoxification by catalyzing the nucleophilic attack of glutathione on electrophilic substances (glutathione conjugation), altering xenobiotics to less toxic compounds (Armstrong, 1997). Furthermore, GST exerts protective effects not only by detoxification in a cellular environment but also through antioxidative activities in cooperation with antioxidative enzymes such as glutathione peroxidase, glutathione reductase, catalase and SOD (Singh et al., 2008; Srivastava and Shivanandappa, 2010). The decreased activity of GST after CCl4 treatment was likely because of the release of GST from liver cells into the serum, resulting from free radical damage to the cell membrane (Lee et al., 1991; Sheweita et al., 2001). On the other hand, the administration of PE, LB and RM suppressed the decrease in GST activity caused by CCl4 administration. As for rosemary, its potent antioxidant, carnosol, is reported to ameliorate the decrease in GST activity by CCl4 administration in rats (Singletary, 1996; Sotelo-Felix et al., 2002). However, as RM did not contain carnosol, some other antioxidants such as orthophenolic compounds (Fiander and Schneider, 2000) might have captured reactive radicals and suppressed the inactivation of GST. Further studies are necessary to confirm the in vivo effect of rosmarinic acid, a main component in RM and LB, and eriocitrin, a main component in PE, on suppression of enzyme inactivation caused by CCl4 administration.
In conclusion, the comparative study of 68 culinary herbs and spices clarified that H-ORAC and L-ORAC values are related not only to the plant species, but also to the plant part assessed. Six Lamiaceae plants were contained among the top 10 plants possessing high T-ORAC, with H-ORAC contributing > 90% of T-ORAC. Taking into account the ORAC assay results and the sensory evaluation of bitterness, we then compared the hepatoprotective effects of the hydrophilic fractions of three selected Lamiaceae plants (peppermint, lemon balm and rosemary) on CCl4-induced oxidative stress in rats. The antioxidative components in these plant extracts might play an important role in hepatoprotective effects through anti-peroxidation. The hydrophilic fractions of these three Lamiaceae plants, in which bitterness and lipophilic odorants were reduced, may be useful as foodstuffs for liver protection. In this report, the hepatoprotective effect was confirmed using one dose for each sample; therefore, further investigation of the relations between sample dose and effects are needed.
Acknowledgments We are grateful to Ms. Satsuki Inagaki (Maihama Research Center, Ogawa & Company, Ltd.) for her technical assistance.
References
- Armstrong, R. N. (1997). Structure, catalytic mechanism and evolution of the glutathione transferases. Chem. Res. Toxicol., 10, 2-18.
- Aruoma, O. I., Halliwell, B., Aeschbach, R., and Löligers, J. (1992). Antioxidant and pro-oxidant properties of active rosemary constituents: carnosol and carnosic acid. Xenobiotica, 22, 257-268.
- Asimov, I. (2007). Cellular responses to oxidative stress: adaptation, damage, repair, senescence and death. In “Free Radicals in Biology and Medicine, 4th edition” ed. by Halliwell, B., and Gutteridge, J. M. C., Oxford University Press Inc., New York, USA, pp. 187-267.
- Baba, S., Osakabe, N., Natsume, M., and Terao, J. (2004). Orally administered rosmarinic acid is present as the conjugated and/or methylated forms in plasma, and is degraded and metabolized to conjugated forms of caffeic acid, ferulic acid and m-coumaric acid. Life Sciences, 75, 165-178.
- Barros, L., Dueñas, M., Dias, M. I., Sousa, M. J., Santos-Buelga, C., and Ferreira, I. C. F. R. (2013). Phenolic profiles of cultivated, in vitro cultured and commercial samples of Melissa officinalis L. infusions. Food Chem., 136, 1-8.
- Beauchamp, C. and Fridovich, I. (1971). Superoxide dismutase: improved assays and an assay applicable to acrylamide gels. Anal. Biochem., 44, 276-287.
- Botsoglou, N. A., Fletouris, D. J., Papageorgiou, G. E., Vassilopoulos, V. N., Mantis, A. J., and Trakatellis, A. G. (1994). Rapid, sensitive, and specific thiobarbituric acid method for measuring lipid peroxidation in animal tissue, food, and feedstuff samples. J. Agric. Food Chem., 42, 1931-1937.
- Botsoglou, N. A., Taitzoglou, I. A., Botsoglou, E., Lavrentiadou, S. N., Kokoli, A. N., and Roubies, N. (2008). Effect of long-term dietary administration of oregano on the alleviation of carbon tetrachloride-induced oxidative stress in rats. J. Agric. Food Chem., 56, 6287-6293.
- Caporale, G., Policastro, S., and Monteleone, E. (2004). Bitterness enhancement induced by cut grass odorant (cis-3-hexen-1-ol) in a model olive oil. Food Qual. Pref., 15, 219-227.
- Carnat, A. P., Carnat, A., Fraisse, D., and Lamaison, J. L. (1998). The aromatic and polyphenolic composition of lemon balm (Melissa officinalis L. subsp. officinalis) tea. Pharm. Acta Helv., 72, 301-305.
- Chang, T. K. H., Crespi, C. L., and Waxman, D, J. (1998). Spectrophotometric analysis of human CYP2E1-catalyzed p-nitrophenol hydroxylation. (1998). Methods Mol. Biol., 107, 147-152.
- Charles, D. J. (2012). Rosemary. In “Antioxidant Properties of Spices and Other Sources” Springer Science+Business Media, New York, USA, pp. 495-507.
- Dastmalchi, K., Dorman, H. J. D., Oinonen, P. P., Darwis, Y., Laakso, I., and Hiltunen, R. (2008). Chemical composition and in vitro antioxidative activity of a lemon balm (Melissa officinalis L.) extract. LWT, 41, 391-400.
- Deshpande, U. R., Gadre, S. G., Raste, A. S., Pillai, D., Bhide, S. V., and Samuel, A. M. (1998). Protective effect of turmeric (Curcuma longa L.) extract on carbon tetrachloride-induced liver damage in rats. Indian J. Exp. Biol., 36, 573-577.
- Devasagayam, T. P. A., Boloor, K. K., and Ramasarma, T. (2003). Methods for estimating lipid peroxidation: an analysis of merits and demerits. Indian J. Biochem. Biophys., 40, 300-308.
- Domitrović, R., Škoda, M., Marchesi, V. V., Cvijanović, O., Pugel, E. P., and Štefan, M. B. (2013). Rosmarinic acid ameliorates acute liver damage and fibrogenesis in carbon tetrachloride-intoxicated mice. Food Chem. Toxicol., 51, 370-378.
- Dorman, H. J. D., Bachmayer, O., Kosar, M., and Hiltumen, R. (2004). Antioxidant properties of aqueous extracts from selected Lamiaceae species grown in Turkey. J. Agric. Food Chem., 52, 762-770.
- Dorman, H. J. D., Koşar, M., Kahlos, K., Holm, Y., and Hiltunen, R. (2003). Antioxidant properties and composition of aqueous extracts from Mentha species, hybrids, varieties, and cultivars. J. Agric. Food Chem., 51, 4563-4569.
- Drewnowski, A. and Gomez-Carneros, C. (2000). Bitter taste, phytonutrients, and the consumer: a review. Am. J. Clin. Nutr., 72, 1424-1435.
- Duband, F., Carnat, A. P., Carnat, A., Petitjean-Freytet, C., Clair, G., and Lamaison, J. L. (1992). The aromatic and polyphenolic composition of peppermint (Mentha x piperita L.) tea. Ann. Pharm. Fr., 50, 146-155.
- Etter, S. C. (2004). Rosmarinus officinalis as an antioxidant. J. Herbs, Spices., Med. Plants., 11, 121-159.
- Farhoudi, M., Ghodratizadeh, S., and Ghodratizadeh, S. (2011). Effects of Salvia officinalis extract on carbon tetrachloride induced hepatotoxicity. Global Veterinaria, 7, 353-357.
- Fecka, I. and Turek, S. (2007). Determination of water-soluble polyphenolic compounds in commercial herbal teas from Lamiaceae: peppermint, melissa, and sage. J. Agric. Food Chem., 55, 10908-10917.
- Fiander, H. and Schneider, H. (2000). Dietary ortho phenols that induce glutathione S-transferase and increase the resistance of cells to hydrogen peroxide are potential cancer chemopreventives that act by two mechanisms: the alleviation of oxidative stress and the detoxification of mutagenic xenobiotics. Cancer Lett., 156, 117-124.
- Guédon, D, J. and Pasquier, B. P. (1994). Analysis and distribution of flavonoid glycosides and rosmarinic acid in 40 Mentha x piperita clones. J. Agric. Food Chem., 42, 679-684.
- Gutiérrez, R., Alvarado, J. L., Presno, M., Pérez-Veyna, O., Serrano, C. J., and Yahuaca, P. (2010). Oxidative stress modulation by Rosmarinus officinalis in CCl4-induced liver cirrhosis. Phytother. Res., 24, 595-601.
- Habig, W. H., Pabst, M. J., and Jakoby, W. B. (1974). Glutathione S-transferases: the first enzymatic step in mercapturic acid formation. J. Biol. Chem., 249, 7130-7139.
- Haliwell, B., Gutteridge, J. M. C., and Cross, C. E. (1992). Free radicals, antioxidants, and human disease: where are we now? J. Lab. Clin. Med., 119, 598-620.
- Huang, D., Ou, B., Hampsch-Woodill, M., Flanagan, J. A., and Deemer, E. K. (2002). Development and validation of oxygen radical absorbance capacity assay for lipophilic antioxidants using randomly methylated β-cyclodextrin as the solubility enhancer. J. Agric. Food Chem., 50, 1815-1821.
- Huang, D., Ou, B., and Prior, R. L. (2005). The chemistry behind antioxidant capacity assays. J. Agric. Food Chem., 53, 1841-1856.
- Kähkönen, M. P., Hopia A. I., Vuorela, H. J., Rauha, J.-P., Pihlaja, K., Kujala, T. S., and Heinonen M. (1999). Antioxidant activity of plant extracts containing phenolic compounds. J. Agric. Food Chem., 47, 3954-3962.
- Koh, Y. H., Yoon, S. J., and Park, J.-W. (1999). Inactivation of copper, zinc, superoxide dismutase by the lipid peroxidation products malondialdehyde and 4-hydroxynonenal. J. Biochem. Mol. Biol., 32, 440-444.
- Koşar, M., Dorman, H. J. D., Başer, K. H. C., and Hiltunen, R. (2004). Screening of free radical scavenging compounds in water extracts of Mentha samples using a postcolumn derivatization method. J. Agric. Food Chem., 52, 5004-5010.
- Lee, E., Miki, Y., Furukawa, Y., Simizu, H., and Kariya, K. (1991). Seelective release of glutathione transferase subunits from primary cultured rat hepatocytes by carbon tetrachloride and deoxycholic acid. Toxicology, 67, 237-248.
- Lee, M. H. and Park, J.-W. (1995). Lipid peroxidation products mediate damage of superoxide dismutase. Biochem. Mol. Biol. Int., 35, 1093-1102.
- Lesschaeve, I. and Noble, A. C. (2005). Polyphenols: factors influencing their sensory properties and their effects on food and beverage preferences. Am. J. Clin. Nutr., 81 (suppl), 330S-335S.
- Li, G.-S., Jiang, W.-L., Tian, J.-W., Qu, G.-W., Zhu, H.-B., and Fu, F.-H. (2010). In vitro and in vivo antifibrotic effects of rosmarinic acid on experimental liver fibrosis. Phytomedicine, 17, 282-288.
- Masuda, T. (2006). Learning toxicology from carbon tetrachloride-induced hepatotoxicity. Yakugaku Zasshi, 126, 885-899.
- McCay, P. B., Lai, E. K., Poyer, J. E., DuBose, C. M., and Janzen, E. G. (1984). Oxygen- and carbon-centered free radical formation during carbon tetrachloride metabolism. J. Biol. Chem., 259 2135-2143.
- Minato, K., Miyake, Y., Fukumoto, S., Yamamoto, K., Kato, Y., Shimomura, Y., and Osawa, T. (2003). Lemon flavonoid, eriocitrin, suppresses exercise-induced oxidative damage in rat liver. Life Sci., 72, 1609-1616.
- Miyake, Y, Mochizuki, M., Okada, M., Hiramitsu, M., Morimitsu, Y., and Osawa, T. (2007). Isolation of antioxidative phenolic glucosides from lemon juice and their suppressive effect on the expression of blood adhesion molecules. Biosci. Biotechnol. Biochem., 71, 1911-1919.
- Miyake, Y, Shimoi, K., Kumazawa, S., Yamamoto, K., Kinae, N., and Osawa, T. (2000). Identification and antioxidant activity of flavonoid metabolites in plasma and urine of eriocitrin-treated rats. J. Agric. Food Chem., 48, 3217-3224.
- Miyake, Y, Yamamoto, K., Morimitsu, Y., and Osawa, T. (1997). Isolation of C-glucosylflavone from lemon peel and antioxidative activity of flavonoid compounds in lemon fruit. J. Agric. Food Chem., 45, 4619-4623.
- Miyake, Y, Yamamoto, K., Morimitsu, Y., and Osawa, T. (1998). Characteristics of antioxidative flavonoid glycosides in lemon fruit. Food Sci. Technol. Int. Tokyo, 4, 48-53.
- Nagase, S. and Tanaka, T. (1980). In “Clinico Biochemical Values of Experimental Animal” Softscience Co., Ltd., Tokyo, Japan, pp. 220-231 (in Japanese).
- Ninfali, P., Mea, G., Giorgini, S., Rocchi, M., and Bacchiocca, M. (2005). Antioxidant capacity of vegetables, spices and dressings relevant to nutrition. Brit. J. Nutr. 93, 257-266.
- Ou, B., Hampsch-Woodill, M., and Prior, R. L. (2001). Development and validation of an improved oxygen radical absorbance capacity assay using fluorescein as the fluorescent probe. J. Agric. Food Chem., 49, 4619-4626.
- Park, C. M., Cha, Y. S., Youn, H. J., Cho, C, W., and Song, Y. S. (2010). Amelioration of oxidative stress by dandelion extract through CYP2E1 suppression against acute liver injury induced by carbon tetrachloride in Sprague-Dawley rats. Phytother. Res., 24, 1347-1353.
- Parry, J., Hao, Z., Luther, M., Su, L., Zhou, K., and Yu, L. (L.). (2006). Characterization of cold-pressed onion, parsley, cardamom, mullein, roasted pumpkin, and milk thistle seed oils. JAOCS, 83, 847-854.
- Plaa, G. L. (2000). Chlorinated methanes and liver injury: highlights of the past 50 years. Annu. Rev. Pharmacol. Toxicol., 40, 43-65.
- Prior, R. L., Hoang, H., Gu, L., Wu, X., Bacchiocca, M., Howard, L., Hampsch-Woodil, M., Huang, D., Ou, B., and Jacob, R. (2003). Assays for hydrophilic and lipophilic antioxidant capacity (oxygen radical absorbance capacity (ORACFL)) of plasma and other biological and food samples. J Agric Food Chem., 51, 3273-3279.
- Prior, R. L., Wu, X., and Schaich, K. (2005). Standard methods for the determination of antioxidant capacity and phenolics in foods and dietary supplements. J. Agric. Food Chem., 53, 4290-4302.
- Recknagel, R. O., Glende, E. A., Dolak, Jr, J. A., and Waller, R. L. (1989). Mechanisms of carbon tetrachloride toxicity. Pharmac. Ther., 43, 139-154.
- Reth, M. (2007). Antioxidant defences: endogeneous and diet derived. In “Free Radicals in Biology and Medicine, 4th edition” ed. by Halliwell, B. and Gutteridge, J. M. C., Oxford University Press Inc., New York, USA, pp. 79-186.
- Salles, C. (2006). Odour-taste interactions in flavour perception, In “Flavour in Food” ed. by Voilley, A. and Etievant, P., Woodhead Publishing Limited, Sawston Cambridge, UK, pp. 345-368.
- Sallie, R., Tredger, J. M., and Williams, R. (1991). Drug and the liver part 1: testing liver function. Biopharm. Drug Dispos., 12, 251-259.
- Schatz, G. (2007). Reactive species and disease: fact, fiction or filibuster? In “Free Radicals in Biology and Medicine, 4th edition” ed. by Halliwell, B. and Gutteridge, J. M. C., Oxford University Press Inc., New York, USA, pp. 488-613.
- Shahidi, F. (2000). Antioxidants in food and food antioxidants. Nahrung, 44, 158-163.
- Shan, B., Cai, Y. Z., Sun, M., and Corke, H. (2005). Antioxidant capacity of 26 spice extracts and characterization of their phenolic constituents. J. Agric. Food Chem., 53, 7749-7759.
- Sheweita, S. A., Abd EI-Gabar, M., and Bastawy, M. (2001). Carbon tetrachloride-induced changes in the activity of phase II drug-metabolizing enzyme in the liver of male rats: role of antioxidants. Toxicology, 165, 217-224.
- Singh, N., Kamath, V., Narasimhamurthy, K., and Rajini, P. S. (2008). Protective effect of potato peel extract against carbon tetrachloride-induced liver injury. Environ. Toxicol. Pharmacol., 26, 241-246.
- Singletary, K. W. (1996). Rosemary extract and carnosol stimulate rat liver glutathione-S-transferase and quinone reductase activities. Cancer Lett., 100, 139-144.
- Soares, S., Kohl, S., Thalmann, S., Mateus, N., Meyerhof, W., and Freitas, V. D. (2013). Different phenolic compounds activate distinct human bitter taste receptors. J. Agric. Food Chem., 61, 1525-1533.
- Sotelo-Félix, J. I., Martinez-Fong, D., Muriel, P., Santillán, R. L., Castillo, D., and Yahuaca, P. (2002). Evaluation of the effectiveness of Rosmarinus officinalis (Lamiaceae) in the alleviation of carbon tetrachloride-induced acute hepatotoxicity in the rat. J. Ethnopharmacol., 81, 145-154.
- Srivastava, A. and Shivanandappa, T. (2010). Hepatoprotective effect of the root extract of Decalepis hamiltonii against carbon tetrachlroride-induced oxidative stress in rats. Food Chem., 118, 411-417.
- Sroka, Z., Fecka, I., and Cisowski, W. (2005). Antiradical and anti-H2O2 properties of polyphenolic compounds from an aqueous peppermint extract. Z. Naturforsch., 60c, 826-832.
- Torras-Claveria, L., Jauregui, O., Bastida, J., Codina, C., and Viladomat, F. (2007). Antioxidant activity and phenolic composition of lavandin (Lavandula x intermedia Emeric ex Loiseleur) waste. J. Agric. Food Chem., 55, 8436-8443.
- Uchiyama, M. and Mihara, M. (1978). Determination of malonaldehyde precursor in tissues by thiobarbituric acid test. Anal. Biochem., 86, 271-278.
- Weber, L. W. D., Boll, M., and Stampfl, A. (2003). Hepatotoxicity and mechanism of action of haloalkanes: carbon tetrachloride as a toxicological model. Crit. Rev. Toxicol., 33, 105-136.
- Wu, X., Beecher, G. R., Holden, J. M., Haytowitz, D. B., Gebhardt, S. E., and Prior, R. L. (2004). Lipophilic and hydrophilic antioxidant capacities of common foods in the United States. J. Agric Food Chem., 52, 4026-4037.
- Yu, L (L.)., Parry, J. W., and Zhou, K. (2005). Oils from herb, spice, and fruit seeds. In “Bailey's Industrial Oil and Fat Products, 6th edition” ed. by Shahidi, F., John Wiley & Sons, Inc., Hoboken, NJ, USA, 3, pp. 233-258.
- Zheng, W. and Wang, S. Y. (2001). Antioxidant activity and phenolic compounds in selected herbs. J. Agric. Food Chem., 49, 5165-5170.