Abstract
Response surface methodology was used to optimize the microwave-assisted extraction process of phenolic compounds from Anli pear. Under the optimized conditions, antioxidant activities of phenolics from Anli pear were evaluated in vitro by scavenging capabilities of DPPH radical and the composition of phenolic compounds was performed by LC-MS. The optimal microwave-assisted extraction processing parameters were extraction time 124 s, microwave power 408 W, ethanol concentration 56% (v/v), and solvent/solid ratio 45:1, with an extraction yield of 9.801 mgGAE/gdm. The total phenolics have significant antioxidant activities, which can be used as a source of potential antioxidant. LC-MS analysis revealed that the phenolic compounds in the extract of Anli pear were mainly catechin, chlorogenic acid, quercetin glycosides, and isorhamnetin glycosides.
Introduction
Pears (Pyrus spp.) are one of the common and highly consumed fruits in the world, having been cultivated for more than 3000 years. There is a great diversity of pear varieties in China due to its widespread consumption. Only one ancient local variety in northeast China, named Anli pear (Pyrus ussuriensis Maxim)-a pear which mainly distributed in Yanshan area in Hebei province and the southern of northeast regions. This fruit is popular among consumers due to its unique flavor and resistant to storage and transportation. Furthermore, with the effects of antitussive, dissipating phlegm and diuretic activities, it has been commonly used as a traditional folk remedy in China for centuries. However, the bioactive components of Anli pear have not been investigated as more indepth as the similar fruits, such as Pyrus bretschneideri Rehd (other Pyrus cultivars) which has been reported to have good antioxidant (Ma et al., 2012) and anti-inflammatory effects (Huang et al., 2010). Moreover, previous studies reported the existence of various bioactive components in pear skins, pear flowers, and other parts of pear, such as phenolics (Salta et al., 2010; Oleszek et al., 1994), flavonoids (Rychlinska and Gudej, 2002), and triterpenes (Cho et al., 2013). In particular, various phenolic compounds including chlorogenic acid, arbutin and catechin have been found in pear fruits (Cui et al., 2005; Ferreira et al., 2002; Chen et al., 2007). Li and Zhang have identified the contents of total phenolics, total flavonoids, total anthocyanins, and triterpenes of eight known pear cultivars in China, and their antioxidant and anti-inflammatory activities were evaluated (Li et al., 2012). In addition, the phenolic acids, flavonoids, triterpenes contents in peel were approximately 6 – 20 times higher than those in the flesh of ten common pear fruits grown in China (Li et al., 2014). However, it is still remained unclear about the chemical contents and the biological activities of Anli pear.
In recent years, microwave assisted extraction (MAE) with the advantages of environment friendly, short extraction time, and high efficiency has been developed as alternatives to conventional methods, such as conventional solvent liquid extraction (CSE). Based on this advantage, it is already used for the extraction of active substances from plant materials, for example, polyphenols from Cherry laurel (Karabegovic et al., 2014), the leaves of Pistacia lentiscus leaves (Farid et al., 2014), and flavonoids from Perilla frutescens leaves (Shao et al., 2012). However, the extraction process is affected by several factors, including extraction time, microwave power, temperature, solvent concentration, and solvent to solid ratio (Fan et al., 2008). Thus, it is important to optimize the extraction conditions in order to maximize the extraction efficiency. Response surface methodology (RSM) is an effective statistical tool for evaluating independent variables and their interaction effects on response variables (Jiang et al., 2006). Moreover, it can optimize process and avoid the limitations. To the best of our knowledge, no publications on active substances extraction from Anli pear by MAE are reported until now. The extraction process parameters have not been systematically analysed as well. The aim of this study was to optimize the MAE conditions with RSM for the extraction of phenolic compounds from Anli pear, and evaluate antioxidant activity and further to analysis the composition of phenolic compounds in extract.
Materials and Methods
Chemical reagents Gallic acid, Folin-Ciocalteu reagents, 1,1-diphenyl-2-picryhydrazy (DPPH) and purchased from Sigma Chemicals Company (St. Louis, MO, USA). Formic acid and acetonitrile (mass spectrum grade) purchased from Thermo Fisher Scientific (Waltham, Massachusetts, USA). Sodium carbonate and ethanol were purchased from Tianjin Fengchuan Chemical Research Technologies Co., LTD (Tianjin, China). All the reagents were analytical grade.
Raw materials Anli pears (Pyrus ussuriensis Maxim) were obtained in the city of Qinglong, Hebei Province, China. The pears were washed firstly and then cores were peeled off manually. Samples were immediately frozen with liquid nitrogen to avoid the oxidation of the phenolic compounds (Guyot et al., 2001), and freeze-dried in a freeze dryer (Alphal-2, Martin Christ Co, Germany) until all moisture was removed (4.7% moisture content on a dry basis). The freeze-dried material was ground to a powder form and screened through 40 size mesh. Powder was stored at −20°C until use.
Microwave-assisted extraction process An experimental microwave equipment (1,800 W, Model LS-800, Lanmai Co., Ltd., China) with 2450 MHz working frequency was used for MAE experiments. The apparatus was equipped with a digital control system for controlling microwave power and time and monitoring temperature. The microwave power was linearly adjust from 0 to 1800 W. For extraction, powder of Anli pear (1 g) was placed in erlenmeyer flask of 100 mL with different ethanol concentrations and different MAE conditions. After extraction, the mixture was filtered using No. 1 filter paper under vacuum and collected in a volumetric flask for analysis.
Soxhlet extraction process Five gram of a precisely weighed sample were parceled with filter paper and placed in a Soxhlet apparatus with 150 mL ethanol. Then it performed at 70°C for about 4 h. After extraction, the extract was filtered through No. 1 filter paper under vacuum. The solution was collected in a volumetric flask for analysis.
Determination of total phenolics content The total phenolics content (TPC) was measured by Folin Denis Method as described by Singleton and Rossi (Singleton and Rossi, 1965) with slightly modifications. Briefly, 0.1 mL of the extract was topped up to 5 mL with distilled water in a 10-mL volumetric flask, followed by 0.5 mL of Folin-Ciocalteu reagent (0.2 mol/L). About 1 mL of sodium carbonate solution (7.5 g/100 mL) was added into the mixture after 5 min. The mixture was topped up to 10 mL with water and incubated at room temperature for 1 h. Then the light absorbance of the mixture was measured by 722S-visible spectrophotometer (Shanghai Optical Instrument Co., Ltd. China) at 725 nm against a reagent blank. TPC was calculated by the standard curve of gallic acid (GA) and expressed as milligram gallic acid equivalents (GAE)/g of dry material (dm).
DPPH assay The DPPH radical scavenging test activity was determined according to Armata et al (Armata et al., 2008). Briefly, 2 mL of various dilutions of the pear extract was mixed with 2 mL of 0.2 mmol/L ethanolic solution of DPPH. The mixture was deposited in the dark at room temperature for 30 min against a blank. And the decrease of absorbance at 515 nm was measured. The scavenging ability (I%) was calculated as follows:
where
AS,
A0,
A is the absorbance of sample with DPPH, blank sample (without DPPH), and DPPH (without sample), respectively. Every sample was tested in triplicate.
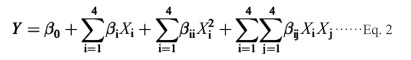
Experimental design for optimization For studied the influences of irradiation time, microwave power, ethanol concentration, and solvent/solid ratio, each of the process parameters was firstly separately investigated in single-factor experiments. On the basis of the single-factor experimental results, major influence factors were selected. Then, a four-variable and three-level Box-Behnken design (BBD) was performed to explore the effect of variables on the responses. The range and levels of independent variables were coded as −1, 0 and +1 according to the method described by Prakash et al. (Prakash et al., 2013). Those variables were X1 (time, s), X2 (power, W), X3 (ethanol concentration, %(v/v)), X4 (solvent/solid ratio, mL/g), and the response was total phenolic content (TPC). Twenty-nine experiments were conducted with five replications of the center points to evaluate the pure error sum of squares. Regression analysis of the data to fit a second-order model was shown as below in Ep. 2:
Where Y is the predicted response, β0 is the intercept, βi, βii, and βij are the linear, quadratic, and interactive coefficients, respectively; Xi and Xj are the levels of the independent variables.
The Design Expert 8.0.6 trial software (Stat-Ease Inc., Minneapolis, MN, USA) was used to analyze the experimental data, for an analysis of variance (ANOVA) and regression coefficient calculations. Moreover, the three dimensional response surfaces and contour plots were generated so as to visualize the relationship between the response and experimental levels of each factor.
LC-MS analysis for extract Dionex UltiMate 3000 LC was used for separation on a Thermo Scientific Hypersil GOLD C18 column (100 × 2.1 mm, 1.9 µm). The sample injection volume was 2 µL, and the column temperature was 30°C. A gradient elution mode was employed with the eluents of 0.1% formic acid deionized water mixture (A) and acetonitrile (B). The elution program was set as follows: 0 – 35 min with B of 5 – 95%; 35 – 40 with B of 95 − 5%; 40 – 50 min with B of 5%, at a flow rate of 0.30 mL/min. As to LC-MSn analysis, mass spectrometry (Thermo Fisher, LTQ Orbitrap, USA) via ESI interface was used. Ultrahigh pure helium (He, 99.999%) was used as the collision gas, and high purity nitrogen (N2, 99.999%) as the nebulizing gas. ESI was operated in negative mode.
Results and Discussion
Effect of process variables on the extraction of TPC The effects of different process variables on the extraction of TPC from Anli pear were studied using single factor experiments, and the results were shown in Fig. 1 (A–D).
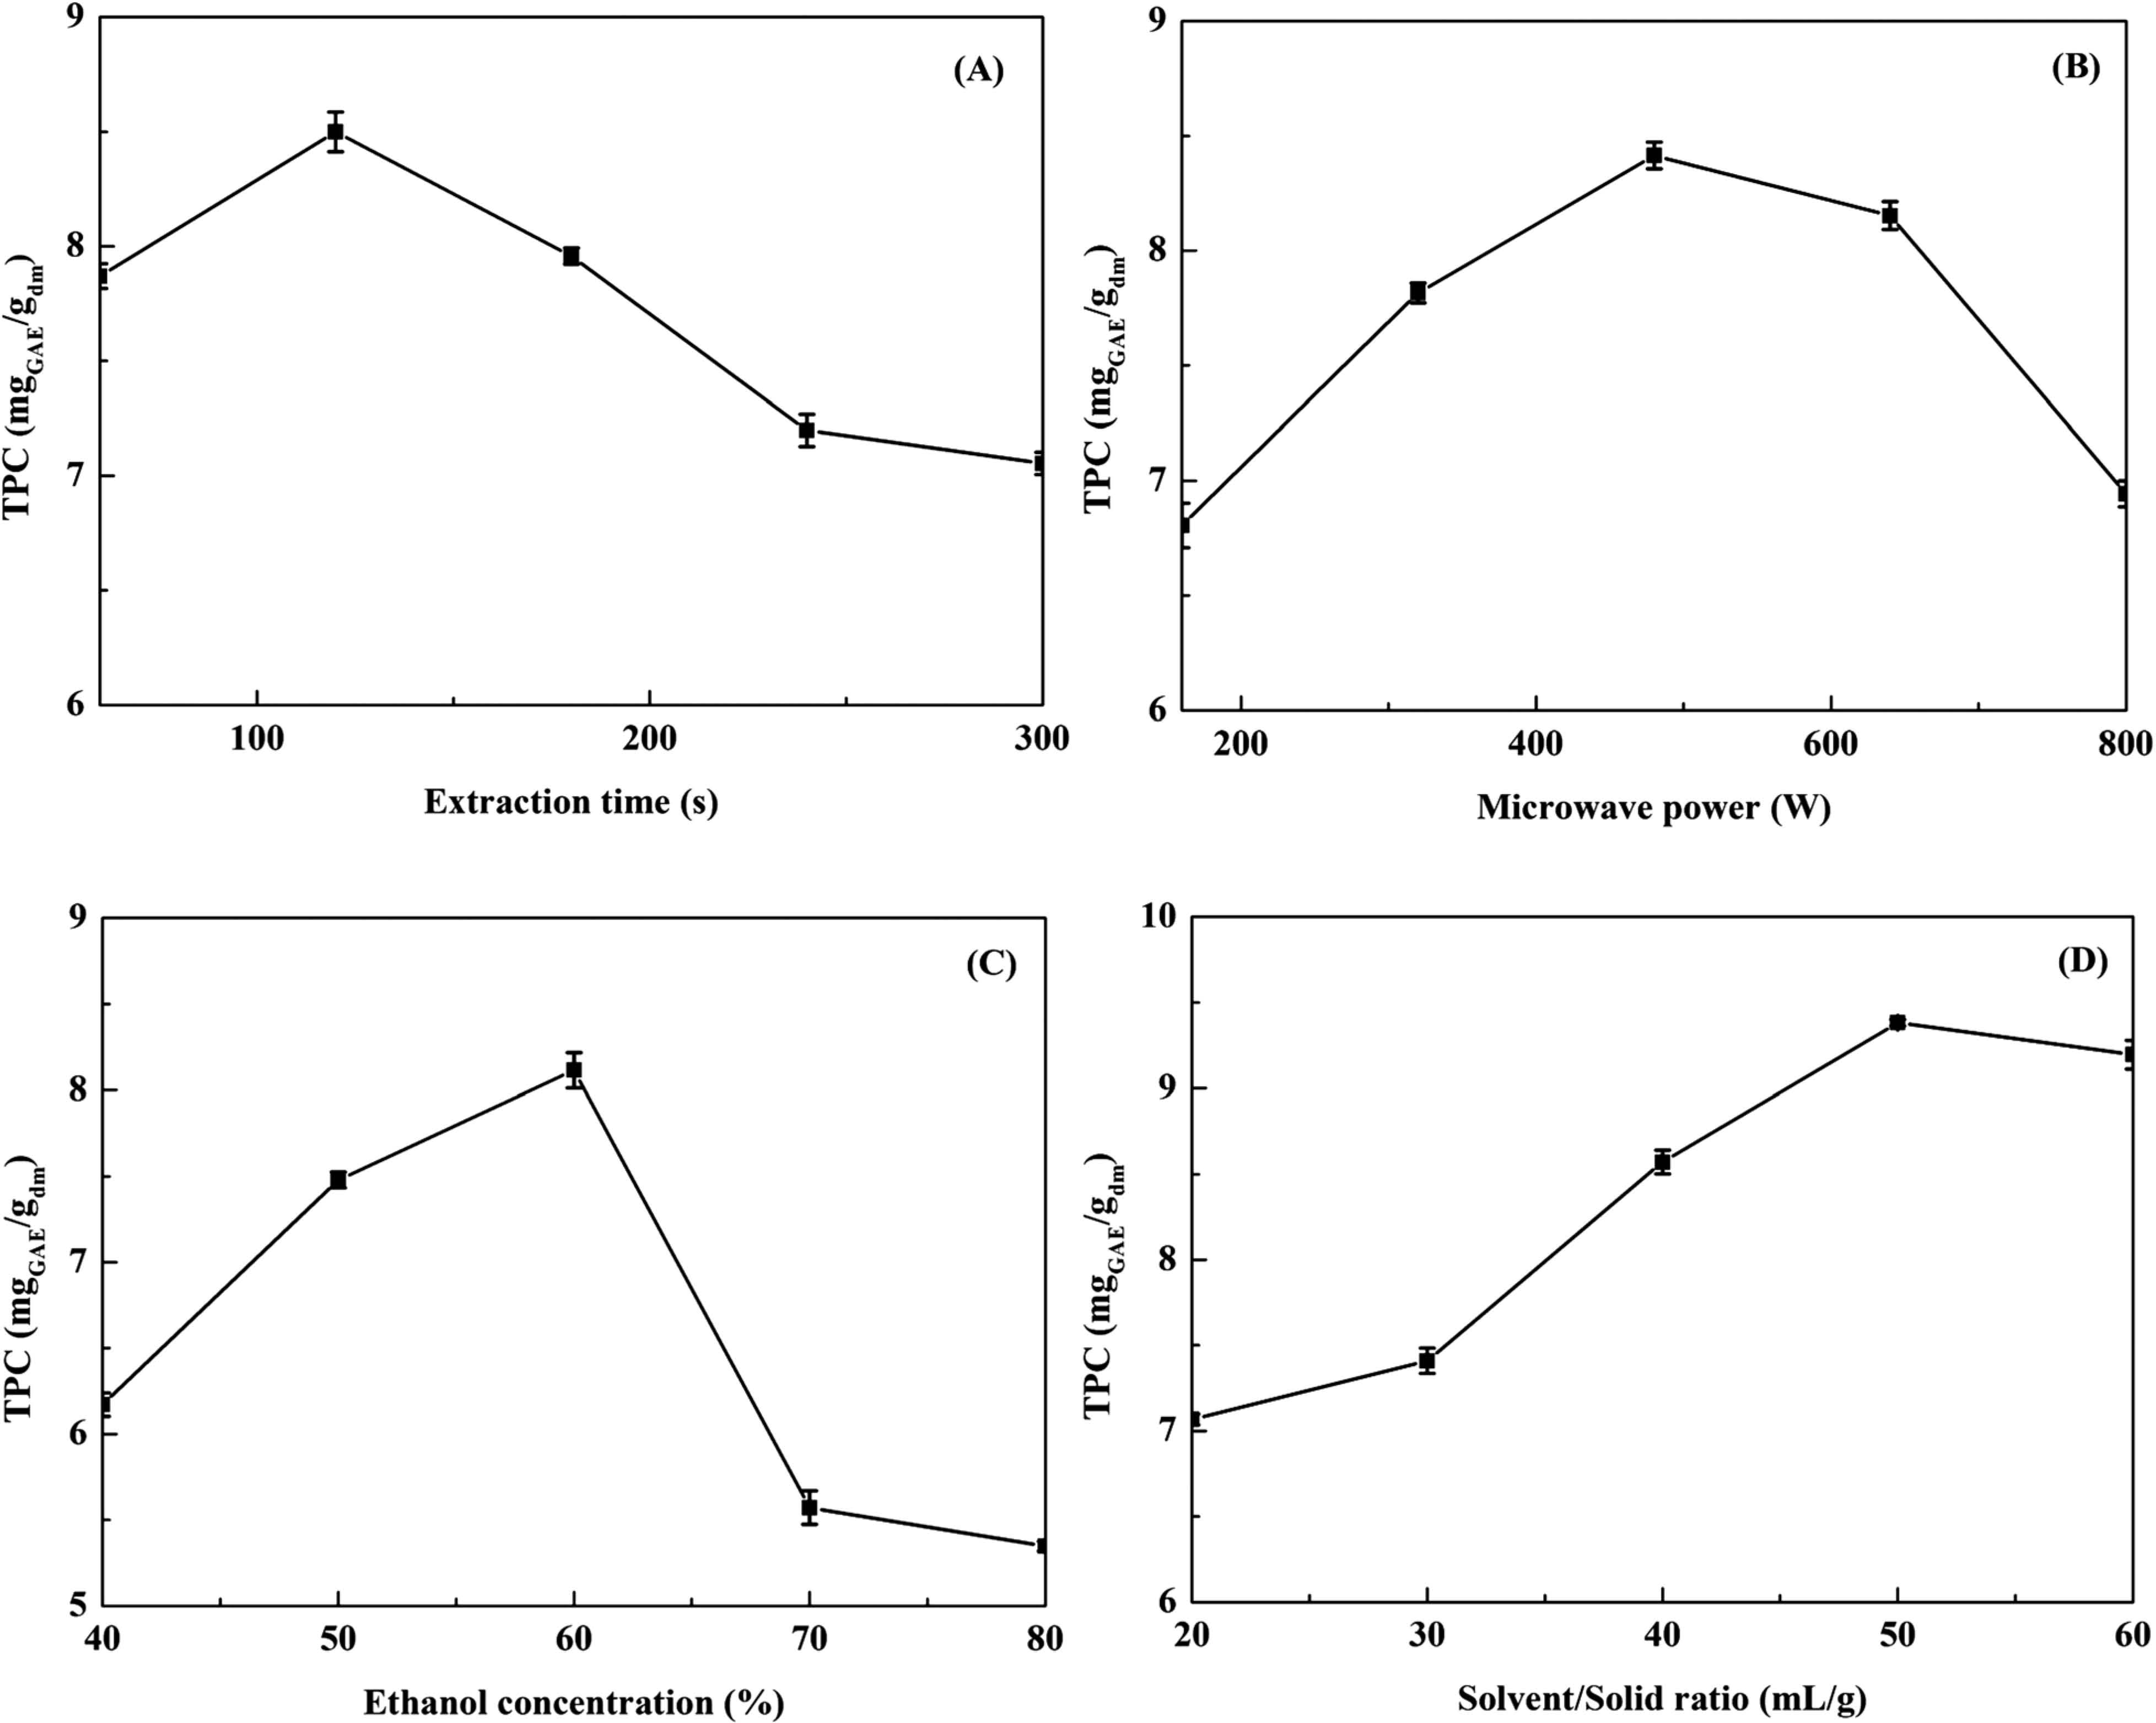
The impact of extraction time on the TPC was investigated at solvent/solid ratio 50:1 mL/g, ethanol concentration 60% (v/v) and microwave power 640 W. As described in Fig. 1A, the TPC increased from 60 to 120 s to be followed by a significant decrease after 3min. During the period of 0 – 120s, the TPC increased with the extension of extraction time. Because of the time extension, the powder particle fully contacts with the water and the dissolution rate of polyphenols also increased. With the extraction time lengthened enough, the solution of polyphenols reached the equilibrium state, and the polyphenols couldn't be dissolved in the solution any more. In addition, over exposure to microwave may lead to thermal degradation of polyphenol constituents (Hao et al., 2002). Thus when the extraction time lengthened more than 120 s, the TPC decreased. Since shorter extraction time is also favourable to reduce energy costs, the 60 – 180 s range was selected for the RSM trials.
The effect of microwave power on the FER was shown in Fig. 1B. The range 120 – 800 W was selected for the RSM study, while other extraction parameters were constant (50% ethanol, 50:1 solvent/solid ratio and 120 s extraction time). It was clear that when the power increased from 160 to 480 W, a substantial increase in the TPC was observed and then it slightly decreased for higher powers (from 640 to 800 W). The highest TPC (8.4 mgGAE/gdm) was attained at a microwave power of 480 W. It must be underlined that more electromagnetic energy was transferred to the extraction system quickly and increased the diffusion coefficient between solid and solvent when the microwave power increased from 160 to 640 W. However, with increasing microwave power, the temperature of the extraction medium increased also (Xiao et al., 2008). Meanwhile, the heat-sensitive phenolic compounds may be degraded at higher temperature. The range 320 – 640 W was selected for the RSM study.
Ethanol, a green solvent with low toxicity and cheap price, is now widely used for the extraction of active compounds from various natural materials. Ethanol concentration is another factor that will influence the extraction efficiency. As show in Fig. 1C, TPC increased with the ethanol concentration from 40 to 60% (v/v), and reached an apex of 8.1 mgGAE/gdm at 60% (v/v). Thereafter, TPC diminished as represented by the sharp decline. A similar effect was reported for the extraction of phenolic compounds from other plant sources (Spigno et al., 2007; Li et al., 2012). Possible reason could be the solvent polarity and molecular movement declined with the increasing of ethanol concentration, which led to dissolution of phenolic compounds for the lowering of diffusion coefficient and the decrease of solubility (Yang et al., 2009). Based on these results, the concentration range 50 – 70% (v/v) was selected and 60% (v/v) was used as the center point for the RSM experiment.
The solvent/solid ratio had a significant effect on TPC (Fig. 1D). The extraction yield was increased quickly when this ratio increased from 20:1 to 50:1 but subsequently decreased with higher solvent/solid ratio. Results indicated that the TPC reached the maximum value at solvent/solid ratio (mL/g) 50:1, due to the increase of the driving force for the mass transfer of the TPC (Bendahou et al, 2007). However, when the solvent/solid ratio continued to increase, the TPC no longer significantly changed. Therefore, we chose a solvent/solid ratio of 50:1 as the center point for the RSM experiment.
Optimization of process variables On the basis of the single factor experiments, four process variables including extraction time 60 – 180 s, microwave power 320 – 640 W, ethanol concentration 50 – 70% (v/v), and solvent/solid ratio 40 – 60 mL/g were determined as the main effective variables in the MAE process. The experimental and predicted values of TPC recovery obtained in the BBD experiments are presented in Table 1. The coefficients of the independent variables were fitted with the following second-order polynomial stepwise equation (in term of coded factors):
Table 1.
Box-Behnken design of the independent variables and results of experimental and predicted response values
| Run |
X1 |
X2 |
X3 |
X4 |
Response |
| time (s) |
power (W) |
ethanol concentration (%,v/v) |
solvent/solid ratio (mL/g) |
TPCexp (mgGAE/gdm) |
TPCpre (mgGAE/gdm) |
| 1 |
180(1) |
480(0) |
70(1) |
50(0) |
3.94 |
3.81 |
| 2 |
180(1) |
480(0) |
60(0) |
40(−1) |
5.82 |
6.28 |
| 3 |
180(1) |
320(−1) |
60(0) |
50(0) |
8.21 |
7.41 |
| 4 |
120(0) |
320(−1) |
70(1) |
50(0) |
4.44 |
4.38 |
| 5 |
120(0) |
480(0) |
60(0) |
50(0) |
9.36 |
9.35 |
| 6 |
180(1) |
640(1) |
60(0) |
50(0) |
6.87 |
6.27 |
| 7 |
60(−1) |
480(0) |
70(1) |
50(0) |
6.54 |
5.91 |
| 8 |
120(0) |
320(−1) |
50(−1) |
50(0) |
7.46 |
7.08 |
| 9 |
60(−1) |
640(1) |
60(0) |
50(0) |
5.32 |
6.05 |
| 10 |
60(−1) |
320(−1) |
60(0) |
50(0) |
5.96 |
6.48 |
| 11 |
120(0) |
480(0) |
60(0) |
50(0) |
9.31 |
9.35 |
| 12 |
120(0) |
320(−1) |
60(0) |
60(1) |
4.49 |
4.78 |
| 13 |
60(−1) |
480(0) |
60(0) |
40(−1) |
8.54 |
8.17 |
| 14 |
120(0) |
640(1) |
60(0) |
60(1) |
6.92 |
6.70 |
| 15 |
120(0) |
640(1) |
70(1) |
50(0) |
4.59 |
4.84 |
| 16 |
120(0) |
480(0) |
50(−1) |
60(1) |
4.36 |
4.19 |
| 17 |
120(0) |
320(−1) |
60(0) |
40(−1) |
8.29 |
8.72 |
| 18 |
120(0) |
480(0) |
60(0) |
50(0) |
9.36 |
9.35 |
| 19 |
120(0) |
480(0) |
60(0) |
50(0) |
9.29 |
9.35 |
| 20 |
180(1) |
480(0) |
50(−1) |
50(0) |
7.11 |
7.94 |
| 21 |
180(1) |
480(0) |
60(0) |
60(1) |
7.28 |
7.51 |
| 22 |
120(0) |
480(0) |
50(−1) |
40(−1) |
8.59 |
8.05 |
| 23 |
120(0) |
480(0) |
60(0) |
50(0) |
9.45 |
9.35 |
| 24 |
60(−1) |
480(0) |
50(−1) |
50(0) |
4.36 |
4.69 |
| 25 |
120(0) |
480(0) |
70(1) |
60(1) |
4.89 |
5.36 |
| 26 |
60(−1) |
480(0) |
60(0) |
60(1) |
5.07 |
4.47 |
| 27 |
120(0) |
480(0) |
70(1) |
40(−1) |
3.88 |
3.97 |
| 28 |
120(0) |
640(1) |
60(0) |
40(−1) |
5.31 |
5.23 |
| 29 |
120(0) |
640(1) |
50(−1) |
50(0) |
5.13 |
5.05 |
In order to determine whether the quadratic model is significant, it is necessary to conduct ANOVA analysis. The ANOVA for the experimental results of the BBD is shown in Table 2. The values of “Prob > F ” less than 0.0001 implies the model is significant. In this case X1, X2, X3, X4, X1 X3, X1 X4, X2 X4, X3 X4, X12, X22, X32, X42 are significant model terms. The coefficient of determination (R2) of the model is 0.9522, indicating that most of the variations are explained by the model. Moreover, the Pred-R2 of 0.7253 is in reasonable agreement with the Adj-R2 of 0.9044 indicates that the accuracy and general availability of the polynomial model is adequate. The Lack of Fit F-value of 127.06 implies the Lack of Fit is significant. There is only a 0.01% chance that a Lack of Fit F-value this large could occur due to noise. An adequate precision is a measure of the signal to noise ratio, which greater than 4 is considered to be desirable (Canettieri et al., 2013). In our model, the value of Adeq Precision is 13.048, demonstrating an adequate signal. At the same time, a relatively low value of the coefficient of variation (C.V.% = 9.01) indicates that the model is reproducible (Zhang et al., 2009). Therefore, the obtained model is adequate for prediction in the range of experimental variables.
Table 2
The analysis of variance (ANOVA) of the independent variables for the quadratic polynomial model
| Source model |
Sum of squares |
Degree of freedom |
Mean square |
F-value |
p-value |
Significance |
| Model |
97.23 |
14 |
6.94 |
19.92 |
< 0.0001 |
** |
| X1-time |
0.99 |
1 |
0.99 |
2.83 |
0.1148 |
|
| X2-power |
1.85 |
1 |
1.85 |
5.30 |
0.0372 |
* |
| X3-concentration |
6.35 |
1 |
6.35 |
18.21 |
0.0008 |
** |
| X4-ratio |
4.59 |
1 |
4.59 |
13.16 |
0.0027 |
** |
| X1X2 |
0.12 |
1 |
0.12 |
0.35 |
0.5628 |
|
| X1X3 |
7.16 |
1 |
7.16 |
20.52 |
0.0005 |
** |
| X1X4 |
6.08 |
1 |
6.08 |
17.43 |
0.0009 |
** |
| X2X3 |
1.54 |
1 |
1.54 |
4.41 |
0.0543 |
|
| X2X4 |
7.32 |
1 |
7.32 |
20.98 |
0.0004 |
** |
| X3X4 |
6.86 |
1 |
6.86 |
19.69 |
0.0006 |
** |
| X12 |
10.52 |
1 |
10.52 |
30.16 |
< 0.0001 |
** |
| X22 |
15.12 |
1 |
15.12 |
43.38 |
< 0.0001 |
** |
| X32 |
40.20 |
1 |
40.20 |
115.29 |
< 0.0001 |
** |
| X42 |
14.03 |
1 |
14.03 |
40.24 |
< 0.0001 |
** |
| Residual |
4.88 |
14 |
0.35 |
|
|
|
| Lack of fit |
4.87 |
10 |
0.49 |
127.06 |
0.0001 |
** |
| Pure error |
0.015 |
4 |
0 |
|
|
|
| Cor total |
102.11 |
28 |
|
|
|
|
| R2 = 0.9522 |
0.9522 |
|
|
|
|
|
| Adj-R2 |
0.9044 |
|
|
|
|
|
| Pred-R2 |
0.7253 |
|
|
|
|
|
| C.V.% |
9.01 |
|
|
|
|
|
**
p < 0.01 highly significant;
* 0.01 <
p < 0.05 significant
The effects of each parameter on the yield within the experimental space under investigated can be visualized on the three dimensional response surface plots and two dimensions contour plots. The 3D response surface graphically revealed the sensitivity of the response value towards the change in the variable. And the 2D contour plot illustrated the significant coefficients between the different variables. The significance of the mutual interactions between the independent variables could be estimated from the shape of contour plots. An elliptical profile of the contour plot indicates remarkable interaction between the independent variables, while a circular contour plot means negligible interactions (Liu et al., 2013).
The response surface and contour plots for the TPC of Anli pear obtained by MAE are shown in Fig. 2. The response obtained were convex nature suggesting that there were well-defined optimum conditions. However, the convexity was not high enough and the surfaces were rather symmetrical, meaning that the optimized response value based on combined effects but not the single variable optimized conditions.

The plots in Fig. 2A and 2D showed similar relationships with respect to the effects of each variable. Both of the interaction effect of the extraction time with the power and power with ethanol concentration exhibit weak effects on the TPC. However, Fig. 2B reflects the good quadratic effect of the extraction time and ethanol concentration on TPC. Total phenolics content increased quickly with the decreasing in ethanol concentration, and then reached an apex when the ethanol concentration and irradiation time were 56% (v/v) and 124 s, respectively. TPC was not only inversely proportional to ethanol concentration but also to solvent/solid ratio. The obvious interaction effect of the extraction time and solvent/solid ratio is shown in Fig. 2C. Solvent/solid ratio had a strong effect on the TPC yield, and with a decreased solvent/solid ratio, the TPC yield increased and reached a peak at 44 mL/g. The effects of liquid to solid ratio interaction with each of the two other factors on the TPC were shown in Fig. 2E, 2F. It was obvious that the lower solvent volume resulted in higher yield, the TPC increased to a certain value with increasing solvent/solid ratio from 30:1 to 48:1, and thereafter kept stable. It indicated that the solvent to solid ratio has remarkable effect on the TPC.
In conclusion, the recovery of TPC mainly depends on the ethanol concentration and solvent/solid ratio as theirs quadratic and linear effects were highly significant (p < 0.01), confirming the single-factor experiment results.
According to the model (Eq. (3)), the optimal MAE conditions for the TPC yield were obtained: irradiation time 124.16 s, microwave power 407.78 W, ethanol concentration 56.34% (v/v), and S/S ratio 44.48 mL/g. Under optimal conditions, the model predicted a maximum response of 9.756 ± 0.750 mgGAE/gdm. To validate the practical results biased toward the predicted values or not, the optimized parameters with slightly modifications (X1 = 124 s, X2 = 408 W, X3 = 56%, and X4 = 45 mL/g) were tested in an additional experiment. The mean values of TPC was 9.746 mgGAE/gdm, it was not significantly different to from predicted value, that confirming the good feasibility of RSM in the optimization of extraction parameters of TPC.
Comparison of MAE with Soxhlet extraction The optimized MAE conditions were compared with one of the traditional extraction method named Soxhlet extraction. The TPC of the extracts obtained under optimal conditions of the MAE was 9.746 mgGAE/gdm and Soxhlet method was 9.853 mgGAE/gdm. Though the TPC was slightly lower than that of Soxhlet, MAE greatly shorten the extraction time and reduce the energy consumptions. Therefore, MAE could save a lot of time and bring higher TPC. It confirmed that MAE was more efficient and capable of extracting more TPC from Anli pear in a considerably shorter time period.
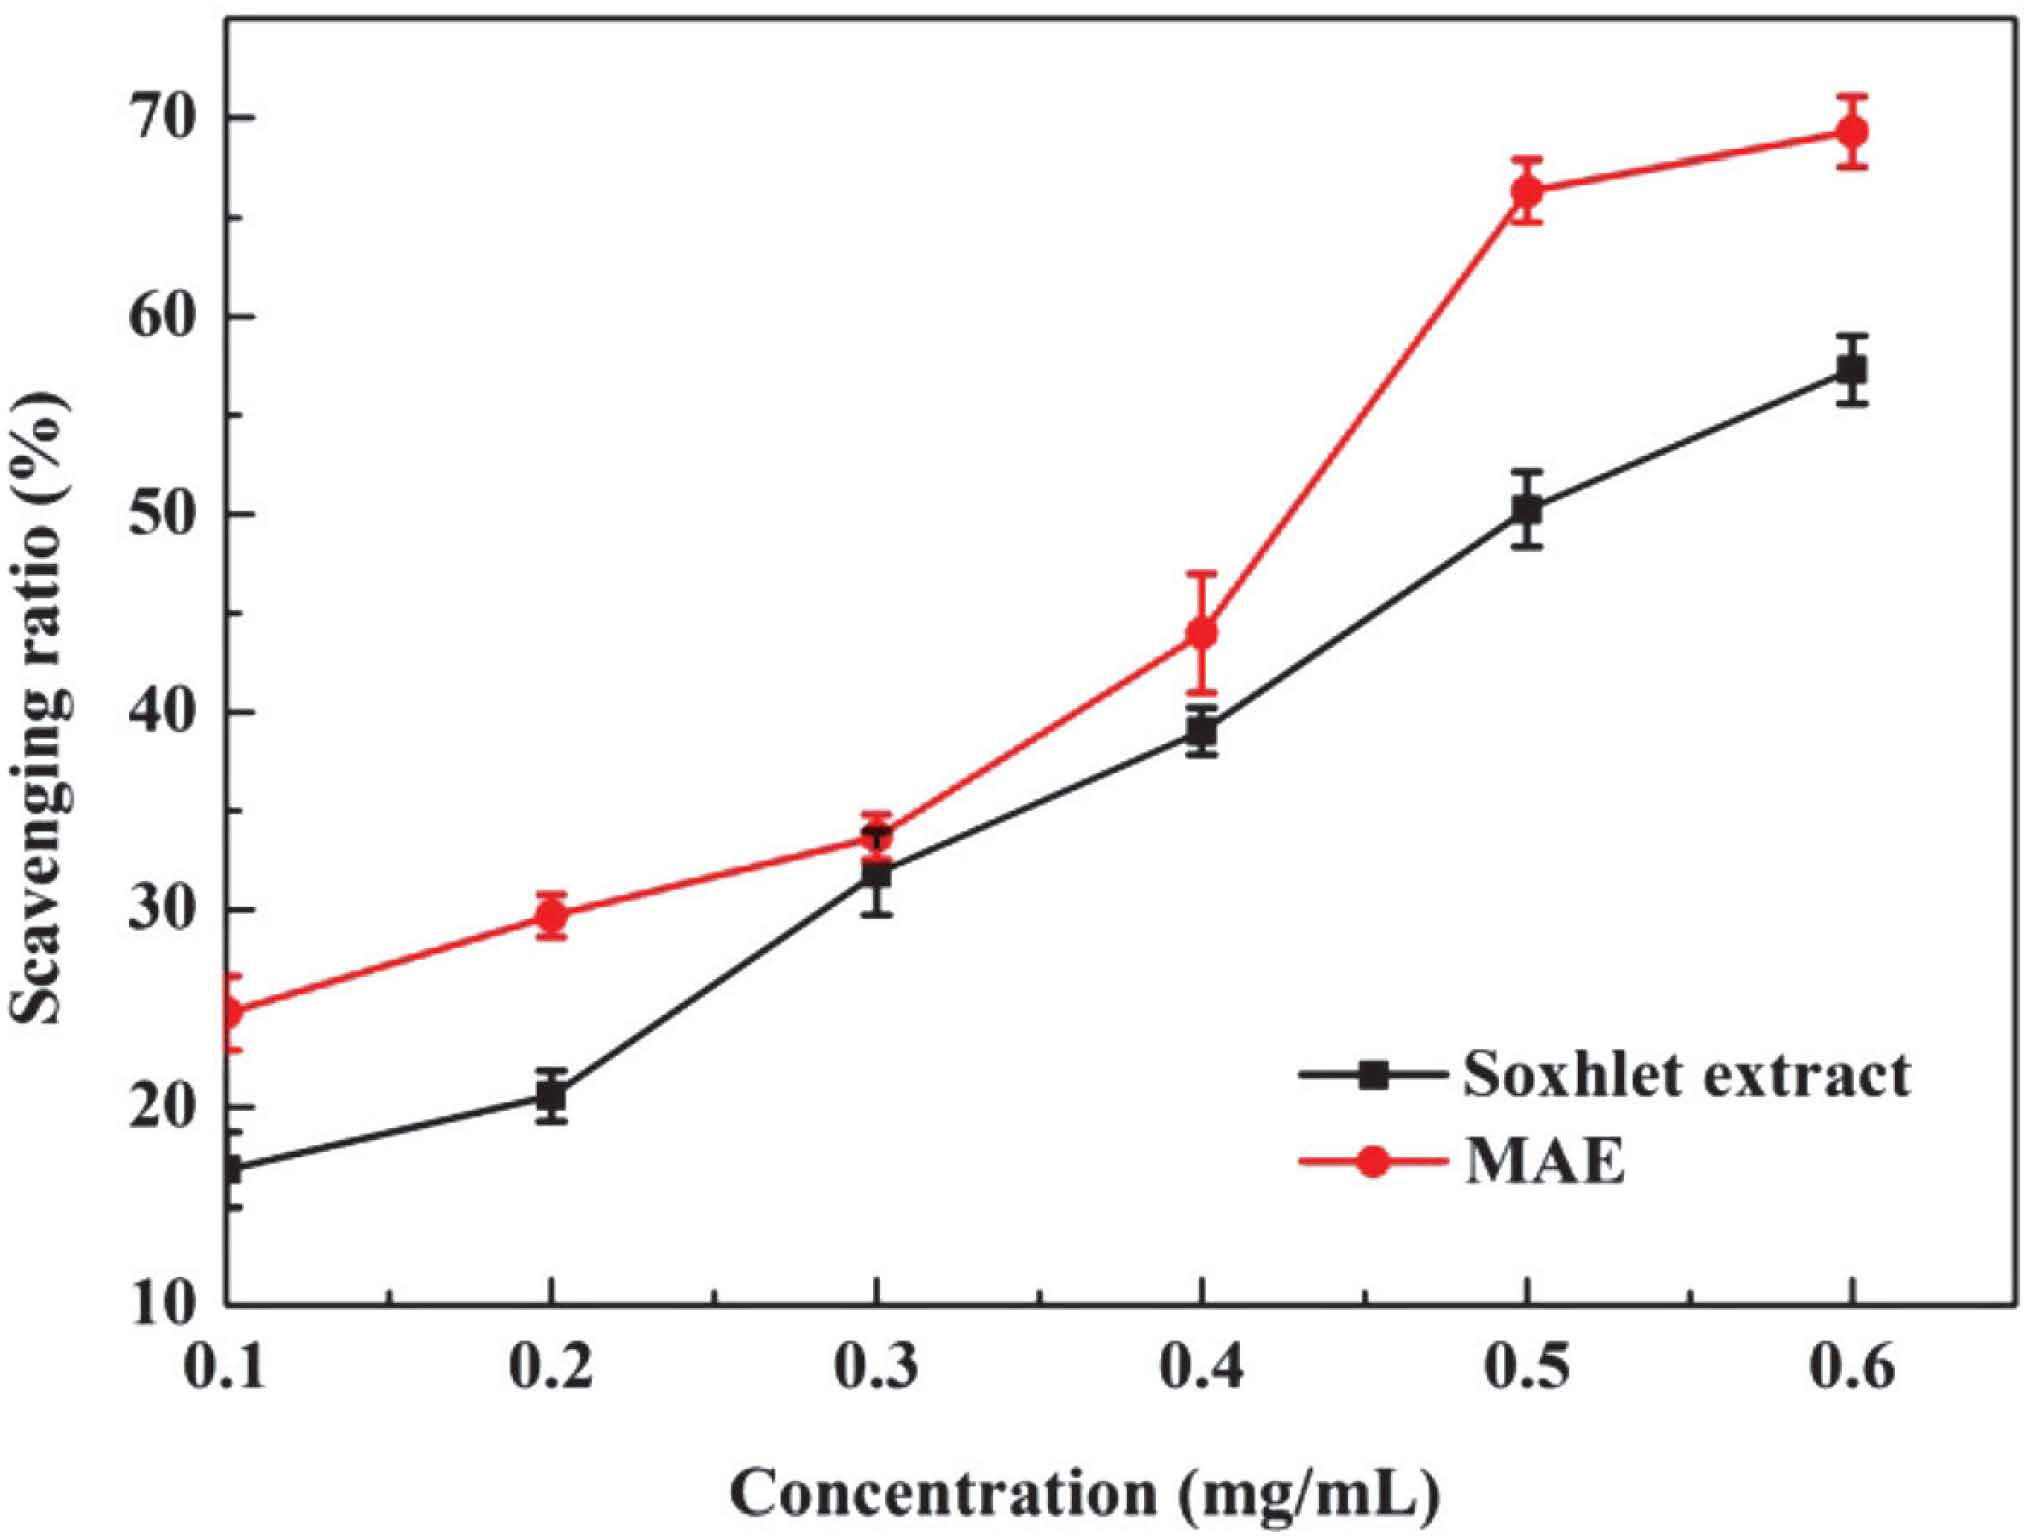
DPPH test is considered to be a useful and rapid method to evaluate the free radical scavenging activity of natural products (Nagai et al., 2003). DPPH is a compound with a characteristic absorption at 515 nm. However, with the addition of proton radical scavengers, the absorption at 515 nm decreases significantly. The scavenging activities for DPPH radical of phenolics obtained by MAE and Soxhlet extraction were shown in Fig. 3. Particularly, with the concentrations varied from 0.10 to 0.60 mg/mL, the scavenging ratio has a significant growth. The half maximal effective concentration (EC50) in DPPH assay were 0.42 mg/mL and 0.50 mg/mL for MAE and Soxhlet extraction, respectively, which indicated that the phenolics obtained with MAE had more effective scavenging activity than those of Soxhlet extraction. The lower activity of Soxhlet extract could be resulted from the longer extraction time and higher temperature. The results suggested that phenolic extract obtained with MAE have noticeable DPPH radical scavenging activity.
LC-MS analysis The composition of phenolic compounds in extract of Anli pear was preliminarily analyzed with LC-MS. It is not hard to get the relative molecular mass of the compound through pseudomolecular ion peaks of LC-MS analysis. At the same time, the fragmentation pathway of pseudomolecular ion was studied by ESI-MSn, which could reflect abundant information for compound structure. The results of mass spectrometry including retention time, molecular weight, and major fragment ions were listed in Table 3. It indicated that phenolic compounds in Anli pear were mainly catechin, chlorogenic acid, quercetin glycosides, and isorhamnetin glycosides. The results were consistent with those previous studies in other pears species (Lin and James, 2008).
Table 3.
Phenolic compounds identified by LC-MS in Anli pear extract
| No |
Rt (min) |
[M-H]− (m/z) |
Fragment (m/z) |
Compound |
| 1 |
1.69 |
191.06 |
85 |
Quinic acid |
| 2 |
2.10 |
271.08 |
109 |
Arbutin |
| 3 |
4.17 |
327.10 |
195,165 |
Paeonoside |
| 4 |
4.82 |
373.11 |
343,211,193 |
Swertiamarin |
| 5 |
6.47 |
353.09 |
191.06 |
Chlorogenic acid |
| 6 |
7.64 |
289.07 |
245,205,179 |
Catechin or epicatechin |
| 7 |
8.64 |
595.13 |
445,300 |
Quercetin 3-O-arabinosylglucoside |
| 8 |
9.01 |
433.11 |
323 |
Quercetin glycosides |
| 9 |
9.46 |
463.09 |
301 |
Quercetin glycosides |
| 10 |
9.96 |
505.10 |
463,301 |
Quercetin 3′-glucoside-7-acetate |
| 11 |
10.48 |
477.11 |
342,314,285 |
Isorhamnetin glycosides |
| 12 |
11.16 |
563.10 |
519,315 |
Isorhamnetin 3-(6″-malonylglucoside) |
| 13 |
11.91 |
451.10 |
341 |
Cinchonain |
| 14 |
12.44 |
353.12 |
311,293 |
Caffeoylquinic acid |
| 15 |
22.29 |
279.23 |
233,199 |
p-coumaroylmalic acid |
Conclusion
Microwave-assisted extraction was an effective method of phenolic compounds from Anli pear. The optimal condition based on response surface methodology was 124 s as irradiation time, 408 W as power density, 56% (v/v) ethanol as solvent and 45:1 S/S ratio. The DPPH assay indicated that the antioxidant capacity of phenolic compounds from Anli pear was excellent and catechin, chlorogenic acid, quercetin glycosides, and isorhamnetin glycosides could be the mainly antioxidants in extract. This study suggested that Anli pear was a health fruit with great utilization value for further exploitation. In addition, purifying and isolating active compound from Anli pear should be extremely urgent.
Acknowledgments The authors gratefully acknowledge Analysis and Testing Center of Hebei Normal University of Science and Technology for providing testing equipment and the financial support from Science and Technology Support Project of Qinhuangdao city (No. Code 201401A059), China.
References
- Armata M., Gabrieli C., Termentzi A., Zervou M., and Kokkalou E. (2008). Constituents of Sideritis syriaca. ssp. syriaca (Lamiaceae) and their antioxidant activity. Food Chem., 111, 179-186.
- Bendahou A., Dufresne A., Kaddami H., and Habibi Y. (2007). Isolation and structural characterization of hemicelluloses from palm of Phoenix dactylifera L. Carbohyd. Polym., 68, 601-608.
- Canettieri E.V., Rocha G.J.M., Carvalho J.A., and Silva J.B.A. (2013). Optimization of acid hydrolysis from the hemicellulosic fraction of Eucalyptus grandis residue usingresponse surface methodology. Bioresource Technol., 98, 422-428.
- Chen J.L., Wang Z.F., We J.H., Wang Q., and Hu X.S. (2007). Chemical compositional characterization of eight pear cultivars grown in China. Food Chem., 104, 268-275.
- Cho J.Y., Kim C.M., Lee H.J., Lee S.H., Cho J.A., Kim W.S., Park K.H., and Moon J.H. (2013). Caffeoyl Triterpenes from Pear (Pyrus pyrifolia Nakai) Fruit Peels and Their Antioxidative Activities against Oxidation of Rat Blood Plasma. Agr. Food Chem., 61, 4563-4569.
- Cui T., Nakamura K., Ma L., Li J.Z., and Kayahara H. (2005). Analyses of arbutin and chlorogenic acid, the major phenolic constituents in Oriental pears. Agr. Food Chem., 53, 3882-3887.
- Farid D., Giorgia S., Kamal M., Hocine R., and Asma C., Khodir. (2014). Pistacia lentiscus leaves as a source of phenolic compounds: Microwave-assisted extraction optimized and compared with ultrasound-assisted and conventional solvent extraction. Ind. Crop. Prod., 61, 31-40.
- Fan G.J., Han Y.B., Gu Z.X., and Chen D.M. (2008). Optimizing conditions for anthocyanin extractions from purple sweet potato using response surface methodology (RSM). LWT-Food Sci. Technol., 41, 155-160.
- Ferreira D., Guyot S., Marnet N., Delgadill I., Renard C.M.G.C., and Coimbra M.A. (2002). Composition of phenolic compounds in a Portuguese pear (Pyrus communis L. var. S. Bartolomeu) and changes after sun-drying. Agr. Food. Chem., 50, 4537-4544.
- Guyot S., Marnet N., Sanoner P., and Drilleau J.F. (2001). Direct thiolysis on crude apple materials for high-performance liquid chromatography characterization and quantification of polyphenols in cider apple tissues and juices. Method. Enzymol., 335, 57-70.
- Hao J., Han W., Huang S., Xue D., and Deng X. (2002). Microwave assisted extraction of artemisnin from Artemisia annua L. Sep. Purif. Technol., 28, 191-6.
- Huang L.J., Gao W.Y., Li X., Zhao W.S., Huang L.Q., and Liu C.X. (2010). Evaluation of the in vivo anti-inflammatory effects of extracts from Pyrus bretschneideri Rehd. Agr. Food Chem., 58, 8983-8987.
- Jiang S.T, Shao P., Pan L.J., and Zhao Y.Y. (2006). Molecular distillation for recovering tocopherol and fatty acid methyl esters from rapeseed oil deodoriser distillate. Biosyst. Eng., 93, 383-391.
- Karabegovic I.T., Stojicevic S.S., Velickovic D.T., Nikolic N.C., and Lazic M.L. (2014). Optimization of microwave-assisted extraction of cherry laurel fruit. Separ. Sci. Technol., 49, 416-423.
- Li H.Y., Deng Z.Y., Wu T., Liu R.H., Loewen S., and Tsao R. (2012). Microwave-assisted extraction of phenolics with maximal antioxidant activities in tomatoes. Food Chem., 130, 928-936.
- Li X., Zhang J.Y., Gao W.Y., Wang Y., Wang H.Y., Cao J.G., and Huang L.Q. (2012). Chemical composition and anti-inflammatory and antioxidant activities of eight pear cultivars. Agr. Food Chem., 60, 8738-8744.
- Li X., Wang T.T., Zhou B., Gao W.Y., Cao J.G., and Huang L.Q. (2014). Chemical composition and antioxidant and anti-inflammatory potential of peels and flesh from 10 different pear varieties (Pyrus spp.). Food Chem., 152, 531-538.
- Lin L.Z. and James M.H. (2008). Phenolic compouds and chromatographic profiles of pear skins (Pyrus spp.). Agr. Food Chem., 56, 9094-9101.
- Liu Y., Wei S., and Liao M. (2013). Optimization of ultrasonic extraction of phenolic compounds from Euryale ferox seed shells using response surface methodology. Ind. Crop. Prod., 49, 837-843.
- Ma J.N., Wang S.L., and Zhang K. (2012). Chemical components and antioxidant activity of the peels of commercial apple-shaped pear (fruit of Pyrus pyrifolia cv. pingguoli). Food Sci., 77, C1097-C1102.
- Nagai T., Inoue R., Inoue H., and Suzuki N. (2003). Preparation and antioxidant properties of water extract of propolis. Food Chem., 80, 29-33.
- Oleszek W., Amiot M.J., and Aubert S.Y. (1994). Identification of some phenolics in pear fruit. Agr. Food Chem., 42, 1261-1265.
- Prakash Maran J, Sivakumar V, Thirgananasambandham K, and Sridhar R. (2013). Response surface modeling and analysis of barrier and optical properties of maize starch based edible films. Int. J. Biol. Macromol., 60, 412-421.
- Rychlinska I. and Gudej J. (2002). Flavonoid compounds from Pyrus communis L. flowers. Acta. Pol. Pharm., 59, 53-56.
- Salta J., Martins A., Santos R.G., Neng N.R., Nogueira J.M.F., Justino J., and Rajte A.P. (2010). Phenolics composition and antioxidant activity of Rocha pear and other pear cultivars a comparative study. Funct. Foods., 2, 153-157.
- Shao P., He J.Z., Sun P.L., and Zhao P.C. (2012). Analysis of conditions for microwave-assisted extraction of total water-soluble flavonoids from Perilla Frutescens leaves. Food Sci. Technol., 49, 66-73.
- Singleton V.L. and Rossi J.A. (1965). Colorimetry of total phenolics with phosphomolybdic phosphotungustic acid reagents. Am. J. Enol. Viticult., 16, 144-158.
- Spigno, G., Tramelli L., and De F.D.M. (2007). Effects of extraction time, temperature and solvent on concentration and antioxidant activity of grape marc phenolics. J. Food Eng., 81, 200-208.
- Xiao W.H., Han . LJ., and Shi B. (2008). Microwave-assisted extraction of flavonoids from Radix Astragali. Sep. Purif. Technol., 62, 614-618.
- Yang L., Jiang J.G., Li W.F., Chen J., Wang D.Y., and Zhu L. (2009). Optimum extraction process of polyphenols from the bark of Phyllanthus emblica L. based on the response surface methodology. Separ. Sci., 32, 1437-1444.
- Zhang Q.A., Zhang Z.Q., Yue X.F., Fan X.H., Li T., and Chen S.F. (2009). Response surface optimization of ultrasound-assisted oil extraction from autoclaved almond powder. Food Chem., 116, 513-518.