Introduction
The temperature and heating time required for thermal processing of food must be appropriately controlled in order to guarantee both high-quality products and suitable sterilization. In addition, high-quality cooked food may be obtained by predicting and controlling the mass-transfer phenomena as well as the various other reactions that occur along with heat transfer. Several recent studies have predicted the occurrence of changes in the factors that influence the quality of protein-based foods, such as changes in the color of fish flesh during grilling (Matsuda et al., 2013), the protein denaturation profile (Ishiwatari et al., 2013a), and umami component of beef during cooking (Ishiwatari et al., 2013b).
Cooking is known to cause denaturation of muscle proteins, which directly influences the structural characteristics of food; these changes are believed to result in a substantial loss of water (Tornberg, 2005). Several studies have observed correlations between the denaturation of specific muscle proteins and the change in water characteristics upon heating (Tornberg, 2005). Moreover, the state of water in muscles had a profound effect on meat quality attributes, such as juiciness and tenderness, because of the influence of actin denaturation on weight-loss; in addition, there was a dramatic increase in the elastic modulus of the meat (Ishiwatari et al., 2013a). Despite the importance of factors that determine the quality of cooked meat, the mass transfer characteristics of meat during cooking have been scarcely investigated.
Mass transfer during the cooking of meat has been reported to follow Darcy's law, which models the flow characteristics in combination with diffusion, as shrinkage occurs through the thermal denaturation of myofibril proteins (Feyissa et al., 2013; Van der Sman, 2007a, 2007b):
In this equation, ω is the solution flux, λ is the permeability, η denotes the fluid viscosity, and P represents the pressure.
The fluid behavior of meat during cooking cannot be calculated using Darcy's law without the essential parameter, liquid viscosity (η). Although Den Hertog-Meischke et al. (1998) demonstrated that the viscosity of a liquid released from meat during refrigeration was higher than that of water, previous analyses of mass transfer during meat cooking have adopted the viscosity of pure water (Feyissa et al., 2013; Van der Sman, 2007a, 2007b). The viscosity of expressible water in meat is expected to differ greatly from that of pure water as it contains water-soluble proteins. Specifically, the denaturation of water-soluble proteins with rising temperature during cooking leads to drastic changes in the viscoelastic behavior and viscosity of meat.
The viscosity of expressible water in meat cannot be measured directly; therefore, meat juice extracted from raw meat by centrifugation was assumed to be equivalent to expressible water in meat. Using meat juice, we performed a dynamic viscoelastic oscillatory measurement in a temperature range of 20 – 80°C. Subsequently, we attempted to describe the temperature dependence of expressible water in meat based on the denaturation kinetics of water-soluble proteins.
Materials and Methods
Sample preparation Meat juice was collected by centrifugation. A round beef block, purchased from a retail store, was cubed (2.0 × 2.0 × 2.0 mm3). A sample weighing 10 ± 0.1 g was placed in a 50 mL centrifuge tube and centrifuged (20000 g) at 10°C for 60 min. The supernatant was collected and used in all experiments.
pH measurement A standard pH meter equipped with a glass electrode (F-57T; Horiba, Ltd.) was used for pH measurements. pH values were calculated as the average of four replicates.
Quantification of water-soluble protein concentrations of meat juice Meat juice was diluted 40-fold using distilled water. This solution was used to quantify the water-soluble protein concentration using a Protein Assay Rapid Kit (Wako Pure Chemical Industries, Ltd.), with bovine serum albumin as the standard.
Dynamic viscoelastic oscillatory measurements Dynamic viscoelastic behavior of meat juice was measured at a temperature range of 20 – 80°C using a rheometer (HAAKE MARS III; Thermo Fisher Scientific, Carlsbad, CA, USA). A 2.0-mL sample was subjected to oscillatory measurements at a frequency of 1.592 Hz using a 35 mm parallel plate. The samples were heated at a rate of 1.0°C/min using the Peltier plate of the rheometer. The results of these measurements were expressed as complex viscosity (η*).
Differential scanning calorimetry measurements Meat juice (80.5 ± 0.98 mg) was placed in a large-volume stainless-steel pan (part no. 03190218; PerkinElmer, Inc.), which was sealed with a stainless-steel cover and rubber O-ring. This pan was maintained at 20°C until further measurements. The samples were heated from 20 to 90°C at different heating rates (denoted by β; β = 2.5, 5.0, 7.5, 10, 15, and 20°C/min), and examined using a differential scanning calorimetry (DSC) instrument (Pyris1 DSC; PerkinElmer, Inc.). An empty pan was used as the reference. Following DSC analysis, the pans were punctured and the weight of sample dry matter was determined by drying at 105°C for 24 h. The peak temperature (Tmax) and denaturation enthalpy (ΔH) were determined from the DSC curve obtained for each run.
Results and Discussion
Water-soluble protein concentration in meat juice Protein solubility is sensitive to the pH of the solution (Ito et al., 2004); therefore, the protein concentration may influence the viscosity of the meat juice. Therefore, we determined the pH and protein concentration of meat juice obtained by centrifugation. The average pH of the sample was 5.62, nearly equivalent to that of dripping pork samples as measured in previous studies (Den Hertog-Meischke et al., 1998; Den Hertog-Meischke et al., 1997; Ngapo et al., 1998). In this study, the sample protein concentration was determined to be 78.9 ± 5.71 mg/mL, calculated as the average of four replicates. These results are consistent with those reported previously for dripping beef samples (prepared from beef stored under various conditions), i.e., 89.3 ± 7.28 mg/mL (Anon and Calvelo, 1980) and 81.9 mg/mL (Den Hertog-Meischke et al., 1998).
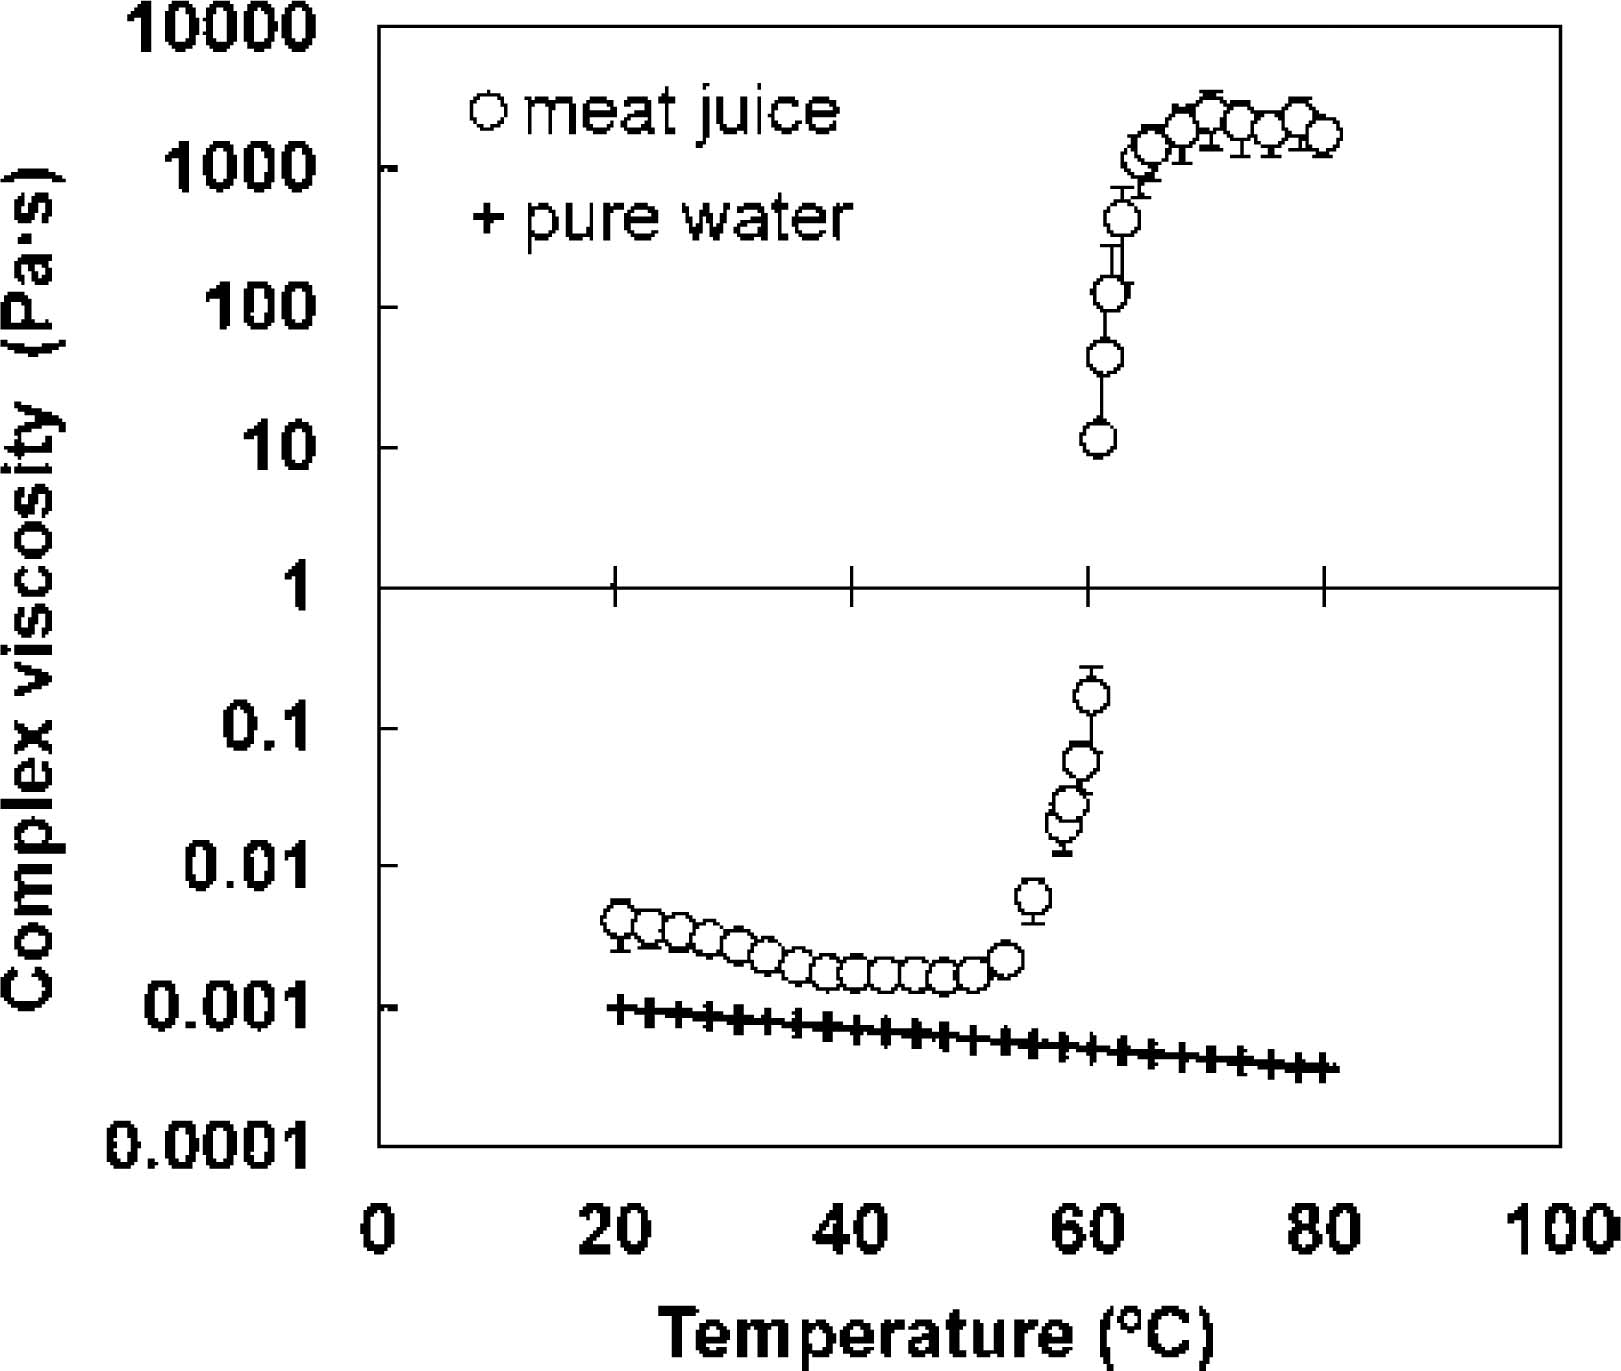
Effect of heating on complex viscosity of meat juice Figure 1 presents the changes in complex viscosity corresponding to the change in temperature (over the range 20 – 80°C) at a heating rate of 1.0°C/min. The relation between complex viscosity and temperature changed dramatically at a temperature > 60°C. Hertog-Meischke et al. (1998) reported that the viscosity of drip from meat, with a protein concentration of 81.6 mg/mL, and heating temperatures ranging from 0 to 30°C, showed an exponential relationship, as described in the following equation:
Here, η indicates the viscosity and T is the temperature.
A comparison of the values measured in this experiment with those calculated using Eq. 2 (e.g., 3.12 × 10⁻³ Pa s at 20°C; 2.55 × 10⁻³ Pa s at 30°C) revealed the similarity between these values. The viscosity of meat juice was observed to be higher than that of pure water over the entire range of temperatures (Fig. 1). The complex viscosity was observed to decrease continuously with the increase in temperature, up to 49.4 ± 0.01°C. However, the complex viscosity showed a drastic increase when the temperature exceeded 60°C, with the maximum value being observed at 70.3 ± 0.01°C. The behavior of meat juice was significantly different from that of pure water; therefore, the viscosity of pure water is not suitable for representing the mass-transfer coefficient of cooking meat. Furthermore, the change in complex viscosity of meat juice at higher temperatures differs from that of pure water as a result of the denaturation of water-soluble proteins with increasing temperature. Therefore, we performed a kinetic analysis of the water-soluble proteins of meat juice using DSC, and expressed the temperature dependence of viscosity as a function of the denaturation degree of the water-soluble proteins.
Thermal denaturation of water-soluble proteins of meat juice observed by differential scanning calorimetry Figure 2 shows the DSC curve of meat juice at a heating rate of 10°C/min. The sample thermogram always showed two endothermic peaks; the maximum peak temperatures (Tmax) for the endothermic peaks at a heating rate of 10°C/min were 54.6°C (peak I) and 68.0°C (peak II). Moreover, peak II was observed to be clearer (Fig. 2); the denaturation enthalpy of peak II was approximately six times that of peak I.
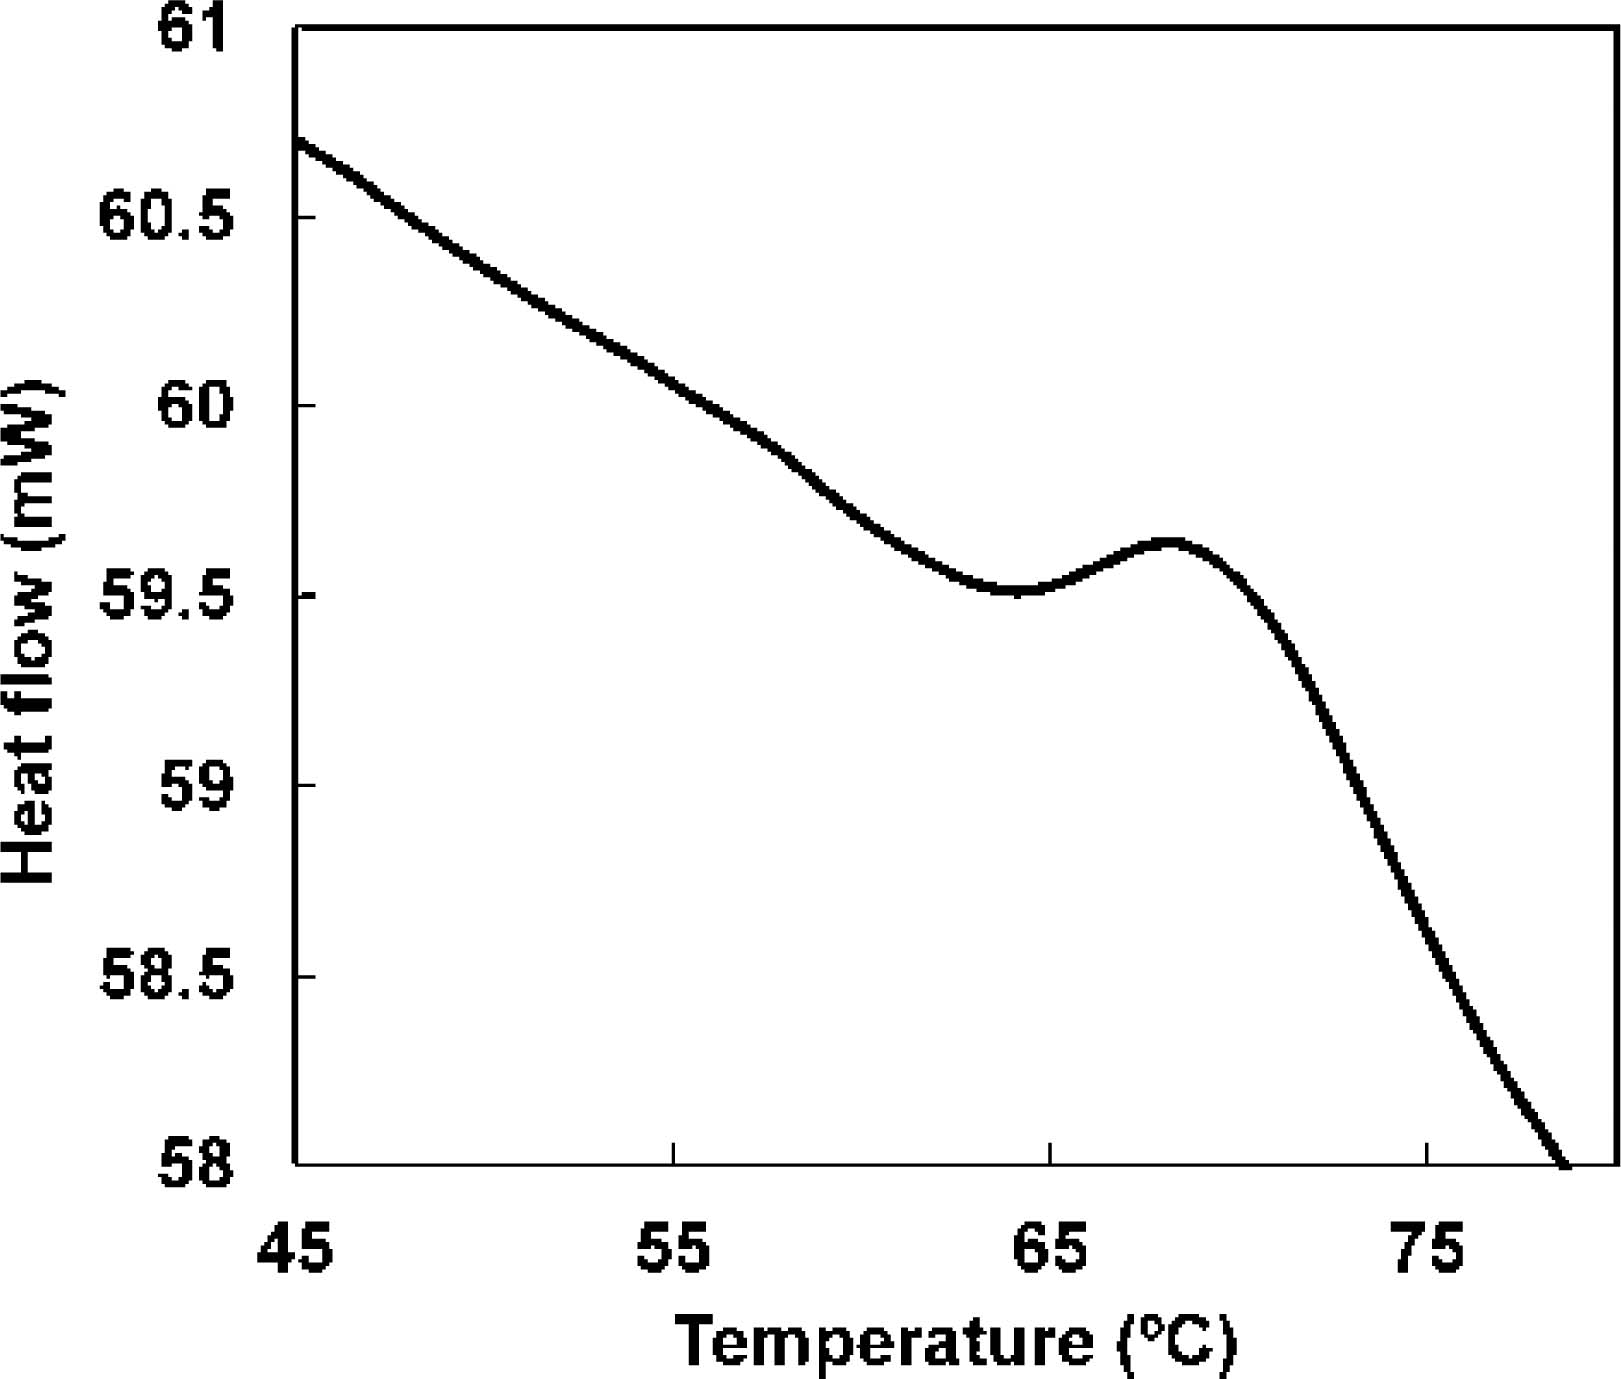
Based on previous reports, the two obtained endothermic peaks were believed to correspond to sarcoplasmic proteins (Findlay et al., 1989; Tornberg, 2005; Wright et al., 1977). Sarcoplasmic proteins consist predominantly of glycolytic enzymes; however, they also contain creatine kinase and myoglobin. In particular, the remaining myoglobin percentage of meat products (i.e., ground beef) during cooking is an index of doneness, as myoglobin is a chromoprotein (Hunt et al., 1999; Lytras et al., 2000). The DSC measurements suggested that peak II corresponded to myoglobin, as it was reported that the endothermic peak for myoglobin in tuna meat (pH 5.5) occurred at approximately 66°C (Ochiai, 2010). The DSC measurements therefore suggested that meat juice contains two types of water-soluble proteins with different denaturation temperatures.
Kinetic parameters for thermal denaturation of water-soluble proteins, obtained by dynamic differential scanning calorimetry The DSC dynamic method was used to obtain the kinetic parameters for thermal denaturation of water-soluble proteins in meat juice. The thermal denaturation rate of water-soluble proteins present in meat juice was assumed to be proportional to the concentration of non-denatured water-soluble proteins (C; i.e., a first-order reaction), with the following reaction kinetic equation:
Where, k is the rate constant of the reaction. Eq. 3 can be expressed as:
Where, C0 and Ct denote the concentrations of the non-denatured proteins during initiation and at time t, respectively. X represents Ct/C0, or the non-denaturation ratio, a dimensionless parameter. The temperature dependence of the reaction rate constant k was calculated using the Arrhenius equation:
Where, Z is the pre-exponential factor of the Arrhenius equation, Ea is the activation energy, R is the universal gas constant, and T is the temperature.
The kinetic analysis of water-soluble proteins present in meat juice during heating cannot be performed without the Z and Ea values. These Arrhenius parameters were estimated using the Ozawa method, wherein DSC was performed under non-isothermal conditions (Ozawa, 1970). The relationship observed between the heating rate β and Tmax during DSC can be demonstrated using the following equation:
With the increase in heating rate of the scans, the Tmax values were observed to shift to higher temperatures. Subsequently, −ln(β/Tmax2) was plotted against 1/Tmax, according to Eq. 6. The plots were observed to be linear (peak I: r2 = 0.935; peak II: r2 = 0.936), and the slopes and intercepts were used to calculate the Arrhenius parameters (peak I: Ea = 415.8 ± 10.4 kJ/mol, Z = 1.12 × 1067 1/min; peak II: Ea = 405.9 ± 16.3 kJ/mol, Z = 4.82 × 1063 1/min). The kinetic parameters for the thermal denaturation of proteins at a given temperature were calculated from Eqs. 4 and 5 using the obtained Ea and Z values. In addition, differentiation of the time course of protein denaturation allowed for the calculation of the inflection point corresponding to the peak temperature of DSC measurements. These parameters were confirmed by comparing the calculated and measured inflection points upon heating from 20 to 90°C (at a heating rate of 10°C/min). The calculated Tmax of peak I was 54.1°C, and that of peak II was 67.5°C, both of which are nearly equal to the measured Tmax values.
Relationship between complex viscosity and the denaturation of water-soluble proteins of meat juice during temperature scanning Andrade's equation has been frequently used to express the temperature dependence of liquid viscosity:
Where, Zν is the pre-exponential factor, Eaν is the activation energy, and R is the gas constant. Andrade's equation can be applied to many polymer solutions and reactions, such as melting and glass-transition phenomena (Ishihara and Sano, 2001; Krevelen, 1997). The measured complex viscosity from 20 to 49.4 ± 0.01°C was assumed to be applicable to Andrade's equation. The activation energy and pre-exponential factor for Andrade's equation were determined by plotting η vs 1/T, i.e., an Arrhenius-type plot. The plot of experimental values from 20 to 49.4°C produced a straight line (r2 = 0.928); the slope and intercept values were used to determine the activation energy (Eaν = 28.49 kJ/mol) and pre-exponential factor [Zν = 3.38 × 10⁻⁸ 1/(Pa s)].
Normally, the viscosity of a liquid decreases with the increase in temperature, in accordance with Andrade's equation; however, the complex viscosity of meat juice was observed to increase beyond a temperature of 49.4°C. Therefore, the complex viscosities measured above 49.4°C were normalized by dividing the measured value by that obtained by Andrade's equation, as follows:
Where, η* is the experimental value and ηa* is the value calculated using Eq. 7.
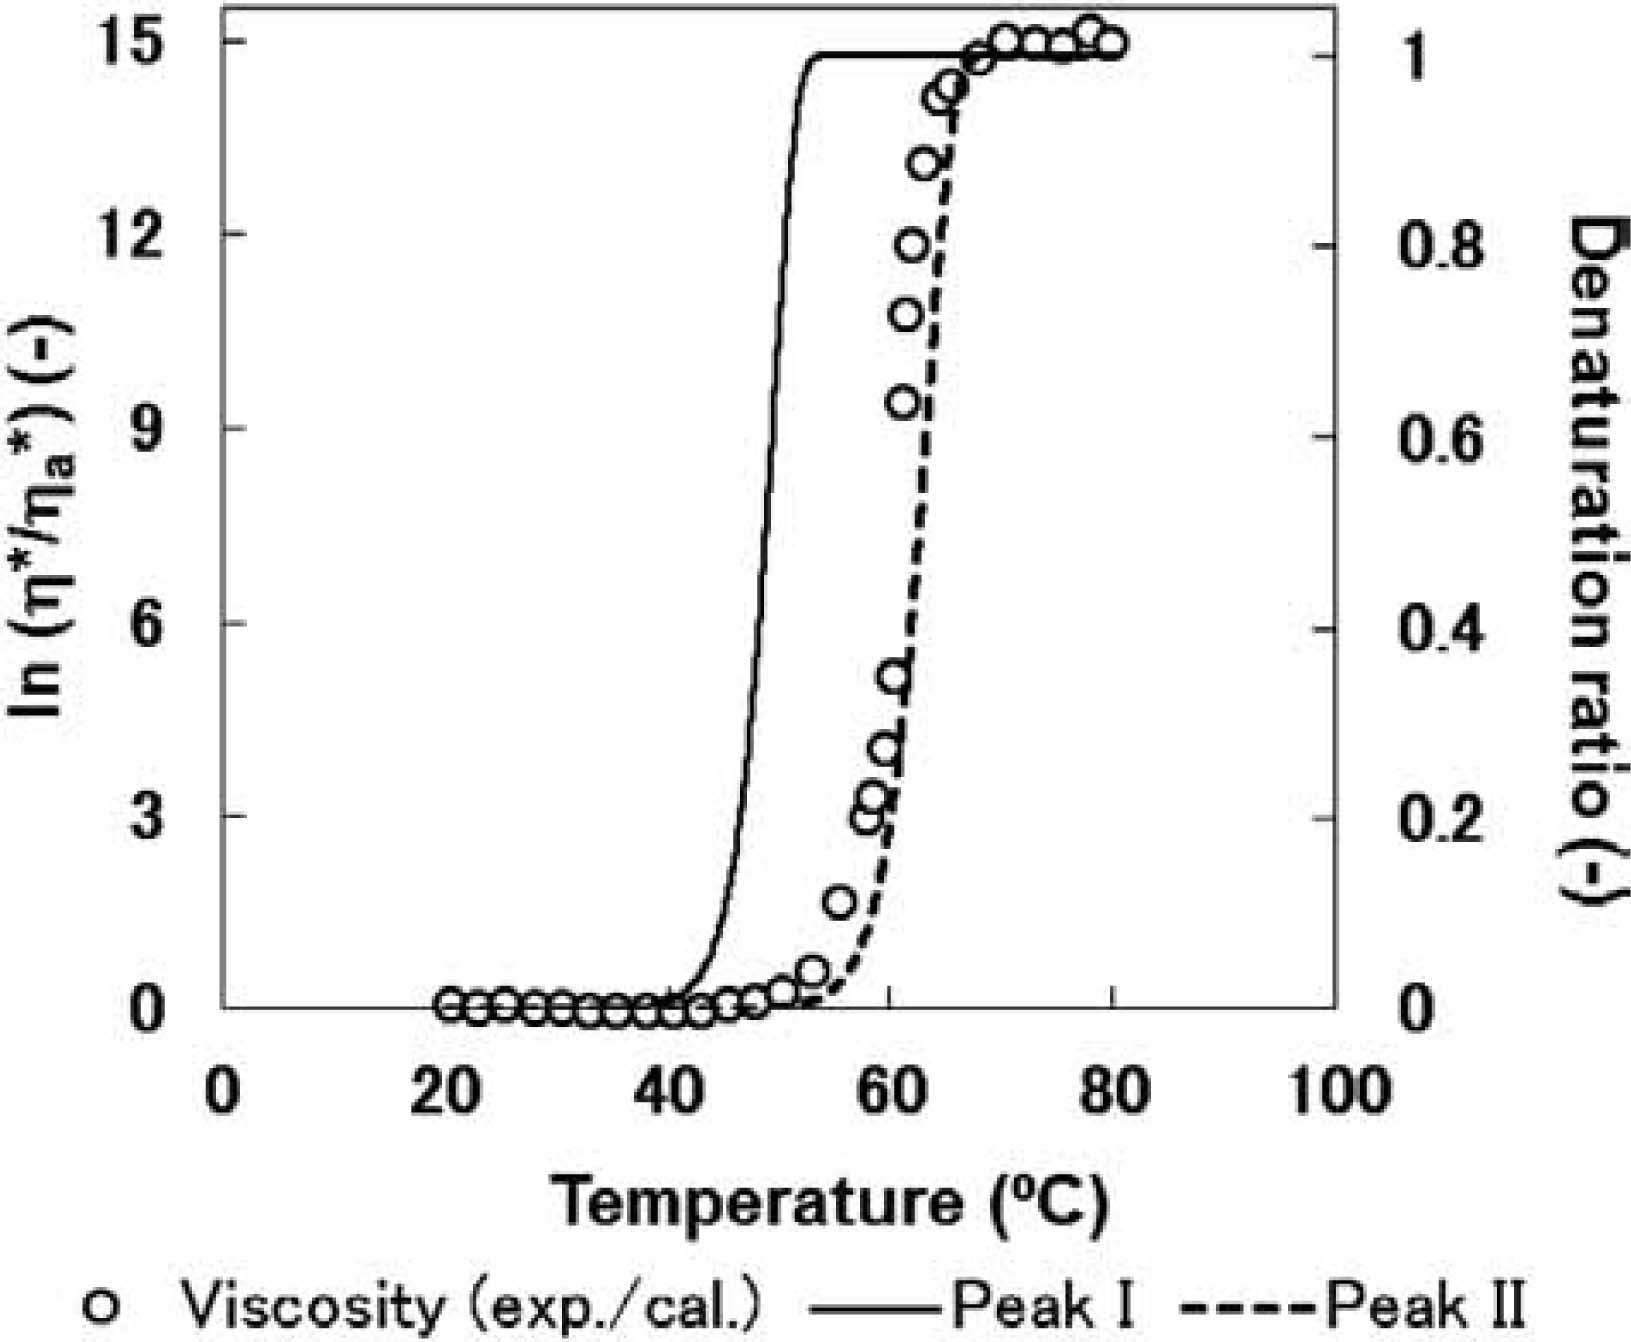
These results suggest a relation between the temperature dependence of complex viscosity and the degree of meat protein denaturation; therefore, the changes in the ratio of complex viscosity, η*/ηa*, were compared with the protein denaturation ratio during heating. The change in protein denaturation ratio upon heating from 20 to 80°C (at a heating rate of 1.0°C/min) was calculated using the Arrhenius parameters (Fig. 3). The denaturation ratio was calculated as follows:
Where, Xd is the denaturation ratio and X is the non-denaturation ratio calculated using Eq. 4.
Based on the results of our previous studies (Ishiwatari et al., 2013a; Kajitani et al., 2011), we assumed the temperature at which the denaturation ratio became 0.001 to denote the start of denaturation; denaturation was believed to conclude at a ratio of 0.999. The denaturation of peaks II and I were observed at approximately 55°C and 40°C, respectively. The rate of change in complex viscosity (η*/ηa*) was observed to be in agreement with the protein denaturation behavior of peak II (Fig. 3). In contrast, the denaturation of peak I did not significantly influence the complex viscosity; in fact, at low temperatures (from 20 to 49.4°C) this followed Andrade's equation. However, the initiation of the protein denaturation of peak II led to a drastic change in complex viscosity. Therefore, the following equation was derived to express the estimated complex viscosity as a function of the reaction rate of thermal denaturation of the water-soluble proteins:
Where, a is a constant.
Before the start of denaturation associated with peak II, i.e., Xd = 0, it follows from Eq. 10 that
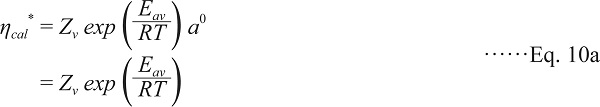
Where ηcal* is dependent only on Andrade's equation. In contrast, after the complete denaturation of water-soluble proteins associated with peak II, i.e., Xd = 1.0, it follows from Eq. 10 that
Therefore, ηcal* can be obtained as the product of Andrade's equation and the constant a.
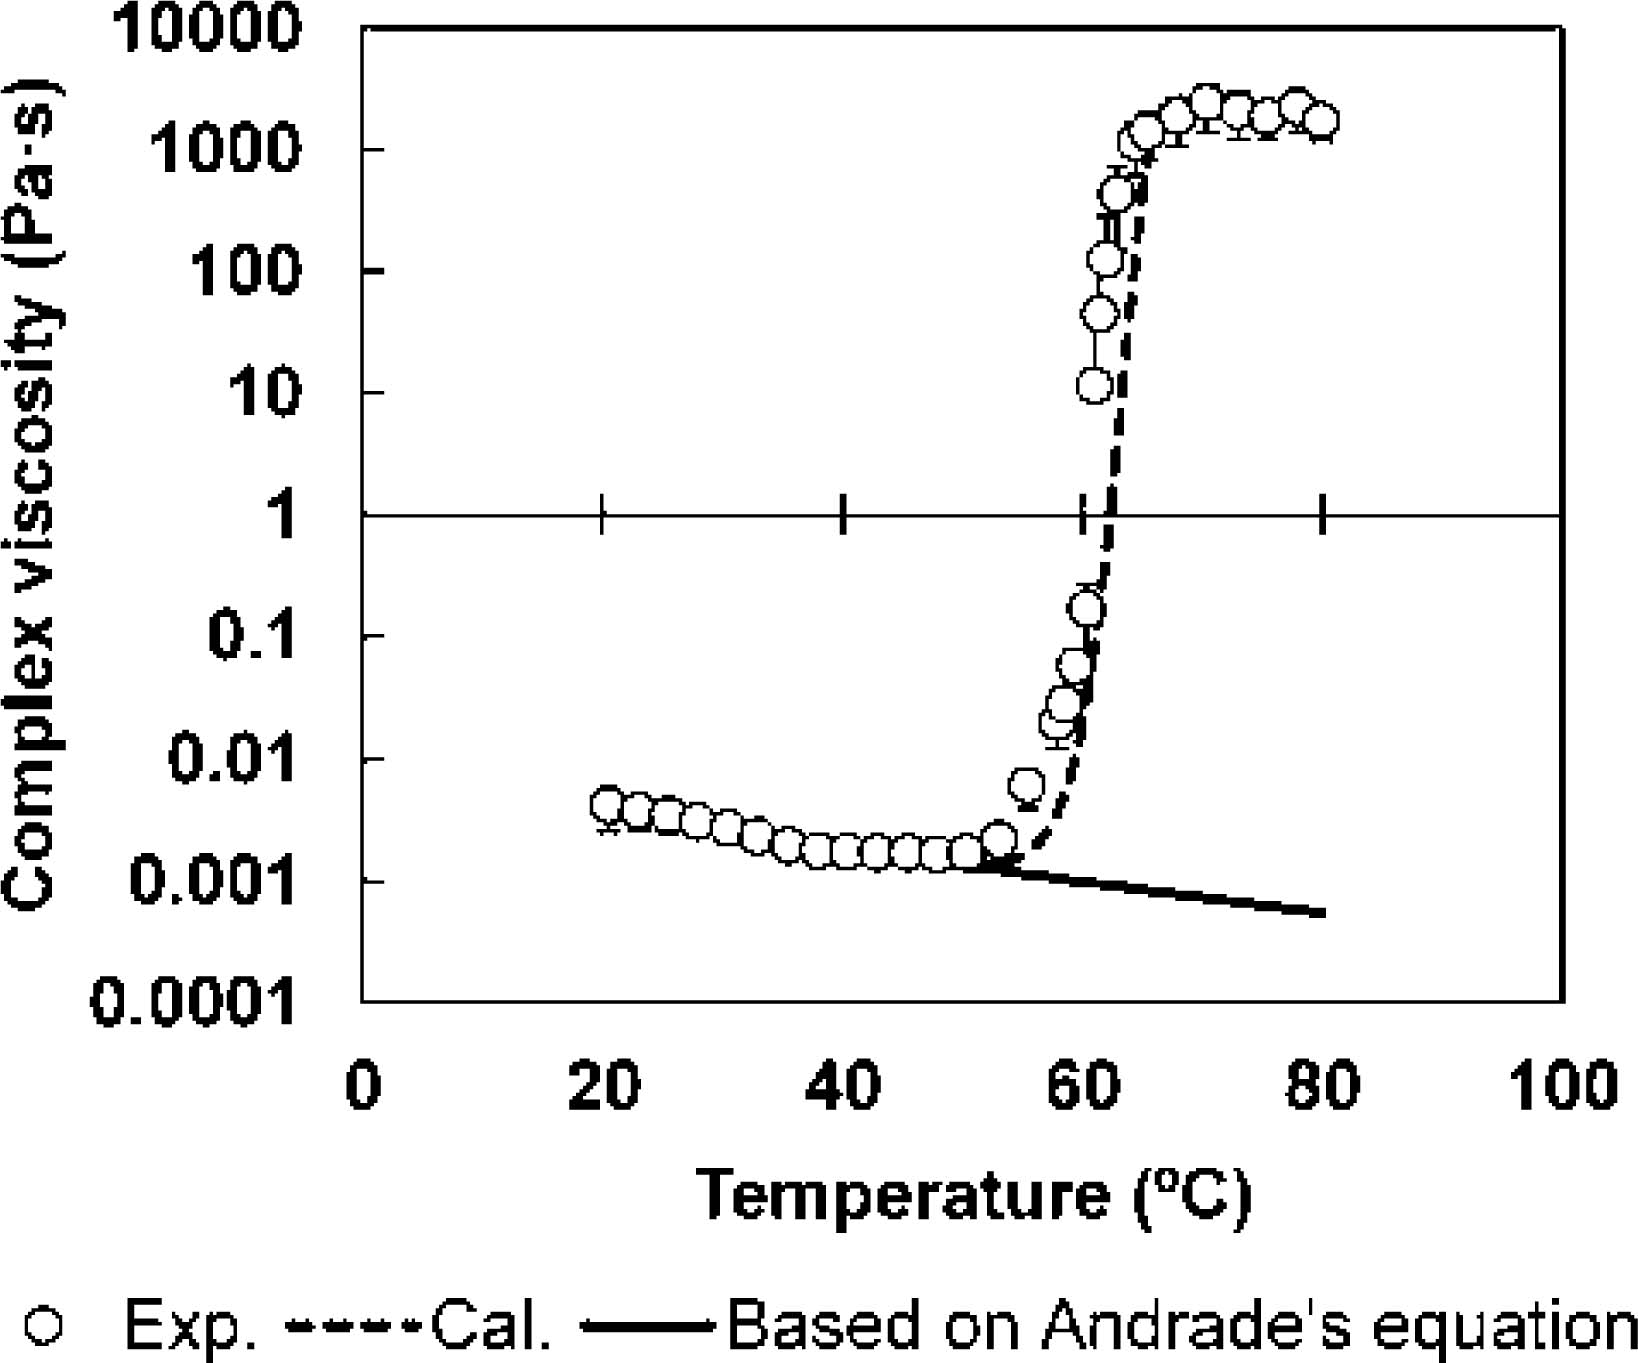
Based on the predicted results for the protein denaturation ratio when the sample is heated from 20 to 80°C (at a heating rate of 1.0°C/min), the temperature associated with peak II at the end of denaturation was calculated to be 69.3°C. This temperature is nearly the same as that (70.3 ± 0.01°C) associated with the maximum measured complex viscosity. Protein denaturation associated with peak II was complete at 70.3°C (Xd = 1.0); therefore, constant a was determined to be 3.36 × 10⁶ by inserting the maximum value of the measured complex viscosity into Eq. 10b.
Equation 10 was verified by comparing the measured complex viscosity and the value predicted based on the denaturation ratio of the water-soluble protein of meat juice. The predicted values showed the same behavior as the measured values (Fig. 4). Therefore, this new empirical model based on the denaturation kinetics of water-soluble proteins combined with Andrade's equation could be used to predict the viscosity of expressible water in meat at an arbitrary temperature.