Abstract
Effects of ionic strength on chemical forces and functional properties of heat-induced myofibrillar protein gel were investigated. The decrease of total sulfhydryl groups suggested that more disulfide bonds formed with the increase of ionic strength. The increase of surface hydrophobicity and normalized intensity of 760 cm−1 band of Raman spectra indicated that higher ionic strength strengthened hydrophobic interactions. The decrease of normalized ratio of I850/I830 and absolute value of zeta potential indicated that higher ionic strength weakened hydrogen bonds and electrostatic interactions. The storage modulus (G′), hardness and water holding capacity (WHC) all increased significantly with the increase of ionic strength from 0.2 – 0.6 (p < 0.05). The enhancement of functional properties at higher ionic strength was achieved by strengthening attractive forces and weakening repulsive forces.
Introduction
Functional properties of heat-induced myofibrillar protein gel were important for meat products (Fukazawa et al., 1961; Macfarlane et al., 1977; Siegel and Schmidt, 1979). Gel formation was typically induced by association of unfolded protein molecules via various chemical forces, namely disulfide linkages, electrostatic, hydrophobic interactions, and hydrogen bonds (Mulvihill and Kinsella, 1987; Oakenfull et al., 1997). Functional properties of heat-induced myofibrillar protein gel were mainly depended on chemical forces (Joseph et al., 1994; Wan et al., 1994). Previous literatures have showed the importance of chemical forces in heat-induced protein gels. Smyth et al. (1998) found that hardness of myosin gel could be weakened by adding dithiothreitol (DTT) to prevent the formation of disulfide bonds. Liu and Hsieh (2007) studied the molecular interactions of protein gels by adding DTT, urea and other reagents, and they concluded that non-covalent bonds played a more important role than disulfide bonds in the formation of heat-induced protein gels. Hermansson (1979) found that when less net electric charge were distributed on the surface of protein molecules, the electrostatic repulsion, hydrophobic attractions and intermolecular hydrogen bonds could keep a better balance, which made it easier to form ordered gel network. Hayakawa and Nakai (1985) reported that hydrophobic interactions of myosin were proposed to be the prerequisites for the formation of large aggregates. However, up to now, available data on chemical forces and the relationships between chemical forces and functional properties of MP gel are limited.
Raman spectroscopy could be employed to investigate the chemical forces of heat-induced protein gel (Ikeda and Li-Chan, 2004; Li-Chan, 1996; Liu et al., 2011). Tryptophan (Trp) was a hydrophobic amino acid with hydrophobic residues. The normalized intensity of the Raman band near 760 cm−1 was assigned to the stretching vibration of the tryptophan residues ring and could be used to investigate the hydrophobicity of the Trp residues, and then reflect the hydrophobic interactions of protein gel (Ikeda and Li-Chan, 2004; Li-Chan, 1996; Tu, 1982). Doublet bands at 830 and 850 cm−1 arise from Fermi resonance of ring-breathing vibrations of tyrosine (Tyr) and an overtone of out-of-plane ring-bending vibrations of the para-substituted benzene bands, the relative intensity reflecting the nature of hydrogen bonding and the state of the phenolic hydroxyl group in the Tyr side chain (Ikeda and Li-Chan, 2004; Li-Chan, 1996). Zeta potential presents the potential difference between the dispersion medium and the stationary layer of fluid attached to the dispersed particle and can be used to indicate the degree of electrostatic interactions between adjacent, similarly charged particles in a dispersion (Runkana et al., 2004).
Several studies had been performed to investigate the effects of ionic strength on functional properties such as G′, hardness and WHC (Bjorg et al, 1986; Boyer et al., 1996; Laure et al., 2014; Stone and Stanley, 1994). However, literatures and available data on how ionic strength affects chemical forces are very few, especially regarding hydrogen bond and electrostatic interactions. The objective of this article was to investigate the effects of ionic strength on chemical forces of MP gel, and to elucidate the correlation between chemical forces and functional properties. In this study, Raman spectroscopy and zeta potential were used to investigate the effects of ionic strength on hydrogen bond and electrostatic interactions respectively.
Materials and Methods
Materials Six week-old commercial broilers (AA type) were purchased from a commercial chicken farm in Nanjing, China. Bovine serum albumin (BSA) was obtained from Sinopharm Chemical Reagent Co., Ltd (Shanghai, China). All chemicals used were of analytical grade.
Methods
Extraction of myofibrillar protein and preparation of myofibrillar protein gel The myofibillar protein (MP) was extracted from chicken breast meat carried out as described by Xiong et al. (2000) with some modification. Trimmed, ground muscle (40 g) was cut into small pieces (about 0.5×0.5×0.5 cm3) and homogenized in eight volumes of a buffer (0.1 mol/L KCl, 2 mmol/L MgCl2, 1 mmol/L EGTA, 0.5 mmol/L dithiothreitol, and 10 mmol/L K2HPO4, pH 7.0) in a homogenizer (DS-1, Shanghai specimen model factory, Shanghai, China). The homogenates were centrifuged (4°C) at 2000×g for 20 min (Beckman Avanti J-26XP centrifuge, Beckman Coulter, USA). After decanting the supernatant, pellets were resuspended and centrifuged under the same conditions above for another twice. Centrifugation (2,000×g for 20 min) was used to collect the pellet between suspensions. After that, the pellet was resuspended in eight volumes of another buffer (0.1 mol /L KCl, 1 mmol/L NaN3, pH 6.0), filtered with clean and dry gauzes, and then centrifuged (2,000×g for 20 min). After decanting the supernatant, pellets were resuspended, filtered and centrifuged under the same conditions above for another twice. Finally we got the purified myofibrillar protein pellet. The protein concentration was determined by the Biuret method (Gornall et al., 1949) using bovine serum albumin (BSA) as the standard, the myofibrillar protein was stored at 4°C and used within 48 h.
2 mL of 25 mg/mL MP solutions with different ionic strength (0.2, 0.3, 0.4, 0.5, 0.6, pH 6.0) were placed in 7 mL capped plastic centrifuge tubes. 2 mL of 25 mg/mL MP solutions with different ionic strength were placed in 7 mL capped plastic centrifuge tubes. The tubes were heated in a water bath at a rate of about 1°C/min from 20°C to 65°C and kept at 65°C for 20 min. Xu (2003) and Yasui et al. (1979) mentioned that the optimum temperature for protein gelation was 60 – 70°C, higher temperature was unfavorable for gelation, and we chose 65°C for gelation in this work. After that, the tubes were cooled to room temperature and then kept overnight at 4°C for texture and water holding capacity (WHC) tests. 60 mg/mL MP gel for Raman spectra tests were prepared according to the same procedures to the preparation of MP gel for texture and water WHC tests.
Sulfhydryl group content measurement The total and reactive SH groups were determined according to the methods of Ellman (1959) and Liu et al. (2011). For determination of total SH groups, 4.5 mL of a solution with different ionic strength (0.2 – 0.6) containing 8 mol/L urea, 10 mmol/L EDTA and 0.1 mol/L KH2PO4 (pH 6.0), and 100 µL Ellman's reagent (10 mmol/L 5, 5-Dithio-bis-[2-nitrobenzoic acid]) were added to 0.5 mL protein solution (1 mg/mL), the mixture was set at room temperature for 25min. The absorbance was measured at 412 nm to calculate the total SH groups using a molar extinction coefficient of 13,600 M−1 cm−1 by a spectrophotometer (Model 722N, Shanghai Precision and Scientific Instrument Co., Ltd., China). Reactive SH groups were conducted as the measurement of total SH groups in the absence of urea.
Surface hydrophobicity The surface hydrophobicity (S0) of MP gel was determined using 1-anilinonaphthalene-8-sulphonic acid (ANS) as a hydrophobic fluorescence probe according to Yongsawatdigul and Park (2003) with some modifications. MP solution (1 mg/mL) was diluted to a series of solutions with different protein concentrations ranged from 0 to 0.5 mg/mL. 25 µL of 8 mmol/L ANS in 0.1 mol/L phosphate buffer (pH 6.0) was added to 5 mL of above protein solutions and mixed well. Samples were kept under dark conditions for 20 min. Fluorescence intensity of the mixture was measured using a fluorescence spectrophotometer (F-7000, Hitachi Corporation, Japan) at an excitation wavelength of 374 nm and emission wavelength of 485 nm respectively, and a 5 nm width for both the excitation and emission slits. S0 of each sample was expressed as the initial slope of the relative fluorescence vs. protein concentration.
Raman spectra tests The Raman spectrum of each sample was measured on a Jobin Yvon LabramHR800 spectrometer (Horiba/Jobin. Yvon, Longjumeau, France) equipped with a microscope with a 50×lens, which was used to focus the excitation laser beam (514.5 nm exciting line of a Spectra Physics Ar-laser) on the sample and collect Raman signals in the backscattered direction. The gel sample was spread on a glass slide during measurement. Raman spectra were recorded under following conditions: laser power, 100 mW; laser spot diameter reaching the sample, 1 µm; spectral resolution, 2.0 cm−1; number of sample scans, 3. The time required for the acquisition of 1 spectrum was about 1min. The Phenylalanine ν-ring band located near 1003 cm−1 was used as internal standard to normalize the spectra, as it has been reported to be insensitive to the microenvironment (Herrero, 2008; Li-Chan, 1996; Li-Chan et al., 1994). The water spectrum was previously subtracted from the spectra by following the criteria as described in the literature (Alix et al., 1988; Herrero et al., 2008).
Zeta potential 1 mL MP solution (1 mg/mL) was injected in the clear disposable zeta cell (DTS1060C, Malvern Instruments Ltd., Worcestershire, UK) for zeta potential measurement. The zeta potential was measured by a zetasizer (Nano-ZS90, Malvern Instruments Ltd., Worcestershire, UK) equipped with an APD detector. At least three replicates were performed for each sample.
Rheological measurement The rheological property of myofibrillar protein solutions (25 mg/mL) was monitored by a rheometer (MCR302, Anton paar, Austria), equipped with a parallel plate (PP50, 50 mm diameter). Measurements were at a strain of 0.02, a constant frequency of 0.1 Hz and a 0.5 mm gap. Temperature was increased at a rate of 1°C /min from 20°C to 80°C. Storage modulus (G′) values were recorded continuously.
Textural measurement Gel hardness was determined using a texture analyzer (TA.XT.Plus, Stable Micro Systems, Godalming, UK) equipped with a probe of P6. The parameters were set in the Texture Expert program as follows: pre-test speed, 5.0 mm/s; test speed, 1.0 mm/s; post-test speed, 5.0 mm/s; trigger type, auto-5 g; data acquisition rate, 200 points/s; and distance, 5 mm. Tests were triplicated.
WHC measurement The WHC was determined by a centrifugal method (Kocher and Foegeding, 1993) with some modifications. The MP gel (2 g) was centrifuged at 10000×g for 10 min, the supernatant was removed, and the total weight of centrifuge tube and MP gel was weighed before and after centrifugation. WHC was expressed as the ratio of gel weight after centrifugation to the initial gel sample weight (Equation 1).
Where W2 is the total weight (g) of centrifuge tube and MP gel after centrifugation, W1 is the total weight (g) of centrifuge tube and MP gel before centrifugation, W is the weight (g) of centrifuge tube. Each measurement was performed in triplicate.
Statistical analysis Statistical analysis of results were performed using SPSS software (SPSS Inc., Ver.19, Chicago, IL), all data were presented as means ± standard deviation (SD). A one-way analysis of variance (ANOVA) and correlation analysis were employed to determine the statistical difference. Significant differences between means were identified using Duncan's multiple range test (p < 0.05).
Results and Discussion
Sulfhydryl group content Total sulfhydryl groups are all sulfhydryl groups of protein molecules, including sulfhydryl groups both exposed on the surface and buried in the proteins. Reactive sulfhydryl groups are referred to those exposed on the surface of protein molecules (Hamada et al., 1994; Zhang et al., 2015).
Fig. 1 showed the changes of total and reactive sulfhydryl (SH) content of myofibrillar protein gel with different ionic strength. The content of reactive SH groups first increased with the increase of ionic strength, attaining a maximum of 6.09 mol/104 g protein at ionic strength of 0.4, and then gradually decreased. This might be due to that the increase of ionic strength from 0.2 to 0.4 promoted the solubility of myofibrillar protein, and leaded to exposure of buried SH groups through protein unfolding, then the exposed SH groups were buried in network of MP gel (when heated for gelation) with the further increase of ionic strength, resulting in the decrease of reactive SH content.

At the initial ionic strength of 0.2, total SH group content was 12.16 mol/104 g proteins. Whereas samples with ionic strength of 0.6 showed a much lower content of SH groups (9.83 mol/104 g proteins). More disulfide bonds formed due to the exposure of more sulfhydryl groups of actomyosin and the decrease in total SH contents might suggest that disulfide bonds were formed (Monahan et al., 1995; Shigeru and Shuryo, 1985). The decrease of total SH groups suggested that higher ionic strength strengthened the formation of disulfide bonds. This might be due to that metal ions had a screening effect on the negative electric charge on the protein surface (Fennema, 2008), leading to the weakness of repulsion forces between protein molecules (this was confirmed by the changes of zeta potential in Fig. 5), the distances between SH groups decreased, SH groups were more likely to react to form disulfide bonds.

Surface hydrophobicity ANS (1-anilinonaphthalene-8-sulphonic acid) as a hydrophobic fluorescence probe had a relatively weak fluorescence when dispersed in water, while its fluorescence increased dramatically when bound to non-polar parts (hydrophobic sites or pockets) of protein molecules (Cao et al., 2012). The increase of hydrophobicity of protein was caused by the exposure of the interior hydrophobic residues of protein molecules (Chan et al., 1992). After hydrophobic residues exposed, ANS could bind to non-polar parts of proteins, S0-ANS increased and higher values of S0 indicated stronger hydrophobic interactions of myofibrillar protein gel. S0-ANS of myofibrillar protein gel increased continually with higher ionic strength above 0.2 and reached a maximum at ionic strength of 0.6 (Fig. 2). This might be due to metal ions had a shielding effect on the negative electric charge on the protein surface. In that case, mutual repulsions between proteins were weakened, which was beneficial for the exposure of hydrophobic groups. The surface hydrophobicity of chickpea protein isolates also had a similar trend with the increase of ionic strength (0.2 – 1.0) (Zhang et al., 2009), which had similar trend with our results. Kaewmanee et al. (2011) also reported that a higher concentration of NaCl had a positive effect on surface hydrophobicity.

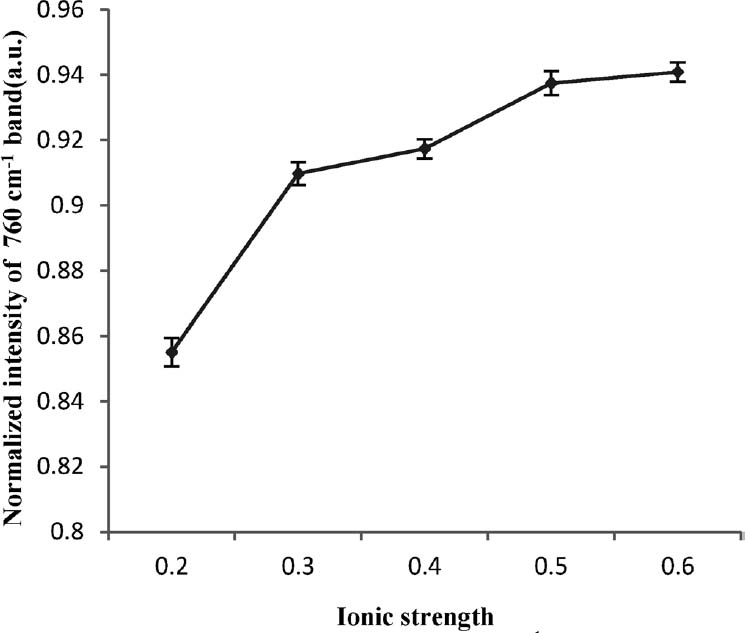
Stretching vibration of tryptophan indole ring Tryptophan (Trp) was a hydrophobic amino acid with hydrophobic residues. The normalized intensity of the Raman band near 760 cm−1 was assigned to the stretching vibration of the tryptophan residues ring and could be used to investigate the hydrophobicity of the Trp residues, and then reflect the hydrophobic interactions of protein gel (Ikeda and Li-Chan, 2004; Li-Chan, 1996; Tu, 1982; Xu et al., 2011). This band is known to be sensitive to the environment polarity of Trp residues: buried residues in hydrophobic environment exhibit a more intense band than residues exposed to a polar environment (Bellocq et al., 1972; Howell and Li-Chan, 1996; Ikeda and Li-Chan, 2004; Li-Chan, 1996; Tu, 1982).
The normalized intensity of the Raman band near 760 cm−1 increased from 0.855 to 0.941 as the ionic strength increased from 0.2 to 0.6 (Fig. 3), which indicated that more hydrophobic residues were buried in hydrophobic environment, and this might be resulted from that hydrophobic residues approached and formed aggregates. Higher ionic strength strengthened the hydrophobic interactions of MP gel.
Both the surface hydrophobicity (Fig. 2) and normalized intensity of the 760 cm−1 band of Raman spectra (Fig. 3) might indicate that the increase of ionic strength strengthened hydrophobic interactions of MP gel.
Tyrosine doublet bands The tyrosine doublet bands of 830 and 850 cm−1 were induced by Fermi resonance of ring-breathing vibrations and an overtone of out-of-plane ring-bending vibrations of the para-substituted benzene bands, the relative intensity reflects the nature of hydrogen bonding and the state of the phenolic hydroxyl groups in the tyrosine (Tyr) side chains (Li-Chan, 1996; Liu et al., 2011; Tu, 1982; Xu et al., 2011). The tyrosine doublet bands are particularly useful for monitoring the microenvironment around the tyrosine residue, and the degree to which the residue is buried (Howell and Li-Chan, 1996). A high ratio I850/830 of 0.9 – 2.5 indicates that the tyrosine residues were exposed to aqueous environment and able to participate in moderate or weak hydrogen bonding, while a low ratio indicated that tyrosine residues were buried in a hydrophobic environment and tended to act as hydrogen bond donors to strengthen hydrogen bonding (Badii and Howell, 2006; Li-Chan et al., 1994). As shown in Fig. 4, the normalized ratio of I850/I830 ranged from 0.97 to 1.03, suggesting that the tyrosine residues were mainly exposed and able to participate in moderate or weak hydrogen bonding.

The ratio of I850/I830 could be used to determine whether the hydroxyl groups on the phenyl ring are to generate hydrogen bonds with water molecules (exposed type) or to generate hydrogen bonds with other protein molecule residues (buried type). Whether tyrosine residues are buried type or exposed type can be calculated as follows: Nburied + Nexposed = 1, 0.5 Nburied + 1.25Nexposed = I850 / I830 (Tu, 1982). Where Nburied is the molar fraction of “buried” tyrosine residues, Nexposed is the molar fraction of exposed tyrosine residues.
As shown in Table 1, Nexposed increased and Nburied decreased significantly (p < 0.05) with the increase of ionic strength, which suggested that with the increase of ionic strength, more hydroxyl groups on the phenyl ring of tyrosine residues were exposed to the aqueous environment to generate hydrogen bonds with water molecules. At the same time, fewer hydroxyl groups on the phenyl ring of tyrosine residues trended to be buried in hydrophobic microenvironment to generate hydrogen bonds with protein molecules. In a word, with the increase of ionic strength, the protein-water hydrogen bonds increased, while protein-protein hydrogen bonds decreased, leading to the weakness of hydrogen bonding of MP gel.
Table 1.
I850/I830, molar fractions of exposed and buried tyrosine residues of myofibrillar protein gel at different ionic strength.
| Ionic strength |
I850/I830 |
Nexposed |
Nburied |
| 0.2 |
0.9722 ± 0.0012a |
0.6296 ± 0.0019a |
0.3704 ± 0.0019a |
| 0.3 |
0.9735 ± 0.0017a |
0.6313 ± 0.0026a |
0.3687 ± 0.0026a |
| 0.4 |
0.9976 ± 0.0024b |
0.6635 ± 0.0035b |
0.3365 ± 0.0035b |
| 0.5 |
1.0181 ± 0.0019c |
0.6908 ± 0.0024c |
0.3092 ± 0.0024c |
| 0.6 |
1.0297 ± 0.0022d |
0.7063 ± 0.0027d |
0.2937 ± 0.0027d |
Different letters in the same column mean significantly different (p < 0.05).
Zeta potential The zeta potential of MP gel with different ionic strength was shown in Fig. 5. Greenwood and Kendall (1999) and Hanaor et al. (2012) mentioned that colloids (such as proteins) with high zeta potential (negative or positive) are electrically stabilized while proteins with low zeta potential tend to coagulate or flocculate. Zeta potential increased with the increase of ionic strength. The highest negative electric charge was at ionic strength of 0.2. The decrease of absolute value of zeta potential indicated that higher ionic strength weakened the electrostatic interactions of MP gel, which was beneficial for the molecular interactions of proteins. These results suggested that ionic strength played an important role in modifying electric charge of protein, which might in turn affect the functional properties of myofibrillar protein. Li et al. (2009) found that the changes of zeta potential of soy protein aggregates formed at 1% protein concentration in aqueous solution at different ionic strength had a similar trend to our results.
Effects of ionic strength on functional properties of MP gel Effects of ionic strength on functional properties were presented in Table 2. Storage modulus (G′), hardness and water holding capacity (WHC) all increased significantly (p < 0.05) with the increase of ionic strength, which showed that higher ionic strength promoted functional properties of MP gel.
Table 2.
Changes in functional properties of myofibrillar protein gel at different ionic strength
| Ionic strength |
G′/Pa (65°C) |
Hardness/g |
WHC (%) |
| 0.2 |
26.8 ± 3.842a |
5.508 ± 0.519a |
20.706 ± 1.206a |
| 0.3 |
120.2 ± 5.226b |
13.178 ± 1.697b |
31.968 ± 1.565b |
| 0.4 |
160.6 ± 6.553c |
42.619 ± 2.216c |
40.517 ± 0.979c |
| 0.5 |
317.9 ± 10.857d |
53.191 ± 4.388d |
41.233 ± 1.061c |
| 0.6 |
326.5 ± 10.311d |
65.229 ± 5.237e |
47.985 ± 1.156d |
Different letters in the same column mean significantly different (p < 0.05).
The effects of ionic strength on G′ of myofibrillar protein were shown in Fig. 6. Changes of G′ with lower ionic strength had a different trend compared with samples with higher ionic strength. The G′ of MP with high ionic strength (0.4 – 0.6) increased significantly (p < 0.05) as the temperature increased from 40 to 50°C, and presented a peak at about 48°C, which could be ascribed to myosin denaturation (40 – 60°C) (Bertram et al., 2006). However, the peak for myosin denaturation did not appear at low ionic strength (0.2 – 0.3). This might be because the solubility of MP increased with the increase of ionic strength. Foegeding et al. (1996) reported that myofibrillar proteins could only be soluble in high ionic strength conditions (I ≥ 0.3). Myosin in low ionic strength conditions (0.2 mol/L KCl) existed in the form of filaments, while in high ionic strength conditions (0.6 mol/L KCl), myosin usually existed in a monomeric or dimeric form (Boyer et al., 1996). In high ionic strength solutions, protein swelled, unfolded and became flexible upon absorbing solvent. The swelling and unfolding of actomyosin in turn increased its effective volume, and shortened the distance between the protein molecules (Liu et al., 2008), which was beneficial for the crosslinking of protein during heat-induced gelation. Previous studies showed that higher ionic strength produced more elastic (higher G′) gels (Stone and Stanley, 1994; Bjorg et al, 1986), which was consistent with our results.

The hardness increased significantly as ionic strength increased from 0.2 to 0.6 (Table 2). Previous literatures had similar results. Samejima et al. (1981) reported that the rigidity of rabbit myosin gel increased with the increase of ionic strength from 0.2 to 0.6. Laure et al. (2014) also found the increase of brine salt content had a positive impact on breaking stress of heat-induced pork gels.
The WHC increased significantly from 20.7% to 48.0% as ionic strength increased from 0.2 to 0.6 (Table 2). Myosin with low ionic strength conditions (0.2 mol/L KCl) existed in the form of filaments, thus forming a fine-stranded network with big carves and poor porosity. Therefore, it's hard for gels to hold water molecules. With high ionic strength (0.6 mol/L KCl), myosin usually existed in a monomeric or dimeric form, after denaturation, myosin formed aggregated particles, cross-linking with each other to form a more uniform network structure with small pores and good porosity to hold more water molecules (Boyer et al., 1996; Samejima et al., 1986; Sharp and Offer, 1992).
Relationship between chemical forces and functional properties under different ionic strength The correlations of chemical forces and functional properties at different ionic strength were analyzed by SPSS software (SPSS Inc., Ver.19, Chicago, IL) (Table 3). The the changes in content of total SH groups, absolute value of zeta potential and molar fractions of buried tyrosine residues had significantly negative correlations with functional properties (G′, hardness and WHC). The decrease of total SH content contributed to the formation of disulfide bonds, which helped improve functional properties. The absolute value of zeta potential decreased, and electrostatic repulsion beween protein molecules were weakened, protein molecules were more likely to form aggregates, which helped improve gel functional properties. Molar fractions of buried tyrosine residues decreased and fewer phenolic hydroxyl groups of tyrosine residues trended to be buried in hydrophobic microenvironment to generate hydrogen bonds with protein molecules, which were unbeneficial for gel functional properties. However, the surface hydrophobicity, I760 and molar fractions of exposed tyrosine residues were significantly positive correlations with functional properties. The increase of surface hydrophobicity and I760 suggested that more exposed hydrophobic residues contributed to stronger hydrophobic interactions, which contributed to improve gel functional properties. More tyrosine residues exposed and fewer Tyr phenolic hydroxyl groups were buried in hydrophobic microenvironment to generate hydrogen bonds with protein molecules, which were unbeneficial for gel functional properties. As shown in Table 3, the content of reactive SH groups had no significant effects on functional properties, which indicated that reactive SH groups had no significant effects on gel functional properties. In conclusion, the increase of ionic strength contributed to more disulfide bonds, stronger hydrophobic interactions, weaker hydrogen bonds and electrostatic interactions. Stronger attractive forces and weaker repulsive forces contributed to better functional properties (higher G′, hardness and WHC).
Table 3.
The correlation analysis between chemical forces and functional properties of myofibrillar protein gel at different ionic strength.
| Variables a |
Hardness |
G′(65°C) |
WHC |
Total SH |
Reactive SH |
I760 |
I850/I830 |
Zeta potential |
Nburied |
Nexposed |
S0-ANS |
| Hardness |
1.000 |
|
|
|
|
|
|
|
|
|
|
| G′(65°C) |
.941ss |
1.000 |
|
|
|
|
|
|
|
|
|
| WHC |
.953ss |
.908ss |
1.000 |
|
|
|
|
|
|
|
|
| Total SH |
−.983ss |
−.891ss |
−.932ss |
1.000 |
|
|
|
|
|
|
|
| Reactive SH |
−.284ns |
−.358ns |
−.085ns |
.155ns |
1.000 |
|
|
|
|
|
|
| I760 |
.916ss |
.939ss |
.968ss |
−.853ss |
−.242ns |
1.000 |
|
|
|
|
|
| I850/I830 |
.981ss |
.945ss |
.903ss |
.−.943ss |
−.444ns |
.900ss |
1.000 |
|
|
|
|
| Zeta potential |
.787s |
.808s |
.918ss |
−.786s |
.220ns |
.883ss |
.696ns |
1.000 |
|
|
|
| Nburied |
−.984ss |
−.949ss |
−.905ss |
.946ss |
.445ns |
−.901ss |
−.997ss |
−.698ns |
1.000 |
|
|
| Nexposed |
.984ss |
.949ss. |
905ss |
−.946ss |
−.445ns |
.901ss |
.997ss |
.698ns |
−1.000ss |
1.000 |
|
| S0-ANS |
0.986ss |
.900ss |
.955ss |
−.997ss |
−.142ns |
.883ss |
.945ss |
.818s |
−.947ss |
.947ss |
1.000 |
a G′: storage modulus, WHC: water holding capacity, Total SH: total sulfhydryl group content, Reactive SH: reactive sulfhydryl group content, I760: normalized intensity of 760 cm
−1, I850/I830: normalized ratio I850/I830 doublet bands, Zeta potential: absolute value of zeta potential, Nburied: the molar fraction of buried tyrosine residues, Nexposed: the molar fraction of exposed tyrosine residues, S
0-ANS: surface hydrophobicity. Significance is noted as: p > 0.05, ns; p < 0.05, s; and p < 0.01, ss.
Conclusion
Higher ionic strength contributed to more disulfide bonds, stronger hydrophobic interactions, weaker hydrogen bonds and electrostatic interactions, attractive forces are strengthened and repulsive forces are weakened. Functional properties (G′, hardness and WHC) increased with higher ionic strength (p < 0.05). From statistical analysis, significant correlations were found between chemical forces and functional properties in MP gel. Disulfide bonds and hydrophobic interactions had significantly positive impact on functional properties, while hydrogen bonds and electrostatic interactions presented negative correlations with functional properties. As a conclusion, ionic strength significantly affected chemical forces, subsequently contributed to functional properties. The enhancement of MP functional properties at higher ionic strength was achieved by strengthening attractive forces and weakening repulsive forces.
Acknowledgments This work was supported by the National Natural Science Foundation of China (No. 31371798).
References
- Alix, A. J. P., Pedanou, G., and Berjot, M. (1988). Fast determination of the quantitative secondary structure of proteins by using some parameters of the Raman amide I band. J. Mol. Struct, 174, 159-164.
- Badii, F. and Howell, N. K. (2006). Fish gelatin: structure, gelling properties and interaction with egg albumen proteins. Food Hydrocolloids, 20, 630-640.
- Bellocq, A. M., Lord, R. C., and Mendelsohn, R. (1972). Laser-excited Raman spectroscopy of biomolecules III. Native bovine serum albumin and β-lactoglobulin. Biochim. Biophys. Acta, 257, 280-287.
- Bertram, H. C., Wu, Z., Berg, F. V. D., and Andersen, H. J. (2006). NMR relaxometry and differential scanning calorimetry during meat cooking. Meat. Sci., 74, 684-689.
- Bjorg, E., Kristen, F., and Kunihiko, S. (1986). Dynamic rheological measurements on heat-induced myosin gels: effect of ionic strength, protein concentration and addition of adenosine triphosphate or pyrophosphate. J. Sci. Food Agr., 37, 915-926.
- Boyer, C., Joandel, S., Ouali, A., and Culioli, J. (1996). Ionic strength effects on heat-induced gelation of myofibrils and myosin from fast and slow-twitch rabbit muscles. J. Food Sci., 61, 1143-1148.
- Cao, Y. Y., Xia, T. L., Zhou, G. H., and Xu, X. L. (2012). The mechanism of high pressure-induced gels of rabbit myosin. Innov. Food Sci. Emerg. Technol., 16, 41-46.
- Chan, J. K., Gill, T. A., and Paulson, A.T. (1992). The dynamics of thermal denaturation of fish myosins. Food. Res. Int., 25, 117-123.
- Ellman, G. D. (1959). Tissue sulfhydryl groups. Arch. Biochem. Biophys., 82, 70-77.
- Fennema, O. R. (2008). Amino Acids, Peptides, and Proteins, In Damodaran, S, Parkin, K. L., Fennema, O. R. (Ed.), Food Chemistry. New York: Taylor & Francis Group. pp. 268.
- Foegeding, E. A., Lanier, T. C., and Hultin, H. O. (1996). Characteristics of edible muscle tissue. In Fennema, O. R. (Ed.), Food chemistry. New York: Marcel Dekker, Inc. pp. 879-942.
- Fukazawa, T, Hashimoto, Y, and Yasui, T. (1961). Effect of some propeins on the binding quality of an experimental sausage. J. Food. Sci, 26, 541.
- Gornall, A. G., Bardawill, C. J., and David, M. M. (1949). Determination of serum proteins by means of the biuret reaction. J. Biol. Chem., 177
- Greenwood, R. and Kendall, K. (1999). Electroacoustic studies of moderately concentrated colloidal suspensions. J. Eur. Ceram. Soc., 19, 479-488.
- Hamada, M., Ishizaki, S., and Nagai, T. (1994). Variations of SH content and kamaboko-gel forming ability of shark muscle proteins by electrolysis. The Journal of Shimonoseki University of Fisheries, 42, 131-135.
- Hanaor, D.A.H., Michelazzi, M., Leonelli, C., and Sorrell, C.C. (2012). The effects of carboxylic acids on the aqueous dispersion and electrophoretic deposition of ZrO2. J. Eur. Ceram. Soc., 32, 235-244.
- Hayakawa S. and Nakai S. (1985). Contribution of hydrophobicity, net charge and sulfhydryl groups to thermal properties of ovalbumin. Can. I. Food Sci. Tech. J., 18, 290-295.
- Hermansson, A. M. (1979). Aggregation and denaturation involved in gel formation, In: Functionality and protein structure. A Poud Edited. Washington DC: American Chemical Society. pp. 82-103.
- Herrero, A. M. (2008). Raman spectroscopy for monitoring protein structure in muscle food systems. Crit. Rev. Food Sci., 48, 512-523.
- Herrero, A. M., Cambero, M. I., Ordonez, J. A., de la Hoz, L., and Carmona, P. (2008). Raman spectroscopy study of the structural effect of microbial transglutaminase on meat systems and its relationship with textural characteristics. Food Chem., 109, 25-32.
- Howell, N. and Li-Chan, E. (1996). Elucidation of interactions of lysozyme with whey proteins by Raman spectroscopy. Int. J. Food Sci. Tech., 31, 439-451.
- Ikeda, S. and Li-Chan, E. C. Y. (2004). Raman spectroscopy of heat-induced fine-stranded and particulate β-lactoglobulin gels. Food Hydrocolloids, 18, 489-498.
- Joseph, D., Lanier, T C, and Hamann D D. (1994) Temperature and pH affect transglutaminase-catalyzed “setting” of crude fish actomyosin. J. Food Sci., 59, 1018-1023.
- Kaewmanee, T., Benjakul, S., and Visessanguan, W. (2011). Effect of NaCl on thermal aggregation of egg white proteins from duck egg. Food Chem., 125, 706-712.
- Kocher, P. N. and Foegeding, E. A. (1993). Microcentrifuge-based method for measuring water-holding of protein gels. J. Food Sci., 58, 1040-1046.
- Laure, B., Philippe, G., Martine, C., and Alain, K. (2014). The effects of low salt concentrations on the mechanism of adhesion between two pieces of pork semimembranosus muscle following tumbling and cooking. Meat Sci., 96, 5-13.
- Li-Chan, E., Nakai, S., and Hirotsuka, M. (1994). Raman spectroscopy as a probe of protein structure in food systems. In Yada, R. Y., Jackman, R. L. and Smith, J. L. (Eds.), Protein Structure-Function Relationships in Foods. London: Blackie Academics and Professional. pp. 163-197.
- Li-Chan, E. C. Y. (1996). The applications of Raman spectroscopy in food science. Trends Food Sci. Tech., 7, 361-370.
- Liu, K. S. and Hsieh, F. H. (2007). Protein–Protein Interactions in High Moisture-Extruded Meat Analogs and Heat-Induced Soy Protein Gels. J. Am. Oil Chem. Soc., 84, 741-748.
- Liu, R., Zhao, S. M., Xie, B. J., and Xiong, S. B. (2011). Contribution of protein conformation and intermolecular bonds to fish and pork gelation properties. Food Hydrocolloids, 25, 898-906.
- Liu, R., Zhao, S. M., Xiong, S. B, Qiu, C. G, and Xie, B. J. (2008). Rheological properties of fish actomyosin and pork actomyosin solutions. J. Food Eng., 85, 173-179.
- Li, X. H., Cheng, Y. H., Yi, C. P., Hua, Y. F, Cheng, C., and Cui, S. (2009). Effect of ionic strength on the heat-induced soy protein aggregation and the phase separation of soy protein aggregate/dextran mixtures. Food Hydrocolloids, 23, 1015-1023.
- Macfarlane, J. J., Schmidt, G. R., and Turner, R. H. (1977). Binding of meat pieces: a comparsion of myosin,actomyosin and sarcoplasmic proteins as binding agents. J. Food Sci., 42, 1603-1606.
- Monahan, F. J., German, J. B., and Kinsella, J. E. (1995). Effect of pH and temperature on protein unfolding and thiol/disulfide interchange reactions during heat-induced gelation of whey proteins. J. Agr. Food Chem., 43, 46-52.
- Mulvihill, D. and Kinsella, J. E. (1987). Gelation characterization of whey proteins and β-lactoglobulins. Food Tech., 41, 102-111.
- Oakenfull, D., Pearce, J., and Burley, R. W. (1997). Protein gelation. In Damodaran, S. and Paraf, A. (Eds.), Food Proteins and their applications. New York: Marcel Dekker. pp. 111-142.
- Runkana, V., Somasundaran, P., and Kapur, P. C. (2004). Mathematical modeling of polymer induced flocculation by charge neutralization. J. Colloid Interface Sci., 270, 347-358.
- Wan, J., Kimura, I., Satake, M., and Seki, N. (1994). Effect of calcium ion concentration on the gelling properties and transglutaminase activity of walleye Pollack surimi paste. Fisheries Sci, 60, 107-113.
- Samejima, K., Ishioroshi, M., and Yasui, T. (1981). Relative molecule roles of the head and tail protions of the molecule in heat-induced gelation of myosin. J. Food Sci., 46, 1412-1418.
- Sharp, A. and Offer, G. (1992). The mechanism of formation of gels from myosin molecules. J. Sci. Food Agr., 58, 63-73.
- Shigeru, H. and Shuryo, N. (1985). Contribution of hydrophobicity, net charge and sulfhydryl groups to thermal properties of ovalbumin. Can. I. Food Sci. Technol. J., 18, 290-295.
- Siegel, D. C. and Schmidt, G. R. (1979). Ionic, pH and temperature effects on the binding ability of myosin. J. Food Sci., 44, 1686.
- Smyth, A. B., Smith, D. M., and Oneill, E. (1998). Disulfide bond influence the head-induced chicken breast muscle myosin. J. Food Sci., 63, 584-588.
- Stone, A. P. and Stanley, D.W. (1994). Muscle protein gelation at low ionic strength. Food Res. Int., 27, 155-163.
- Tu, A.T. (1982). Raman Spectroscopy in Biology Principles and Applications. New York: John Wiley and sons. pp. 65-96.
- Xiong, Y. L., Lou, X., Wang, C., Moody, W. G., and Harmon, R. J. (2000). Protein Extraction From Chicken Myofibrils Irrigated with Various Polyphosphate and NaCl Solutions. Food Chem. Toxicol, 65, 96-100.
- Xu, X. L. (2003). Study on heat-induced gelation properties and gel forming mechanism of myosin from rabbit skeletal muscles. Nanjing Agricultural University, pp. 78.
- Xu, X. L., Han, M. Y., Fei, Y., and Zhou, G. H. (2011). Raman spectroscopic study of heat-induced gelation of pork myofibrillar protein and its relationship with textural characteristic. Meat Sci., 87, 159-164.
- Yasui, T., Ishioroshi, M., Nakano, H., and Samejima, K. (1979). Changes in shear modulus, ultrastructure and spin-spin relaxation times of water association with heat-induced gelation of myosin. J. Food Sci., 44, 1201-1204.
- Yongsawatdigul, J. and Park, J.W. (2003). Thermal denaturation and aggregation of threadfin bream actomyosin. Food Chem., 83, 408-416.
- Zhang, T., Jiang, B., Mu, W.M., and Wang, Z. (2009). Emulsifying properties of chickpea protein isolates: Influence of pH and NaCl. Food Hydrocolloids, 23, 146-152.
- Zhang, Z., Yang, Y., Tang, X., Chen, Y., and You, Y. (2015). Chemical forces and water holding capacity study of heat-induced myofibrillar protein gel as affected by high pressure. Food Chem., 188, 111-118.