Original papers
Effect of Xanthan Gum on Blood Sugar Level after Cooked Rice Consumption
2016 年 22 巻 1 号 p. 117-126
詳細
2016 年 22 巻 1 号 p. 117-126
This study investigated how different combinations of xanthan gum and rice affect blood sugar levels after rice consumption. The addition of ≥1.0% xanthan gum during rice cooking (XGP-added groups) suppressed blood sugar levels 15 and 30 min after rice consumption. The glycemic index (GI) was significantly lower in all XGP-added groups than in the standard rice group. In all groups where xanthan gum sol was mixed with the cooked rice (XGS-mixed groups), blood sugar levels at 15 – 60 min were significantly lower and GI was lower than those in the standard rice group. Suppression of blood sugar levels by xanthan gum sol was more effective when consumed concurrently with rice than when consumed before or after consumption. The above findings revealed that blood sugar levels after rice consumption are suppressed most effectively when the rice is coated in xanthan gum sol.
According to the 2012 National Health and Nutrition Examination Survey (Ministry of Health and Welfare, 2014), 20.5 million Japanese people currently have or are believed to have diabetes, largely due to lifestyle diseases prevalent in modern society. Prolonged high blood sugar levels are known to cause vascular complications. Because diabetes is closely connected to eating habits and because calorie dense meals high in sugar or fat elevate blood sugar levels, diabetes has become a social challenge in Japan. Cooked rice is a staple food in Japan, and is one that is high in starch. Therefore, cooked rice is considered one of the foods that increase postprandial blood sugar levels. In recent years, the nutritional and physiological effects of dietary fiber ingestion have become widely known. These effects include enhanced digestive juice secretion and peristalsis, increased stool volume, shortened digestive tract time, and various effects on glucose and lipid metabolism (Takahashi, 2011; Juliet, 2006).
We have previously reported the inhibitory effect of agar added during rice cooking on blood sugar levels (Moritaka et al., 2012). Glucose response curves taken for 120 min after rice consumption revealed that the addition of agar slowed increases in blood sugar levels, and the maximum level was lower than that in the control group receiving no agar. In addition, the glycemic index (GI) decreased as the concentration of agar increased. We also previously reported that ≥1.0% glucomannan added during rice cooking significantly suppressed GI and the release of glucose (Fuwa et al., 2013).
Furthermore, our previous study showed that κ-carrageenan added at rice cooking effectively suppressed the elevation of blood sugar levels (Fuwa et al., 2014). When added to rice in a gel form and without CaCl2, κ-carrageenan suppressed the elevation of blood sugar levels similarly, but this suppression was not observed in the gel with CaCl2. The reason for suppressed blood sugar levels by the κ-carrageenan gel without CaCl2 was thought to be that because a portion of the gel was converted into a sol form in the oral cavity, the rice may be absorbed into the structure of the κ-carrageenan sol, thus potentially hindering the activity of digestive enzymes and decreasing glucose absorption.
Some studies have also reported on the relationship between blood sugar levels and other dietary fibers (Ebihara et al., 1981; Ebihara and Kiriyama, 1982; Jenkins et al., 1977; Mochizuki et al., 1995; Vuksan et al., 1999; Maeda et al., 2005; Dumelod et al., 1999). Some dietary fibers, such as xanthan gum, guar gum, and gum arabic, generate sol forms. Several studies have reported the suppression of blood sugar levels by xanthan gum in particular (Edwards et al., 1987; Cameron-Smith et al., 1994; Shiyi et al., 2001; Sagawa et al., 2013). Structurally, xanthan gum is comprised of a main chain and a side chain; the main chain consists of glucose-linked β-1,4 bonds, and the side chain is composed of one molecule of glucuronic acid and two molecules of mannose. One side chain is attached to every two molecules of glucose in the main chain. In this study, we investigated the effects of xanthan gum added during rice cooking (XGP-added rice) or xanthan gum sol mixed with cooked rice (XGS-mixed rice) on blood sugar levels after cooked rice consumption.
Materials The rice used in this study was Japonica ‘Koshiibuki’ rice (yield rate of polished rice, 89%; ratio of water to rice edible portion, 14.1%; ratio of protein to rice edible portion, 6.5%; ratio of amylose to starch, 19.4%; ratio of amylopectin to starch, 80.6%) cultivated in Niigata Prefecture, Japan. Xanthan gum (Lot. 130730-01; purity, 100%) was provided by San-Ei Gen F.F.I. (Osaka, Japan).
Standard rice was prepared by soaking 180 g of rice in 1.4-fold (by wt.) deionized water at room temperature for 1 h and then cooking and steaming in a rice cooker for 30 min (SR-CL05P; Panasonic, Osaka, Japan). Xanthan gum added during rice cooking (XGP-added rice) was prepared by adding xanthan gum to raw rice grains just before cooking and steaming. The concentrations of xanthan gum were 0.5, 1.0, 1.5, 2.0, and 2.5% of raw rice weight. The cooked rice ratio of increase was calculated by dividing the weight of cooked rice by the raw rice grain weight.
The concentration of xanthan gum sol was 2.0%. The sol form of xanthan gum was first produced by dispersing xanthan gum held in deionized water overnight at room temperature using a magnetic stirrer. Xanthan gum sol was then heated at 98°C for 60 min with stirring. To prepare xanthan gum sol mixed with cooked rice (XGS-mixed rice), the xanthan gum sol was mixed with standard cooked rice just prior to experiments. Concentrations of xanthan gum in XGS-mixed rice were the same as for the XGP-added rice.
Cooked rice samples for texture measurements and sensory evaluation were always taken from the center of the rice cooker.
Blood sugar levels Subjects were comprised of 11 healthy female students aged 19 – 39 years who had never been diagnosed with diabetes. Mean fasting blood sugar level of subjects was 78.3 ± 6.1 mg/dL, and all subjects were determined to be normal type based on the diagnostic criteria for diabetes. The measurement of blood sugar level and the sensory evaluation were approved by the Ethics Committee of Showa Women's University (Approval #13-12). In accordance with the principles of the Declaration of Helsinki, subjects were fully informed of the main purpose of the study, the safety of test samples, and how to measure blood sugar levels and perform sensory evaluation before written consent was obtained.
Test samples were the standard rice, 0.5, 1.0, and 1.5% XGP-added rice, and 0.5, 1.0, and 2.5% XGS-mixed rice. In this study, we used the rice grain rather than commercially available packaged rice recommended in the Unified Protocol for the Study of Glycemic Index by the Japanese Association for the Study of Glycemic Index (Tanaka et al., 2011). The rice heated by a rice cooker was employed as a common sample in this experiment, because a rice heated with xanthan gum was needed as a test sample. In all experiments, the total weight of carbohydrate included in each test sample was 50 g. The total weight of the test sample and water was 250 g. In the test using XGS-mixed rice, the weight of the provided drinking water was determined by subtracting the weight of water used in the sol preparation.
Blood sugar levels were measured after more than 3 days from the previous measurement, but not during menstruation. Subjects were instructed not to engage in strenuous exercise on the day before an experiment. Only cold or warm water was allowed from 12 to 4 h before an experiment. Intake of all food and drink was prohibited from 4 h before an experiment. Test samples were consumed within 10 min, and subjects consumed rice and water alternately. One bite-size portion was approximately 10 g, which was chewed 30 times. After consumption of test samples, subjects rested until the completion of the 120-min blood sugar level measurement. In addition, to investigate how different timings of XGS consumption affect blood sugar levels, the xanthan gum sol was consumed 10 min earlier than the consumption of the standard rice (XGS-before rice), concurrently with the standard rice (XGS-mixed rice), or 10 min later than consumption of the standard rice (XGS-after rice).
Using a small blood sugar level measurement device (Glu-Test-Ace-R; Sanwa Kagaku Kenkyusho Co., Nagoya, Japan), subjects measured blood sugar levels before (0 min) and 15, 30, 45, 60, 90, and 120 min after the consumption of the test sample. A finger-prick blood sampling was performed using the Auto-Lancet-II (Sanwa Kagaku Kenkyusho Co.). Puncture needle devices were prepared for each individual subject.
According to the method recommended by the Food and Agriculture Organization of the United Nations and the World Health Organization, the glycemic index (GI) of each test sample containing 50 g of carbohydrate was calculated by dividing the area under the blood sugar response curve by the area under the response curve (set as 100) to 50 g/250 mL glucose solution.
Measurement for the standard rice was performed once per subject, and the validity of the data was verified by comparing the pattern of blood sugar response curve to patterns obtained previously in our laboratory or other laboratories on our campus.
Glucose release of in-vitro digestion experiments Mastication and digestion were reproduced in vitro according to the methods reported by Kumai et al. (2007) and Nakanishi (2011). A meat grinder with a disc having 6-mm holes (MUM4435JP; BOSCH, Germany) was used to simulate the mastication of the standard rice, XGP-added rice, and XGS-mixed rice. Before measurement, pancreatin and invertase were added to rice samples and shaken for 20 min at 37°C.
Textural properties Examination of textural properties was performed as reported previously using a rheometer (RE-33005; Yamaden Co., Tokyo, Japan) with a 20-mm acrylic cylindrical plunger. One grain of rice was placed on the sample plate at 25°C and compressed twice by the plunger at a speed of 0.5 mm/s. Each sample was compressed to 80% of its height, after which the plunger then rose 5 mm higher than the surface of the sample and the second compression was performed.
Using the accompanying automatic texture profiling software (Ver.2.0A; Yamaden Co.), texture curves were analyzed to evaluate the hardness and adhesiveness of samples. Hardness was determined by dividing the first peak of the texture curve by the contact area of the rice and plunger.
Before compression, the flat surface of a rice grain was placed parallel to the sample plate, with the germ facing the right or left side, and the maximum horizontal plane passing through the dorsal and ventral side of the rice was used as a contact area. In each group, measurement was repeated 30 times and the mean contact area was calculated. Because the contact area of rice and plunger changes depending on compression force, hardness in this study was expressed as conventional stress rather than true stress. In order to prevent movement of the rice grains, rice grain was solid with double-sided tape on the sample plate. Adhesiveness was calculated using the peak area under the baseline that appeared after the first peak on the texture curve. In each sample group, measurement was repeated 30 times.
Morphological evaluation of rice grains The lengths of the long and short axes were determined in the standard rice and in the 0.5, 1.0, and 1.5% XGP-added rice. The condition of the rice immediately after cooking was photographed.
Sensory evaluation Based on the Guidelines for Taste Testing issued by the Food Agency, sensory evaluation was performed by 13 female students with normal vision, taste and flavor sensing abilities.
The appearance, flavor, taste, glutinousness, hardness, and overall quality of 0.5, 1.0, 1.5, and 2.0% XGP-added rice were compared with those of standard rice according to the sensory evaluation method recommended by the Japan Grain Inspection Association (Kawabata et al., 2009), which evaluates cooked rice according to a seven-point interval scale. Appearance, taste, and overall quality were expressed in terms of high-to-low, flavor and glutinousness in terms of strong-to-weak, and hardness in terms of hard-to-soft. “Rather (±3)” was selected when the difference was clear after the first bite. “A little (±2)” or “barely (±1)” was selected when the difference was somehow clear after the first bite or only after the second bite, respectively. “The same (0)” was selected when no difference was observed even after the second bite.
Statistical analysis Statistical analysis was performed using SPSS Statistics 21 (IBM, Tokyo, Japan). Blood sugar level, GI, and released glucose were analyzed using a two-way analysis of variance and Tukey's multiple comparison test. Texture profiles and sensory evaluation data were analyzed using a one-way analysis of variance followed by Tukey's test. In all analyses, statistical significance was set at 5% (p < 0.05).
Blood sugar level, GI, and released glucose of XGP-added rice Figure 1a shows blood sugar levels in subjects who consumed standard rice or XGP-added rice. In subjects who consumed standard rice, the 15-min postprandial blood sugar level was increased significantly compared with the 0-min pre-prandial level, and the increase was even more significant at 30 min. Although no significant difference in blood sugar levels was observed between 30 and 45 min or between 45 and 60 min, the 60-min postprandial blood sugar level was significantly lower than the 30-min level. The 90-min postprandial blood sugar level was decreased significantly compared with the 60-min postprandial level; however, the 120-min postprandial blood sugar level was still significantly higher than the 0-min pre-prandial level.

Blood sugar response curve and glycemic index after consuming XGP-added rice, and concentration of released glucose from XGP-added rice.
a) Blood sugar response curve after consuming XGP-added rice.
○, Cooked rice alone (0% XGP); △, 0.5% XGP-added rice; □, 1.0% XGP-added rice; ◊, 1.5% XGP-added rice
n = 11.
0% XGP: (0 min < 15, 30, 45, 60, 90 and 120 min), (15 min < 30 min), (15 min > 90 and 120 min), (30 min > 60, 90 and 120 min), (45 and 60 min > 90 and 120 min)
0.5% XGP-added rice: (0 min < 15, 30, 45, 60 and 90 min), (15, 45 and 60 min > 120 min), (30 min > 90 and 120 min)
1.0% XGP-added rice: (0 min < 15, 30, 45, 60, 90 and 120 min), (30, 45 and 60 min > 120 min)
1.5% XGP-added rice: (0 min < 30, 45, 60, 90 and 120 min)
15, 30 min: (0% XGP > 1.0, 1.5% XGP-added rice), (0.5% XGP-added rice > 1.5% XGP-added rice)
45 min: (0, 0.5% XGP-added rice > 1.5% XGP-added rice)
b) Glycemic index after consuming XGP-added rice.
n = 11.
c) Concentration of released glucose from XGP-added rice.
Each value represents the mean ± SD.
Means indicated by different letters are significant at p < 0.05.
In subjects who consumed 0.5% or 1.0% XGP-added rice, the 15-min postprandial blood sugar level was increased significantly compared with the 0-min pre-prandial level. However, no significant difference was observed between the 15 – 60-min blood sugar levels in the 0.5% XGP-added group and between the 15 – 90-min levels in the 1.0% XGP-added group. In the 0.5% XGP-added group, the 90-min postprandial level was significantly lower than the 30-min level, whereas the 120-min level was significantly lower than the 15 – 60-min levels, with no significant difference from the 0-min pre-prandial level. In the 1.0% XGP-added group, the 120-min postprandial level was significantly lower than the 60-min level, but significantly higher than the 0-min pre-prandial level. In the 1.5% XGP-added group, compared with the 0-min pre-prandial level, the 30-min postprandial blood sugar level increased significantly, with no significant change after 30 min. Nevertheless, the 120-min level was significantly higher than the 0-min pre-prandial level.
In subjects who consumed ≥1.0% XGP-added rice, the 15- and 30-min postprandial blood sugar levels were significantly lower than those in the standard rice group. In addition, in the 1.5% XGP-added group, the 45-min level was significantly lower than that in the standard group, with no significant difference in the 60-min or later levels between the two groups.
Figure 1b shows GI in subjects who consumed XGP-added rice. Compared with the standard group, GI was significantly lower in all XGP-added groups, with no significant difference due to the concentration of xanthan gum. The amount of released glucose was significantly lower in the 0.5 – 2.5% XGP-added groups than the standard group (Fig. 1c).
Textural properties of XGP-added rice The hardness and adhesiveness of XGP-added rice are shown in Figure 2. While 0.5% XGP-added rice was significantly harder than the standard rice, hardness did not differ significantly between the standard rice and 1.0% XGP-added rice. Interestingly, the hardness of ≥1.5% XGP-added rice was significantly reduced in a concentration-dependent manner (Fig. 2a). Adhesiveness was significantly higher in 0.5% XGP-added rice than in the standard rice, whereas no difference was observed between the standard rice and 1.0% or 1.5% XGP-added rice. Adhesiveness was significantly lower in 2.5% XGP-added rice (Fig. 2b).

Textural properties of XGP-added rice.
a) Hardness, b) Adhesiveness
Each value represents the mean ± SD.
Means indicated by different letters are significant at p < 0.05.
Structural organization of XGP-added rice Figure 3 shows the length of the long and short axes in XGP-added rice. In the standard group, the length increased along the long axis during cooking. In comparison, increase in the length along the long axis was significantly suppressed in all XGP-added groups, and there was a significant increase in length along the short axis in ≥1.0% XGP-added groups compared with the standard group.

Lengths of long and short axes of XGP-added rice grain.
□, Long axis; ■, Short axis
Each value represents the mean ± SD.
Means indicated by different letters are significant at p < 0.05.
The condition of rice immediately after cooking is shown in Figure 4. The standard rice grains showed low adhesion to each other and were easily separated (Fig. 4a). However, it became difficult to separate the rice as the concentration of xanthan gum increased (Fig. 4c, d). In the XGP-added groups, rice was coated with a thin layer of xanthan gum, and as the concentration of xanthan gum increased, many thread- or cotton-shaped xanthan gum filaments were observed between the rice grains and the thin coating of xanthan gum.

Images of XGP-added rice.
Concentration of xanthan gum: a) 0%, b) 0.5%, c) 1.0%, and d) 1.5%
Weight change after cooking of XGP-added rice Table 1 shows the weight change of rice after cooking. After cooking, the weight of rice increased significantly in all XGP-added groups compared with the standard group. Compared with the 0.5% XGP-added group, the 1.0% XGP-added group showed a significant increase in weight; however, there was no significant difference between the 1.0% and 1.5% XGP-added groups.
| Sample | Weight ratio (%) |
|---|---|
| 0% cooked rice | 217 ±0.7 a |
| 0.5% rice cooked with xanthan gum | 222 ±0.6 b |
| 1.0% rice cooked with xanthan gum | 234 ±0.6 c |
| 1.5% rice cooked with xanthan gum | 235 ±0.5 c |
Each value represents the mean ± SD.
Means indicated by different letters are significant at p < 0.05.
Sensory evaluation of XGP-added rice Figure 5 shows the sensory evaluation of XGP-added rice. The appearance of the 0.5% and 1.0% XGP-added rice declined in a concentration-dependent manner (Fig. 5a), but no significant difference was observed between the ≥1.0% XGP-added groups. The flavor of rice was significantly weaker in the ≥1.5% XGP-added groups, with no significant difference between the 1.0% – 2.0% XGP-added groups (Fig. 5b). When comparisons were made between the standard and 0.5% XGP-added groups, between the 0.5% and 1.0% XGP-added groups, and between the 1.0% and 2.0% XGP-added groups, taste was determined to be significantly lower as the concentration of xanthan gum increased (Fig. 5c).

Sensory evaluation of XGP-added rice.
a) Appearance, b) Flavor, c) Taste, d) Glutinousness, e) Hardness, f) Overall quality
n = 11.
Each value represents the mean ± SD.
Means indicated by different letters are significant at p < 0.05.
Compared with the standard group, glutinousness was significantly weaker in the ≥1.5% XGP-added groups, with no significant difference among the 0.5% – 2.0% XGP-added groups (Fig. 5d). Hardness did not differ significantly between the standard group and any of the XGP-added groups (Fig. 5e). Overall quality was significantly worse in the 0.5% XGP-added group than in the standard group, and the quality declined in a concentration-dependent manner in the 1.0% and 1.5% XGP-added groups, with no difference between the 1.5% and 2.0% XGP-added groups (Fig. 5f).
Blood sugar level, GI, and released glucose of XGS-mixed rice Figure 6a shows the blood sugar levels of subjects who consumed XGS-mixed rice. In the 0.5% and 1.0% XGS-mixed groups, postprandial blood sugar levels were significantly higher at 15 min than at 0 min, with no significant difference between the 15 – 90-min levels. This result differed from that of the standard group, in which the 30-min postprandial level was significantly higher than the 15-min level. In the 0.5% XGS-mixed group, the 120-min postprandial level was significantly lower than the 30-min level, but not the 0-min level. In the 1.0% XGS-mixed group, the 120- min postprandial level was significantly lower than the 30- and 45- min levels, with no significant difference between the 60-min postprandial and 0-min pre-prandial levels. In the 2.5% XGS-mixed group, although the 30-min postprandial level increased significantly, there was no significant change between the 0-min pre-prandial and 15-min postprandial levels or among the 30 – 60-min postprandial levels. The 120-min postprandial level did not differ significantly from the 0-min pre-prandial level. Compared with the standard group, the 15 – 60-min postprandial blood sugar levels were reduced in all XGS-mixed groups, with no significant differences among the groups.

Blood sugar response curve and glycemic index after consuming XGS-mixed rice, and concentration of released glucose from XGS-mixed rice.
a) Blood sugar response curve after consuming XGS-mixed rice.
○, Cooked rice alone (0% XGS); △, 0.5% XGS-mixed rice; □, 1.0% XGS-mixed rice; ◊, 2.5% XGS-mixed rice
n = 11.
0% XGS: (0 min < 15, 30, 45, 60, 90 and 120 min), (15 min < 30 min), (15 min > 90 and 120 min), (30 min > 60, 90 and 120 min), (45 and 60 min > 90 and 120 min)
0.5% XGS-mixed rice: (0 min < 15, 30, 45 and 60 min), (30 min > 120 min)
1.0% XGS-mixed rice: (0 min < 15, 30, 45, 60 and 90 min), (30 and 45 min > 120 min)
2.5% XGS-mixed rice: (0 min < 30, 45 and 60 min)
15, 30, 45 and 60 min: (0% XGS > 0.5, 1.0 and 2.5% XGS-mixed rice)
b) Glycemic index after consuming XGS-mixed rice.
n = 11.
c) Concentration of released glucose from XGS-mixed rice.
Each value represents the mean ± SD.
Means indicated by different letters are significant at p < 0.05.
In all XGS-mixed groups, GI was significantly lower than that in the standard group in a concentration-independent manner (Fig. 6b).
The amount of released glucose due to in vitro digestion of the standard rice and XGS-mixed rice is shown in Figure 6c. Compared with the standard group, the amount of released glucose was significantly reduced in the 0.5% XGS-mixed group, and the reduction was significantly greater in the 1.0% XGS-mixed group, with no significant difference among 1.0% – 2.5% XGS-mixed groups.
Changes in blood sugar level due to the consumption of xanthan gum in the sol state Based on the results of the previous section, in which xanthan gum consumed concurrently with rice suppressed postprandial blood sugar levels, we investigated the suppression of postprandial blood sugar level by the sol form of xanthan gum consumed before or after rice intake.
Figure 7a shows blood sugar levels in the XGS-before and -after groups as well as in the standard and XGS-mixed groups as a reference. Compared with the standard group, the 15-min postprandial blood sugar levels were significantly lower in the XGS-mixed and XGS-before groups. The 30-min postprandial level was significantly lower in the XGS-mixed group, but not in the XGS-before or -after groups. The 45- and 60-min postprandial blood sugar levels in the XGS-mixed group were significantly lower than those in the standard. The 90-min postprandial blood sugar levels did not differ significantly among the groups.
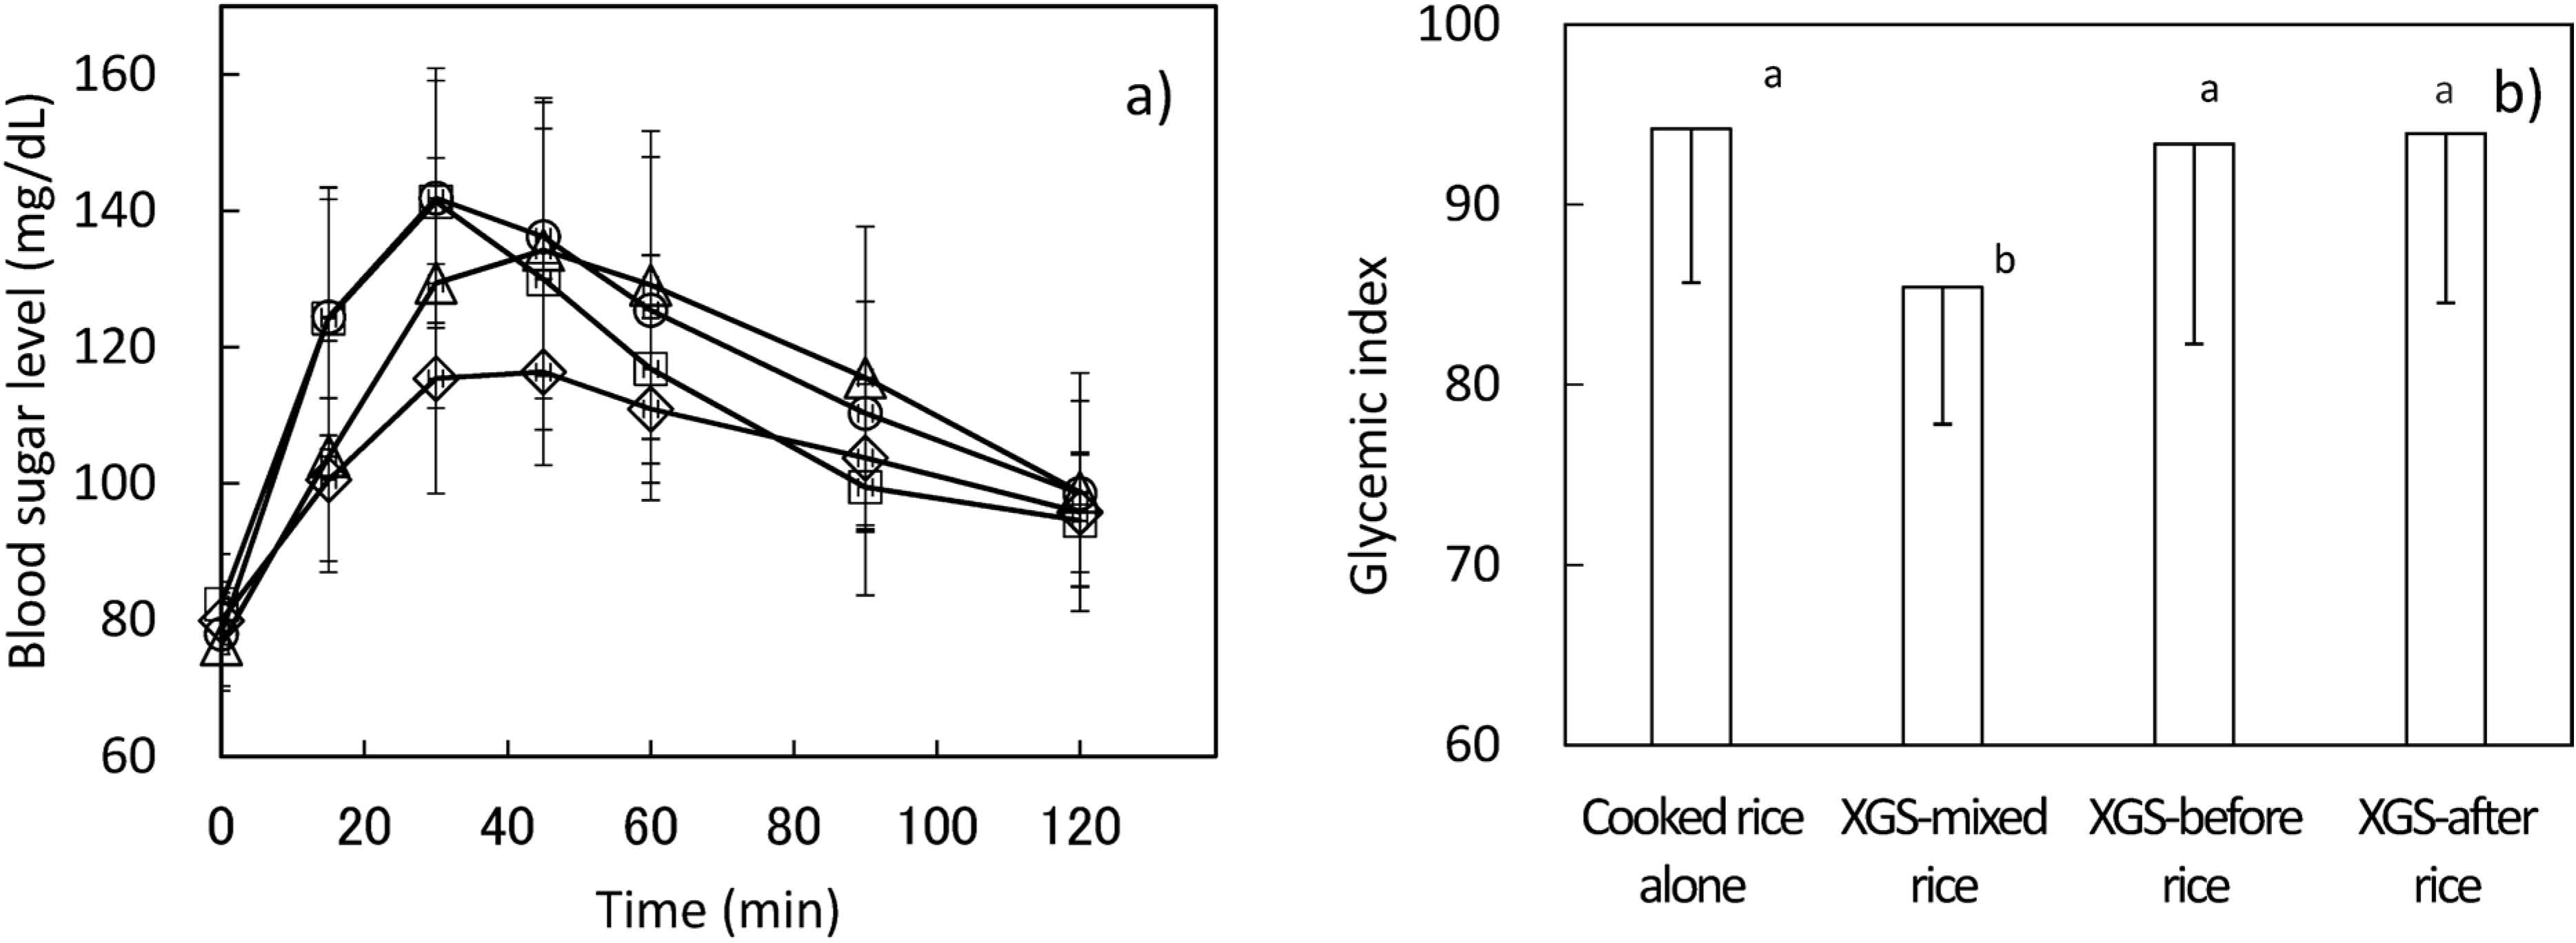
Blood sugar response curve and glycemic index after consuming XGS-mixed rice, XGS-before rice and XGS-after rice.
a) Blood sugar response curve after consuming XGS-mixed rice, XGS-before rice and XGS-after rice.
○, Cooked rice alone (0% XGS); △, XGS-before rice; □, XGS-after rice; ◊, XGS-mixed rice
n=11.
0% XGS: (0 min < 15, 30, 45, 60, 90 and 120 min), (15 min < 30 min), (15 min > 90 and 120 min), (30 min > 60, 90 and 120 min), (45 and 60 min > 90 and 120 min)
XGS-before rice: (0 min < 15, 30, 45, 60, 90 and 120 min), (15 min < 30, 45 and 60 min), (30 min > 120 min), (45 min > 90 and 120 min), (60 min > 120 min)
XGS-after rice: (0 min < 15, 30, 45, 60 min), (15 min > 90 and 120 min), (30 min > 60, 90 and 120 min), (45 min > 90 and 120 min), (60 min > 120 min)
XGS-mixed rice: (0 min < 15, 30, 45, 60 and 90 min), (30 and 45 min > 120 min)
15 min: (0% XGS, XGS-after rice > XGS-mixed rice, XGS-before rice)
30 min: (0% XGS, XGS-after rice > XGS-mixed rice)
45 and 60 min: (0% XGS, XGS-before rice > XGS-mixed rice)
b) Glycemic index after consuming XGS-mixed rice, XGS-before rice and XGS-after rice
n = 11.
Each value represents the mean ± SD.
Means indicated by different letters are significant at p < 0.05.
GI in the XGS-before and -after groups is shown in Figure 7b. GI in the standard and XGS-mixed groups are also shown as a reference. Compared with the standard group, GI was significantly lower in the XGS-mixed group but not in the XGS-before or -after groups.
This study investigated how postprandial blood sugar levels after consumption of rice are affected by simultaneous consumption of a specific form of xanthan gum and by the timing of the consumption of xanthan gum sol.
The addition of ≥1.0% xanthan gum to rice significantly reduced postprandial blood sugar levels at 15 and 30 min. The level was still significantly low at 45 min in subjects who had consumed 1.5% XGP-added rice (Fig. 1a). In addition, GI and the amount of released glucose were significantly reduced in all XGP-added groups compared with the standard group (Fig. 1b, c). Thus, all experiments verified that xanthan gum suppresses postprandial blood sugar levels. The length of the long axis was significantly shorter (≥0.5%) in XGP-added rice than in the standard rice (Fig. 3). This suggests that the addition of xanthan gum during rice cooking suppressed the absorption of water to rice during cooking, reducing the gelatinization of rice.
Although 0.5% XGP-added rice was significantly harder than the standard rice, no significant difference was observed between the standard rice and 1.0% XGP-added rice. In contrast, ≥1.5% XGP-added rice was significantly softer than the standard rice in a concentration-dependent manner (Fig. 2a). In subjective assessment, hardness did not differ significantly between the standard rice and XGP-added rice, regardless of the concentration of xanthan gum (Fig. 5e). However, the rice grain in the XGP-added rice was surrounded by the xanthan gum (Fig. 4), and the length of the short axis increased (Fig. 3). Although xanthan gum appeared to suppress the gelatinization of rice more strongly at higher concentrations, it concurrently increased the amount of the sol that adhered to the rice (Figs. 3, 4). Therefore, the hardness of rice reflects the physical property of not only the rice, but also the sol-state xanthan gum. Furthermore, as the concentration of xanthan gum increases, the contribution of XGS on the textural hardness of rice increases. We presume that the changes in rice hardness due to the addition of xanthan gum effectively cancelled each other out, indicated by the lack of significance in the 1.0% XGP-added rice group. When the concentration of xanthan gum exceeds 1.0%, it appears that the contribution of the sol form of xanthan gum to hardness overcomes the hardness due to the suppression of gelatinization, making rice softer. Therefore, we propose that changes in hardness do not contradict the suppression of rice gelatinization by xanthan gum (Fig. 2a).
Compared with the standard rice, adhesiveness increased in 0.5%, but not 1.0% or 1.5% XGP-added rice, whereas adhesiveness significantly decreased in 2.0% and 2.5% XGP-added rice (Fig. 2b). These changes were thought to be attributable to the sol form of xanthan gum adhering to the surface of the rice. Immediately after cooking, rice grains became increasingly difficult to separate as the concentration of xanthan gum increased. Moreover, they were surrounded by a thin coating of xanthan gum, with many thread- or cotton-like xanthan gum filaments between the rice grains (Fig. 4). This is presumably because xanthan gum absorbs rice into the sol structure during cooking. However, adhesiveness was measured using individual rice grains with broken sol structure. Furthermore, the addition of xanthan gum resulted in a significant increase in the weight of cooked rice (Table 1). Although not shown in the figure, the apparent viscosity of xanthan gum sol was significantly higher than that of water at a high temperature, indicating that the flow of water during cooking was hampered, reducing the evaporation of water and increasing the weight of rice during cooking. This is also inferred to be one of the reasons for the reduced adhesion of rice grains.
An increase in the amount of xanthan gum sol adhering to the rice surface and the suppression of gelatinization are thought to be the reasons for the poor subjective assessment of appearance, flavor, taste, and overall quality of rice containing xanthan gum in sensory evaluation. Our previous studies suggest that the addition of glucomannan (Fuwa et al., 2013) or κ-carrageenan (Fuwa et al., 2014) in rice cooking suppresses postprandial blood sugar levels mainly through the suppression of gelatinization rather than through the adhesion of the water-soluble dietary fibers to rice. However, in the XGP-added rice, the length of the short axis increased (Fig. 3), and the addition of xanthan gum resulted in a significant increase in the weight of the cooked rice (Table 1). Figure 4 illustrates that the cooked rice was surrounded by a thin coating of xanthan gum. These results suggest that xanthan gum adhered to the exterior of the rice grains. Therefore, when xanthan gum was added during rice cooking, the postprandial blood sugar level was thought to be suppressed due to the adhesion of xanthan gum, in addition to the suppression of gelatinization.
In subjects who had consumed XGS-mixed rice, the 15 – 60-min postprandial blood sugar levels were lower compared to the standard, and the rate of blood sugar elevation was reduced compared with XGP-added rice (Fig. 6a). In addition, no significant difference was observed between the 120-min postprandial and 0-min pre-prandial levels in the XGS-mixed groups. In contrast, the 120-min postprandial level was significantly higher than the 0-min pre-prandial level in the standard group, demonstrating different results and suggesting that the coexistence of the sol form facilitates decreases in the blood sugar level. Compared with the standard group, postprandial blood sugar levels were reduced in all XGS-mixed groups. Furthermore, compared with the standard group, GI was significantly lower in all XGS-mixed groups (Fig. 6b), and the amount of released glucose was significantly lower in the ≥0.5% XGS-mixed groups (Fig. 6c). The amount of xanthan gum and rice intake was the same between experiments where xanthan gum was added during rice cooking and those where xanthan gum in the sol state was consumed with rice. However, xanthan gum suppressed blood sugar levels after the consumption of rice differently, demonstrating that xanthan gum in the sol form suppresses postprandial blood sugar levels more effectively when consumed concurrently with rice. This supports our previous study investigating the effect of κ-carrageenan gel consumed concurrently with rice, showing that the blood sugar level was suppressed more effectively when the gel was partly converted into the sol form (Fuwa et al., 2014). Sasaki and Kohyama (2011, 2012) investigated the effect of water-soluble polysaccharide polymers on starch digestion. They reported that xanthan gum with high apparent viscosity greatly suppresses not only the dispersion of glucose, but also the digestion of glucose. Furthermore, Fabek et al. (2014) reported in their study using a digestive tract model that the sol structure of xanthan gum is maintained in the presence of digestive enzymes and under an acidic digestive environment. These properties of xanthan gum appear to be one reason for the regulation of blood sugar response to the consumption of glucose. On the other hand, for XGS-mixed rice, the concentration dependence of xanthan gum was not observed in the suppression of postprandial blood sugar levels (Fig. 6a, b). One possible explanation might be that a sufficient amount of xanthan gum is available to fully surround the rice grains, even at a xanthan gum concentration of 0.5% in the XGS-mixed rice. For this reason, even if the concentration of xanthan gum increases, the suppression of blood sugar level may not increase.
We also investigated whether the sol form of xanthan gum affects blood sugar levels similarly between XGS consumed concurrently with rice and XGS consumed before or after rice. Compared with the standard group, the 15-min postprandial blood sugar levels were significantly reduced in subjects who had consumed the sol form of xanthan gum before rice. Such a reduction was not observed at other time points in the XGS-before group or any time point in the XGS-after group (Fig. 7a). No significant difference in GI was observed between the standard group and the XGS-before or -after groups (Fig. 7b), suggesting that to effectively suppress blood sugar levels after the consumption of rice, it is necessary to consume the sol form of xanthan gum concurrently with rice. Based on these findings, to suppress blood sugar levels, it is very important to disperse and coat the rice with xanthan gum sol.
Acknowledgment This study was supported by funded of Showa Women's University.