Notes
Improvement of Bread Making Properties by the Addition of Alginates
2016 Volume 22 Issue 1 Pages 145-151
Details
2016 Volume 22 Issue 1 Pages 145-151
The addition of propylene glycol ester of alginic acid (PGA) or sodium alginate to wheat flour improved bread making properties such as bread height (mm) and specific volume (cm3/g). When PGA or sodium alginate/wheat flour and control bread dough were baked at 210°C for 10 min, the temperature of the dough (70 – 80°C) inactivates the yeast and thus gas production is stopped. However, the oven spring of PGA or sodium alginate/wheat flour bread dough continued for 30 min. The shrinkage of PGA or sodium alginate/wheat flour bread dough at 5 min of baking gradually decreased to zero at 30 min of baking; however, the shrinkage of the control decreased to almost zero at 15 min of baking. The larger addition of water in PGA or sodium alginate/wheat flour dough than in the control dough resulted in a longer time of gelatinization and protein denaturation than in the control dough during oven baking.
Large quantities of seaweed (Phaeophyceae or brown algae) are collected from cold-current oceans and used as food and drugs, and in textile printing, animal feed, pharmaceuticals, and cosmetics. In particular, alginate from seaweed has been used as an additive in the bread industry. Commercial algin is a salt of alginic acid (composed of poly-guluronic acid) combined with minerals, and shows dietary properties (Whistler and BeMiller, 1997). Rosell et al. (2001a) showed that alginate had a pronounced effect on dough properties, resulting in strengthened dough. Davidou et al. (1996) studied the influence of alginate on starch retrogradation by analyzing the possible interactions between hydrocolloids and starch or gluten. Rosell et al. (2001b) showed that the addition of sodium alginate improved wheat dough stability during proofing. The reasons why alginates are effective in bread making are currently unknown; thus, in order to expand seaweed usage in the future, it is necessary to determine the mechanism by which alginates function in bread making. In this study, bread making tests were performed with various kinds of alginic acid-related materials (alginic acid, alginates, and PGA), and enhanced bread making properties were obtained using PGA and sodium alginate. PGA and sodium alginate are generally used as bakery materials, however the detailed mechanism of their improving effects on bread is unknown. Therefore, bread dough temperature, gas production by yeast, baking absorption, exuded liquid, oven spring, and shrinkage of bread dough were examined in PGA or sodium alginate/wheat flour dough, and the mechanism by which PGA and sodium alginate affect bread making properties was investigated.
Wheat flour, alginates, and reagents Wheat flour (Camellia; Nisshin Flour Milling, Inc., Tokyo, Japan) was used in the experiment. Protein conversion was performed using the formula N×5.7 (Approved Method 46-10; AACC International 2000). Ash was determined by the AACC International method (08-01; 2000) at 14.0% (w/w). The protein and ash contents of Camellia wheat flour were 13.6 and 0.40% (w/w), respectively. Alginate samples such as free alginic acid, sodium alginate, calcium alginate, ammonium alginate, potassium alginate, and PGA were donated by KIMICA Corporation, Tokyo, Japan.
Brabender farinograph and bread making tests Alginate samples were mixed with wheat flour at concentrations of 0.5 – 3.0% (w/w). Baking absorption of each mixed flour sample of 300 g was determined in a farinograph (AACC Intl. 2000 (method 54-21)). Bread making was performed according to the method of Seguchi et al. (1997). Flour (290 g), compressed yeast (8.7 g), sugar (14.5 g), salt (2.9 g), and water (estimated from a farinograph at 500 BU) were mixed in a computer-controlled National Automatic Bread Maker (SD-BT6; Panasonic Corp., Osaka, Japan) with the 1st proof of 2 h 20 min at 30°C. The timing was 15 min for the 1st mixing, 50 min to allow the mixture to rest, 5 min for the 2nd mixing, and 70 min for fermentation. Mixing conditions (time and temperature) were carefully computer-controlled in the bread maker. The bread dough was then removed from the bread maker and divided into 120-g pieces, rounded, molded, and placed in baking pans (AACC Intl. 2000 (method 10-10B)). The bread dough was further proofed for 22 min at 38°C, and then baked at 210°C for 30 min in a model DN-63 deck-style oven (Yamato Scientific Co., Ltd., Tokyo, Japan). After baking, the bread was removed from the pan and cooled for 1 h at room temperature of 26°C and relative humidity of 43%. Bread height (mm), weight (g), and volume (cm3) were measured, and the crumb (porous structures) grain was evaluated visually. Loaf volume was measured by the rapeseed displacement method.
Determination of pH in wheat flour dough and moisture contents in bread crumb The pH of wheat flour dough was determined by AACC Intl. 2000 (method 02-52.01), and moisture contents in bread crumb were determined using an infrared moisture determination balance (FD-600-3; Kett Electric Laboratory Co., Ltd, Tokyo, Japan).
Fermograph test of bread dough A fermograph (AF-1101W; ATTO Corp., Tokyo, Japan) was used for measuring the amount of gas produced in the bread dough. The measurement method involved gas-to-liquid conversion with a manometer and pressure detection with a pressure transducer. After the 1st proof of the bread dough (140 min at 30°C) was performed, the bread dough (30 g) was rounded and put into a 225 mL sample bottle (62 mm diameter × 110 mm height).
Determination of exuded liquid from bread dough upon centrifugation After the 1st proof, 4 types of bread dough (30 g) were each put into a centrifuge tube (29 mm diameter, 103 mm height). These dough samples were centrifuged at 38,900 × g for 120 min at 4°C (Hitachi Himac CR 21G; Hitachi Koki Co., Ltd., Tokyo, Japan), then each centrifuge tube was titrated at an angle of depression of 45° for 60 min in a cold room (4°C), and the supernatant (centrifuged liquid) was collected in a dropwise manner and recorded as mL per 100 g of dough (Seguchi et al., 2003).
Measurement of bread temperature using an infrared thermometer and digital thermometer The temperature of bread was measured using an infrared thermometer (ThermalView XHR 32-RA0350, Pixel: 320 x 256; ViewOhre Imaging Co., Ltd., Tokyo, Japan). Bread dough was baked at 210°C for 5, 10, and 30 min, taken out from the oven, cut in half vertically with a knife, and photographed using a thermal camera within 30 seconds. The thermal image was presented as a bitmap image, and the temperature of the surface of the sectioned bread was determined from a color bar. The temperature of the bread dough was also measured using a digital thermometer (K-type Thermometer Model SK-1120; Sato Keiryoki MFG. Co., Ltd., Tokyo, Japan); the tip of the sensor was placed in the center of the bread dough and the oven temperature was read from the outside.
Effects of baking time and supplementation with 2.0% (w/w) PGA or 1.0% (w/w) sodium alginate on the oven spring and shrinkage of bread. PGA (2.0% (w/w)) and 1.0% (w/w) sodium alginate/wheat flour bread dough samples were baked in an oven (210°C) for 10, 20, and 30 min, and oven spring (bread height) was measured after the samples had been left to stand for 60 min at room temperature. Oven spring did not change after standing for 60 min at room temperature. To measure the shrinkage (%) of bread, the bread dough (30 g) was put into a glass bottle marked with a size scale and subjected to baking at 210°C for 5, 10, 15, 20, 25, and 30 min. Bread height (mm) was read from the bottle. Shrinkage (%) of bread at each time point was calculated as follows: (bread height (mm) just after removal from the oven — bread height (mm) at 60 min after removal from the oven) / bread height just after removal from the oven × 100 = shrinkage (%) of bread.
Statistical analysis A statistical software package (SPSS Inc., Chicago, IL, USA) was used for the statistical analyses. Four bread samples were used for each treatment; the bread height (mm) and specific volume (cm3/g) were measured four times for each sample, and the obtained results were averaged. All of the experiments were performed in, at minimum, quadruplicate. The analysis produced significant F values by an analysis of variance that was followed by Duncan's multiple-range test for comparing means.
Effects of alginic acid-related materials (alginic acid, alginates, and PGA) on bread making properties The effects of alginic acid-related materials (6 kinds) on bread making properties (bread height (mm) and specific volume (cm3/g)) were examined. The materials were mixed at 0.5 – 3.0% (w/w) in wheat flour and bread making was performed (Table 1). The baking results indicated that improvements in bread making properties were observed for 2.0% (w/w) PGA or 1.0% (w/w) sodium alginate compared with the control. The addition of ammonium alginate and potassium alginate also slightly increased the bread making properties; however, the addition of alginic acid resulted in deterioration of the properties. The pH value of 1.5% (w/w) alginic acid/wheat flour dough was decreased from 5.95 (control) to 4.38. The importance of the pH value of bread dough was reported by Hayashi and Seguchi (1999), who demonstrated that optimal bread making properties were obtained with dough of pH 4.72. The addition of calcium alginate did not have a remarkable effect. Therefore, we investigated the beneficial effects of PGA or sodium alginate on bread making properties in this experiment.
| Alginic acid-related materials | Mixture (% (w/w)) | ||||||
|---|---|---|---|---|---|---|---|
| 0 | 0.5 | 1.0 | 1.5 | 2.0 | 3.0 | ||
| PGA | Baking absorption (%) | 66.2 (1.1) | 71.5 (2.3) | 73.5 (0.9) | 75.0 (1.4) | 76.4 (1.3) | 78.3 (0.5) |
| Height (mm) | 79.5 (1.8)a | 84.6 (2.0)b | 83.8 (2.5)b | 90.2 (2.1)c | 89.3 (2.1)c | 88.3 (1.9)c | |
| SV (cm3/g) | 3.62 (0.08)a | 3.88 (0.08)b | 3.90 (0.11)be | 4.09 (0.03)c | 4.25 (0.08)d | 3.98 (0.07)ce | |
| Sodium alginate | Baking absorption (%) | 66.2 (1.1) | 69.3 (0.7) | 71.0 (1.2) | 72.8 (1.0) | 75.0 (1.5) | |
| Height (mm) | 79.5 (1.8)a | 82.7 (2.6)b | 84.8 (4.0)b | 82.7 (2.6)b | 84.4 (3.7)b | ||
| SV (cm3/g) | 3.62 (0.08)a | 3.68 (0.06)a | 3.87 (0.14)b | 3.83 (0.14)b | 3.81 (0.10)b | ||
| Alginic acid | Height (mm) | 79.5 (1.8)a | 72.1 (3.0)b | 66.2 (4.0)c | 49.6 (2.1)d | nd | |
| SV (cm3/g) | 3.62 (0.08)a | 3.19 (0.09)b | 2.59 (0.08)c | 1.78 (0.04)d | nd | ||
| Calcium alginate | Height (mm) | 79.5 (1.8)a | 77.9 (0.9)a | 75.0 (2.6)b | nd | nd | |
| SV (cm3/g) | 3.62 (0.08)a | 3.52 (0.06)b | 3.43 (0.07)b | nd | nd | ||
| Ammonium alginate | Height (mm) | 79.5 (1.8)a | 71.8 (2.1)b | 80.6 (2.0)ac | 82.5 (3.0)c | nd | |
| SV (cm3/g) | 3.62 (0.08)a | 3.17 (0.08)b | 3.50 (0.13)c | 3.50 (0.13)c | nd | ||
| Potassium alginate | Height (mm) | 79.5 (1.8)a | 81.3 (2.7)a | 87.2 (4.7)b | nd | nd | |
| SV (cm3/g) | 3.62 (0.08)a | 3.58 (0.12)a | 3.71 (0.06)b | nd | nd | ||
Values represent means of 4 replicates with the standard deviation in parentheses.
Means followed by different letters in columns are significantly different at p < 0.05 according to Duncan's multiple-range test
nd; Not determined.
Effect of PGA or sodium alginate on gas production by yeast The total amounts of gas (mL/g yeast) produced by yeast in the dough of PGA or sodium alginate/wheat flour and control were 393, 401, and 396 mL/g yeast, respectively; that is, the effects of PGA or sodium alginate on gas production were small, and the levels were almost the same among the three groups (Table 2).
| Sample | Total gas (mL / g yeast) |
|---|---|
| Control | 396.1 (7.9) |
| 2.0 % (w/w) PGA | 393.1 (4.1) |
| 1.0% (w/w) Sodium alginate | 400.9 (6.6) |
Values represent means of 5 replicates with the standard deviation in parenthesis.
Effects of PGA or sodium alginate on baking absorption of bread dough The baking absorption of PGA or sodium alginate/wheat flour and control dough was examined using Brabender farinograph tests. Differences in baking absorption (%), which was measured by the addition of water to attain 500 BU in a Brabender farinograph, are indicated in Table 1. The baking absorption of wheat flour dough was increased from 66.2% (control) to 71.5, 73.5, 75.0, 76.4, and 78.3 % by the addition of PGA of 0.5, 1.0, 1.5, 2.0, and 3.0%, respectively (Table 1). Similar results were also observed in the sodium-alginate/wheat flour bread dough, that is, baking absorption was increased from 66.2% (control) to 69.3, 71.0, 72.8, and 75.0% by the addition of 0.5, 1.0, 1.5, and 2.0% sodium-alginate, respectively. To obtain the same viscoelasticity in bread dough as in the control bread dough, a greater addition of water (221.6 mL and 205.9 mL) was necessary compared to control (192.0 mL) when 2.0% PGA and 1.0% sodium alginate were added, respectively.
Moisture contents of bread crumbs baked with 2.0% (w/w) PGA or 1.0% (w/w) sodium alginate/wheat flour and control bread dough Results showed that the moisture content of control bread dough decreased from 46.2% (before baking) to 45.2% after 30 min, while 2.0% PGA/wheat flour dough decreased from 50.0% (before baking) to 47.6% after 30 min, and 1.0% sodium alginate/ wheat flour dough decreased from 48.3% (before baking) to 46.2% after 30 min; more specifically, the initial moisture contents were slightly decreased in 5 min of baking and then remained almost constant during the following 25 min in the oven. In this experiment, it was found that the moisture content of bread crumbs hardly changed throughout the bread making (Fig. 1).

Changes in the moisture content of breads baked with 2.0% (w/w) PGA or 1.0% (w/w) sodium alginate/wheat flour dough and control dough.
Results are expressed as the means ± SD (n=3). Different letters are significantly different at p < 0.05 according to Duncan's multiple-range test.
The amount of exuded liquid from PGA or sodium alginate/ wheat flour dough and control dough The amount of exuded liquid was 0 mL/100 g in PGA or sodium alginate/wheat flour dough and 10.4 mL/100 g in control dough upon centrifugation (38,900 × g), indicating that the water was bound firmly in the PGA or sodium alginate/wheat flour dough (Table 3).
| Sample | Exuded liquid (mL / 100 g dough) |
|---|---|
| Control | 10.4 (0.5) |
| 2.0% (w/w) PGA | 0.0 (0.0) |
| 1.0% (w/w) Sodium alginate | 0.0 (0.0) |
Values represent means of 4 replicates with the standard deviation in parenthesis.
Oven spring of 2% (w/w) PGA or 1% (w/w) sodium alginate/wheat flour bread dough and control bread dough To measure the oven spring (Morimoto et al., 2015) throughout baking, bread dough samples were taken out from the oven at 0, 10, 20, and 30 min of baking and left at room temperature for 60 min before measuring the bread height (mm) and specific volume (cm3/g). Bread height (mm) increased from 0 min of baking to 20 min of baking; however, the rate of increase was somewhat lower than that for specific volume after 20 min. The specific volume at 0 min of baking was not measured. The specific volume (cm3/g) continued to increase to its maximum with increasing baking time of 30 min (Fig. 2). In the early stages of baking, the gas volume is composed almost entirely of CO2, whereas the fraction of water vapor increases with temperature (Eliasson and Larsson, 1993).

Oven spring of breads baked with PGA or sodium alginate/wheat flour dough and control dough.
Results are expressed as the means ± SD (n = 3). Different letters in the same lines are significantly different at p < 0.05 according to Duncan's multiple-range test.
In all cases, oven spring continued to increase for 30 min, and PGA or sodium alginate/wheat flour bread dough exhibited a higher value than control flour dough. It was suggested that the yeast in the bread dough continued to produce CO2 gas, and the bread dough continued to swell with CO2 gas and water vapor until 30 min of oven baking at 210°C. However, yeast grows optimally at a temperature of 20 – 40°C (van Dam 1986), which suggested that the yeast's production of gas stopped at around 5 – 10 min of oven baking. Therefore, the reason why the bread continued to swell at such a high temperature (210°C) is unclear. We removed the bread from the oven at various baking times (5, 10, 15, 20, 25, and 30 min) and calculated the shrinkage of each sample (Fig. 3). Swelling of the bread dough occurred due to yeast-produced CO2 gas at 5 min of baking (Fig. 2); however, PGA or sodium alginate/wheat flour bread dough showed larger shrinkage (19.3 and 16.7%) than control bread dough (7.0%) at 5 min of baking. At 5 – 10 min of baking, swelling of the breads due to CO2 gas was expected to have almost finished in the oven due to yeast inactivation; however, the bread continued to swell (Fig. 2). The bread shrank upon being removed from the oven at 5, 10, 15, 20, and around 25 min (Fig. 3) because the bread dough had not firmed sufficiently in the oven at these baking times. The oven spring in bread height and specific volume (Fig. 2) before firming was not representative of real leavened bread height and specific volume, but was instead of shrunken bread height and specific volume. However, the effect of PGA and sodium alginate on increased dough expansion compared to control throughout oven spring was observed.

Shrinkage (%) of breads baked with PGA or sodium alginate/wheat flour dough and control dough. Results are expressed as the means ± SD (n = 3).
Measurement of bread dough by infrared thermography We attempted to determine the precise temperature of bread crumbs throughout the baking process. However, the temperature of bread crumbs could not be measured precisely using a digital thermometer. We typically placed the sensor of the thermometer at various points in the bread crumbs and measured the temperature during baking; however, the recorded temperature values varied and appropriate averaged data were not obtained because of the variation in measurement location, i.e., bread center or surface, and an air portion or a wall portion of the bread cell. Thus, we next used infrared thermography instead of a digital thermometer, which indicates the temperature of areas of the bread crumb as a color (Morimoto et al., 2015). The color (temperature) indicators ranged from a lower temperature of blue (30°C) to higher temperatures of yellow (75°C) and red (more than 80 – 85°C). The colors of the lower and upper portions of the bread dough at 0 min were blue-whitish (30 – 35°C) and blue (below 25°C) (Fig. 4-1). Temperature measurement by infrared thermography is described in Materials and Methods. Specifically, the temperature of the cut surface of the bread crumb is measured within 30 seconds of bread removal from the oven. The temperature may be lower than that taken of bread crumbs baking in the oven. To examine the difference in temperature between the cut surface of bread crumbs and bread crumbs in the oven, the bread crumb temperature was measured using a digital thermometer. The sensor of the digital thermometer was inserted into the central part of the bread crumb, and the temperature during oven baking for 30 minutes was measured by an external monitor. The temperature (one point in the bread dough) at 0 min was 29.9 ± 0.3°C by digital thermometer. After 5 min of baking (Fig. 4-2), the central area (blue-black) of the bread crumb was below 40°C, at which yeast could survive and produce CO2 gas (digital thermometer; 35.8 ± 1.8°C); however, the temperature of the upper surface area (yellowish-reddish) was around 70 – 80°C, at which yeast could not survive. At 10 min of baking (Fig. 4-3), the temperature at the central area of the bread crumb (yellowish-reddish) was 70 – 80°C (digital thermometer; 79.5 ± 3.4°C), and the yeast would likely have been inactivated due to the heat, upon which the swelling of the bread dough would stop or decrease. After 30 min of baking (Fig. 4-4), the temperature of the bread crumb (reddish, yellowish and white spots) varied and was more than 80°C (digital thermometer; 97.3 ± 0.3°C), and starch gelatinization and denaturation of gluten protein occurred, followed by firming of the bread structure. Figure 4-5 shows the final bread baked with PGA/wheat flour. Before forming a network with an open cell structure, the gas cell structure is altered by the pressure gradient generated by the temperature gradient. Such a gradient during gas cell expansion will cause the lattice to dilate in one dimension, from the center of a hypothetical cylindrical bread toward the surface (Eliasson and Larsson, 1993).
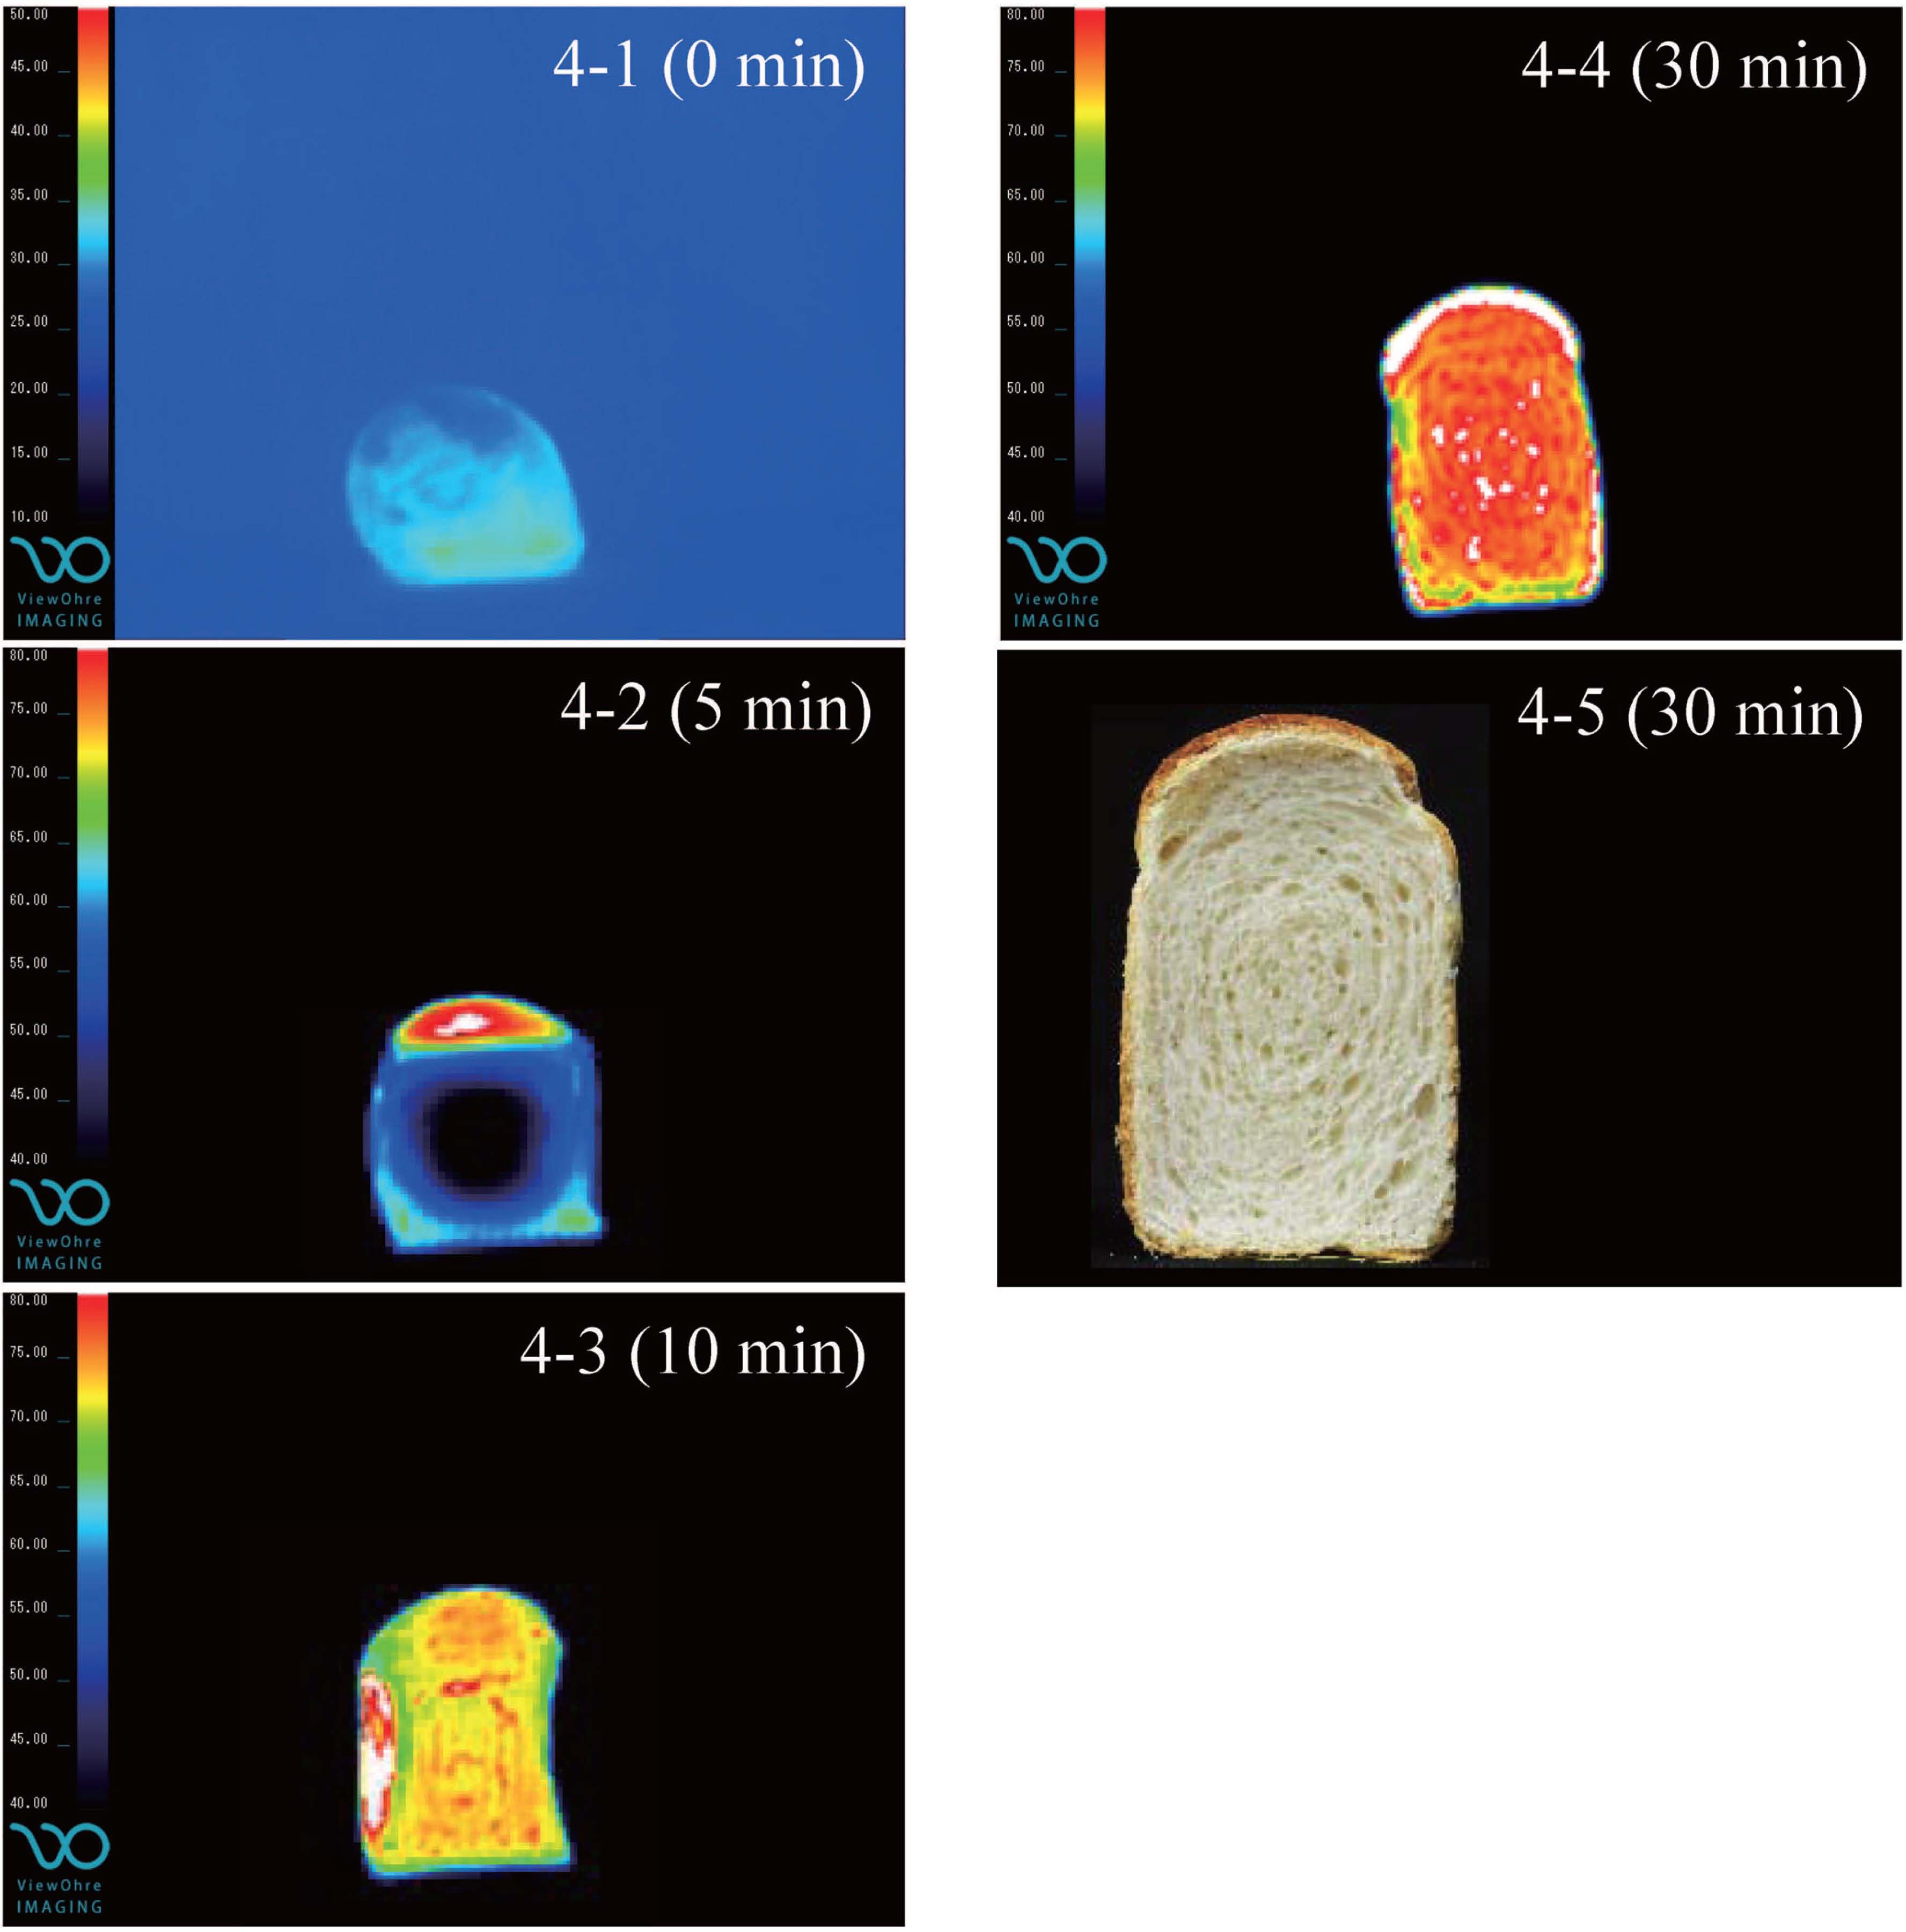
Temperature determination of bread crumbs baked with PGA/wheat flour during baking (210°C) by infrared thermography (4-1, 2, 3, and 4), and appearance of sectioned bread at room temperature (4–5).
The addition of PGA or sodium alginate to wheat flour resulted in increased baking absorption of the bread dough; the resulting expansion of bread dough increased, and CO2 gas produced by yeast could be effectively captured by PGA or sodium alginate/ wheat flour bread dough. After 10 min of baking, the temperature of the bread dough reached 70 – 80°C, at which point yeast became inactivated, and starch gelatinization and gluten denaturation occurred. In addition, owing to the higher baking absorption of PGA or sodium alginate/wheat flour (Table 1), the addition of more water to PGA dough and sodium alginate dough than in control flour was necessary. PGA or sodium alginate/wheat flour dough required more water to achieve similar viscoelasticity to that of the control dough. The bread dough could subsequently capture the CO2 gas from the yeast and the water vapor effectively, and showed greater leavening than the control during oven baking at 210°C. The more leavened bread dough firmed less quickly at 30 min, compared to the control, of baking at 210°C. The bread resulting from PGA or sodium alginate/wheat flour dough exhibited superior properties compared to the control dough.
The addition of PGA or sodium alginate to wheat flour resulted in remarkably increased baking absorption (%), and the water in the bread dough was well absorbed. A higher moisture content in the PGA or sodium alginate/wheat flour bread was observed after 30 min of baking at 210°C. The PGA or sodium alginate/wheat flour bread dough swelled more than the control due to CO2 gas and water vapor, firmed sufficiently, and exhibited superior bread making properties.