Abstract
The extraction, purification, preliminary characterization and antioxidant activity of glycoproteins from Sepia pharaonis muscle (SPMG) were investigated. The optimal extraction conditions were obtained using a Box-Behnken design. The crude SPMG was purified by DEAE-Cellulose 52 ion-exchange and Sephadex G-100 gel chromatography and two fractions (SPMG-I and SPMG-II) were obtained. SPMG-I and SPMG-II were rich in Glu, Asp, Leu, Arg and Lys with the molecular weight of 42.5 and 36.3 kDa, respectively. The glucose was the predominant monosaccharide composition of SPMG-I and SPMG-II. The existence of O-glycosidic linkage in SPMG-I and SPMG-II was demonstrated by a β-elimination reaction. SPMG-I and SPMG-II were characterized by FT-IR. SPMG, SPMG-I and SPMG-II showed excellent antioxidant activities and SPMG-I exhibited the highest antioxidant ability. These may provide theoretical basis for further system research and rational development and utilization of SPMG resource.
Introduction
Glycoprotein is a glycoconjugate in which a protein carries one or more carbohydrate chains covalently attached to a polypeptide backbone, usually via N- or O-linkages (Nie et al., 2008). It is reported that natural glycoproteins have a wide variety of biological functions, such as maintenance of protein conformation and stability, surface or intracellular recognition, cell adhesion, processing and diversion of protein, and so on. These functions may depend on either the protein part or the carbohydrate part or both (Vliegenthart, 1998). The rapid development of biological and chemical technologies has led to more and more in-depth understanding on bioactivities, structure, and the relationship between function and structure of glycoproteins. Natural glycoproteins isolated from plants, animals, molds, fungi, and algae, have attracted more attention recently in the biochemical and medical areas due to their antitumor, anti-inflammation, antivirus, lowering blood sugar, anticaducity, anticoagulant, antioxidation etc. (Bao et al., 2012; Li et al., 2013; Nie et al., 2007). Moreover, published data indicated that many natural glycoproteins from marine animals exhibit superior antioxidant activities with no significant side effects and low toxicity could be ideal antioxidant agents to prevent and treat diseases (Li et al., 2013).
The excessive free radicals in human body is related to onset of many diseases such as cancer, ischemia/reperfusion injury, atherosclerosis, inflammation, preeclampsia, shock, neurodegenerative, atherosclerosis, as well as degenerative processes associated with aging (Grajek et al., 2005). Synthetic antioxidants, such as tertbutylhydroquinone (TBHQ), butylated hydroxyanisole (BHA), butylated hydroxytoluene (BHT) and propyl gallate, are widely used in industrial processing for reducing damage to the human body. However, the applications of these antioxidants are restricted due to their potential hazard to health, such as liver damage and carcinogenesis (Witschi, 1986). Therefore, more and more experts put their research eyes on exploring and developing safe and natural antioxidants.
Sepia pharaonis (S.pharaonis) belongs to the Mollusca, Cephalopoda, Sepioidea, Sepiidae, Sepia, widely distributed in the Philippine Islands, Malaysia, the northern, eastern and western of Oceania, coast of India, the Red Sea and the South Ocean coast of China. S.pharaonis is a very promising species with respect to culture potential due to high feeding rate, tolerance of crowding, resistance to disease, high growth rate, spawning success, ease of staging embryonic development, and tolerance to handling, and is of important economic values (Minton et al., 2001). The muscle, the main edible portion of S.pharaonis, represents 60% of the total body and contains 82.8 ∼ 84.4% water, 11.9 ∼ 14.9% crude protein, 0.52 ∼ 0.57% curd fat (mainly unsaturated), 1.2 ∼ 1.3% ash and 0.6 ∼ 1.9% collagen (Amonrat et al., 2006), which is considered to be have a broad range of therapeutic and nutritional values in enriching the blood, nourishing the liver and kidney, treating pneumonia and stomach, as well as enhancing human nonspecific immunity according to the views of Chinese traditional dietary and modern nutrition. However, large quantities of S.pharaonis muscle were discarded as waste during storage and transportation processes due to obvious seasonality and regional characteristics or made into salted and dried product which is unpalatable and lack of original nutrients.
The response surface method (RSM) is an effective statistical and mathematical technique for developing, improving and optimizing complex processes. The basic theoretical and fundamental aspects of the approach are explained by Giovanni (1983). By means of the empirical statistics analysis, RSM not only greatly reduces the number of experimental trials for optimizing the extraction parameters in a short time, but also generates a mathematical model to explain the reciprocal interaction of experimental factors. Box-Behnken design (BBD), a type of RSM design, is more efficient and easier to arrange and interpret experiment in comparison with others and widely used in optimizing the variables of natural active ingredient extraction processes (Sin et al., 2006; Lee et al., 2006; Wu et al., 2013; Li et al., 2012).
In this paper, RSM was firstly employed for the extraction process of glycoproteins from S.pharaonis muscle (SPMG) and two novel glycoproteins (SPMG-I and SPMG-II) were purified and obtained. Their preliminary characterization and antioxidant activity were reported for the first time. The results of this study would provide good foundations for the development of S.pharaonis glycoproteins as a possible valuable source of natural antioxidants and the further research on the relationship between their structure and bioactivity.
Materials and Methods
Materials and reagents S.pharaonis were purchased from an aquatic production market (Zhanjiang, China) and were dissected, and then their muscles were mashed by the speed organizations bruiser (DS-1, Shanghai, China) and dried in a vacuum freeze drier (LGJ-18, Beijing, China) for 24 h, and pulverized by the disintegrator (DFY-200, Qingzhou, China). The dried powder samples were stored at −20°C for further study.
DPPH radical and molecular low weight markers for proteins were purchased from Sigma (USA). Sephadex G-100 was purchased from Whatman (USA) and DEAE-Cellulose 52 was purchased from GE (USA). All other chemicals and solvents used in the experiment were of analytical grade.
Extraction of SPMG Dried powder samples were put into a 50 mL beaker, then extracted with sodium chloride (NaCl) solution at a specified liquid-solid ratio, extraction temperature and extraction time. The extracted slurry was centrifuged at 4000 × g for 20 min (H/T 18 MM, Changsha, China) and the supernatant fluid was collected. The supernatant fluid was precipitated by adding ammonium sulfate to a final saturation of 80%, the precipitation was dialyzed against distilled water for 48 h at 4°C, and then the solution was freeze-dried to obtain SPMG. The SPMG yield (%) is calculated as follows:
m0 (g) is the dried SPMG weight; m (g) is the dried raw material weight.
Experimental design Based on the preliminary single-factor test results (data not shown), the experimental range of the selected extraction variables is given in Table 1. The RSM was employed for experimental design and data analysis using Design-Expert software (version 8.0.5, USA). A three-level-four-factor BBD (NaCl concentration, X1; liquid-solid ratio, X2; extraction time, X3; and extraction temperature, X4) was performed to determine the best combination of extraction parameters for SPMG. The ranges of four independent variables and their levels and the results of whole design consisted of 29 experimental points carried out in random order were presented in Table 1. The experimental data were fitted to the following second-order polynomial:
where
Y is the dependent variable, and the coefficients of the polynomial are represented by
b0 (constant term),
bi (linear effects),
bii (quadratic effects), and
bij (interaction effects). They represent the linear, quadratic, and interaction effects of the factors on the response, respectively.
Xi and
Xj are the independent variables while
k equals to the number of the tested factors (
k = 4). Analysis of the experimental design data and calculation of predicted responses were performed by Design-Expert software (version 8.0.5, USA). Subsequently, additional confirmation experiments were carried out to verify the validity of the statistical experimental design.
Table 1.
Box-Behnken design and response values for the yield of SPMG
|
Independent variables |
Dependent variables |
| Treat |
NaCl concentration (%) |
Liquid-solid ratio (mL/g) |
Extraction time (h) |
Extraction temperature (°C) |
Yield (%) |
|
X1 (x1) |
X2 (x2) |
X3 (x3) |
X4 (x1) |
Y |
| 1 |
3(0) |
20(0) |
1.5(0) |
70(0) |
7.99 |
| 2 |
3(0) |
25(1) |
2.0(1) |
70(0) |
6.98 |
| 3 |
6(1) |
15(−1) |
1.5(0) |
70(0) |
6.85 |
| 4 |
0(−1) |
20(0) |
1.5(0) |
60(−1) |
5.49 |
| 5 |
3(0) |
20(0) |
2.0(1) |
80(1) |
6.83 |
| 6 |
0(−1) |
25(1) |
1.5(0) |
70(0) |
6.19 |
| 7 |
0(−1) |
20(0) |
1.5(0) |
80(1) |
6.33 |
| 8 |
3(0) |
15(−1) |
1.5(0) |
60(−1) |
6.92 |
| 9 |
0(−1) |
20(0) |
1.0(−1) |
70(0) |
5.77 |
| 10 |
3(0) |
20(0) |
2.0(1) |
60(−1) |
7.56 |
| 11 |
3(0) |
20(0) |
1.5(0) |
70(0) |
7.83 |
| 12 |
3(0) |
25(1) |
1.5(0) |
60(−1) |
7.72 |
| 13 |
0(−1) |
15(−1) |
1.5(0) |
70(0) |
5.56 |
| 14 |
3(0) |
15(−1) |
1.0(−1) |
70(0) |
7.18 |
| 15 |
3(0) |
15(−1) |
1.5(0) |
80(1) |
6.11 |
| 16 |
6(1) |
25(1) |
1.5(0) |
70(0) |
6.76 |
| 17 |
3(0) |
20(0) |
1.5(0) |
70(0) |
7.88 |
| 18 |
6(1) |
20(0) |
1.0(−1) |
70(0) |
6.89 |
| 19 |
3(0) |
20(0) |
1.5(0) |
70(0) |
7.64 |
| 20 |
0(−1) |
20(0) |
2.0(1) |
70(0) |
6.10 |
| 21 |
3(0) |
25(1) |
1.5(0) |
80(1) |
7.43 |
| 22 |
6(1) |
20(0) |
1.5(0) |
80(1) |
6.30 |
| 23 |
3(0) |
15(−1) |
2.0(1) |
70(0) |
7.47 |
| 24 |
6(1) |
20(0) |
2.0(1) |
70(0) |
6.53 |
| 25 |
3(0) |
25(1) |
1.0(−1) |
70(0) |
7.40 |
| 26 |
3(0) |
20(0) |
1.0(−1) |
80(1) |
7.04 |
| 27 |
3(0) |
20(0) |
1.0(−1) |
60(−1) |
7.23 |
| 28 |
6(1) |
20(0) |
1.5(0) |
60(−1) |
7.39 |
| 29 |
3(0) |
20(0) |
1.5(0) |
70(0) |
7.77 |
x represent the coded level of variables; X represent the actual level of variables.
Figures in parentheses denote coded level of variables.
Purification SPMG of 0.5 g was dissolved in 10 mL of phosphate buffer (0.05 mol/L, pH 7.4) and loaded onto a DEAE-Cellulose 52 anion-exchange column (2.6 cm × 60 cm) pre-equilibrated with phosphate buffer (0.05 mol/L, pH 7.4), and then eluted with a linear gradient of NaCl (0 ∼ 1 mol/L) in the above buffer at a flow rate of 1 mL/min. Each fraction (6 mL) was collected and characterized at 280 nm for protein content, and carbohydrate content was assayed at 490 nm by phenol-sulfuric acid method (Dubois et al., 1956). The glycoprotein-containing fractions were pooled together and lyophilized after dialyzed against distilled water for 48 h at 4°C. Dried fractions were dissolved in phosphate buffer (0.05 mol/L, pH 7.4) and loaded onto a Sephadex G-100 gel filtration column (1.6 cm × 60 cm), and eluted with phosphate buffer (0.05 mol/L, pH 7.4) at a flow rate of 0.3 mL/min. Each fraction of 3 mL was monitored and processed as above.
Homogeneity and molecular weight The homogeneity was determined by High Performance Gel Permeation Chromatography (HPGPC). The sample was dissolved in ultrapure water to a concentration of 1.0 mg/mL and filtered by 0.45 µm filter membrane. The solution (20 µL) was injected into the HPGPC (model ll00, Agilent, American). The following chromatographic conditions were used: water-soluble GPC column (Ultrahydrogel TM500, 7.8 mm × 300 mm), mobile phase of 0.1 mol/L NaCl solution with a flow rate of 1 mL/min, detector RID, column and detector RID temperature of 35°C (Nie et al., 2005). The homogeneity and molecular weight of sample were determined by Sodium Dodecyl Sulfate-Polyacrylamide Gel Electrophoresis (SDS-PAGE) using the method described by Laemmli (1970), which was performed using 12% separating gel and 5% stacking gel. The protein pattern was visualized by staining with Coomassie brilliant blue R-250. The molecular weight of SPMG was estimated from reducing gels by comparison with a protein calibration mixture (LMW, Shanghai Institute of Biochemistry, China), consisting of rabbit phosphorylase b (97.4 kDa), bovine serum albumin (66.2 kDa), rabbit actin (43.0 kDa), bovine carbonic anhydrase (31.0 kDa), trypsin inhibitor (20.1 kDa) and hen egg white lysozyme (14.4 kDa).
FTIR analysis The IR spectrum of the sample was determined using an FT spectrometer (Nicolet 6700, Thermo Fisher Scientific, American). Sample (2 mg) was mixed with 100 mg of dry KBr powder and then pressed into pellets for FTIR measurement with a resolution of 4 cm−1 in the frequency range 4000 ∼ 500 cm−1 region.
Linkage analysis The linkage of sample was analyzed by β-elimination reaction using the method described by Zheng et al. (2009). Sample (1 mg) was dissolved in 5 mL 0.2 mol/L NaOH, and incubated at 55°C for 6 h. The solutions, including treated and untreated with NaOH, were scanned from 200 to 400 nm by UV spectrometer (UV-3600, Shimadzu, Japan). The N-glucosidic linkage always keeps stable under alkaline condition, while the O-glucosidic linkage is easy to be broken and the hydrolysate has obvious absorption at 240 nm.
Amino acid and monosaccharide composition The total protein content was measured by Bradford method, using BSA as a standard (Bradford, 1976). The total carbohydrate content was determined by phenol-sulfuric acid method, using glucose as a standard (Dubois et al., 1956). The amino acid composition of sample was determined using an automatic amino acid analyzer (S-433D, Se Kamu, German). The sample was hydrolyzed with 6 mol/L HCl for 24 h at 110°C in a sealed tube. The hydrolysate was vacuumized and the residue was dissolved in 25 mL citric acid buffer solution. The content of tryptophan was determined by the method of GB/T 15400 – 94 with spectrophotometer after the sample hydrolyzed with 10% KOH. The monosaccharide composition of sample was analyzed by gas chromatography-mass spectrometry (7890B-5977A, Agilent, American). Sample (10 mg) was treated with 2 mL of 4 mol/L trifluoroacetic acid in order to hydrolyse monosaccharide. The reaction was reacted in nitrogen atmosphere at 120°C for 4 h. The hydrolysate was evaporated under reduced pressure at 60°C. Acetylation was carried out with 10 mg hydroxylamine hydrochloride and 0.5 mL pyridine by incubating at 90°C for 30 min, then 0.5 mL acetic anhydride was added with continuously heating for 30 min at 90°C. The excess of reagent was removed by evaporating under reduced pressure, and then dissolved the alditol acetate derivative with 1 mL chloroform. The resulting supernatant was examined by GC-MS. The following chromatographic conditions were used: capillary column (DB1701, 30 m × 0.25 mm × 0.25 µm), carrier gas (N2) with a flow rate of 1.0 mL/min, detector FID, initial column temperature 100°C for 2 min and then 10./min to 260°C for 15 min, and EI mode 70 eV.
Reducing power assay The reducing power was determined according to a modified method (Hinneburg et al., 2006). 2 mL of different mass concentration (2 ∼ 10 mg/mL) of samples was mixed with 2 mL of phosphate buffer (0.2 mol/L, pH 6.6) and 2 mL of potassium ferricyanide (1%, w/v), then incubated at 50°C for 20 min. Afterwards, 2 mL of trichloroacetic acid (10%, w/v) was added to the mixture, and centrifuged at 3000 × g for 5 min. The upper layer of the solution (2 mL) was mixed with double-distilled water (2 mL) and ferric chloride (0.4 mL, 0.1%, w/v), and the absorbance was measured at 700 nm. Increased absorbance of reaction mixture indicated increased reducing power. Vc was used as a control.
Superoxide radical assay Superoxide radicals are a highly toxic species generated by numerous biological and photochemical reactions. The ability of scavenging to superoxide radical was measured by pyrogallol autoxidation method (Nie et al., 2007). The reaction mixture, containing 1 mL of different mass concentration of samples (2 ∼ 10 mg/mL), 4.5 mL of Tris-HCl buffer (50 mmo/L, pH 8.2) and 3.2 mL of double-distilled water, was incubated at 25°C for 20 min. The reaction was initiated by adding 0.3 mL of pyrogallol (3 mmol/L) to the reaction mixture. Vc was used as a control. The absorbance was measured at 325 nm every 30 seconds within 4 minutes. The capability of scavenging to superoxide radicals was calculated by the equation below:
where
K is the slope of regression equation of absorbance and time of blank, namely the rate of autoxidation.
K0 is the autoxidantion rate of blank (distilled water instead of sample) and
K1 is the autoxidantion rate of sample.
Hydroxyl radical assay Hydroxyl radicals exhibit a small diffusion capacity and are most reactive in the induction of injuries to cellular molecules. The ability of scavenging to hydroxyl radicals was evaluated by a modified method of Li et al. (2008). The reaction mixture, containing 1 mL of different mass concentration of samples (0.2 ∼ 1 mg/mL), 1 mL of phenanthroline (0.75 mmol/L), 2 mL of phosphate buffer (0.15 mo/L, pH 7.4), 1 mL of ferrous sulfate (0.75 mmol/L) and 1 mL of H2O2 (0.01%, v/v), was incubated at 37°C for 60 min and the absorbance was then observed at 536 nm. Vc was used as a control. The scavenging effect of hydroxyl radicals was calculated using the equation as follows:
where
A0 is the absorbances of the blank without sample and
A1 is the absorbance of sample.
DPPH radical assay DPPH radical scavenging activity was determined in accordance with the reported method (Nie et al., 2007). The reaction mixture, containing 1 mL of sample solution with different mass concentrations (2 ∼ 10 mg/mL) and 3 mL of DPPH methanol solution (0.05 mmol/L). The mixture was shaken vigorously and left to stand for 30 min in the dark at room temperature, and the absorbance was then measured at 517 nm. Vc was used as a control. The scavenging effect on DPPH radical was calculated by the equation below:
where
A0 is the absorbance of DPPH without sample,
A1 is the absorbance of DPPH and sample, and
A2 is the absorbance of sample without DPPH.
Results and Discussion
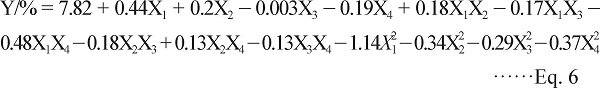
Statistical analysis and the model fitting There were a total of 29 runs performed for optimizing these four variables in the current BBD. The values of response Y (the yield of SPMG) under the different experimental combinations were listed in Table 1. By applying multiple regression analysis on the experimental data, the yield and the test variables in coded units were related by the following second-order polynomial equation:
A summary of the analysis of variance (ANOVA) for the selected quadratic polynomial model and the coefficient estimates of model equation, along with the corresponding
P-values, were presented in
Table 2. The
P-value was employed as a tool to check the significance of each coefficient, which also indicated the interactions between the variables. The smaller the
P-value was, the more significant the corresponding coefficient was. It was concluded from
Table 3 that the linear coefficients (
X1,
X2 and
X4), cross-product terms (
X1X4) and all quadratic terms were significant, with very small
P-values (
P < 0.01 or
P < 0.05), but the other term coefficients were not significant (
P > 0.05). These results indicated that NaCl concentration, liquid-solid ratio and extraction temperature were the major contributing factors to the extraction of SPMG. The ANOVA of quadratic regression model demonstrated that the model was highly significant for a very low
P-value (
P < 0.0001). The value of R was closer to 1, the fitness of the model was better. In this research, the coefficient of determination (R
2) was 0.9303, indicating a high degree of correlation between the observed and predicted values. The value of the determination coefficient adj-R
2 (0.8605) also confirmed that the model was highly significant. The lack-of-fit measured the failure of the model to represent the data in the experimental domain at points which were not included in the regression. The
F-value for the lack-of-fit was not significant (
P > 0.05), confirming the validity of the model. At the same time, a very low value 0.618 of coefficient of the variation (CV) clearly indicated a very high degree of precision and a good deal of reliability of the experimental values. Therefore, the model could adequately represent the real relationship among these parameters.
Table 2.
Analysis of variance for the fitted quadratic polynomial model of extraction of SPMG
| Regression coefficient |
Sum of squares |
DF |
Mean square |
F-value |
P-value |
| Model |
13.37 |
14 |
0.96 |
13.34 |
< 0.0001 *** |
| X1 |
2.32 |
1 |
2.32 |
32.44 |
< 0.0001 *** |
| X2 |
0.48 |
1 |
0.48 |
6.65 |
0.0219 * |
| X3 |
1.33×10⁻⁴ |
1 |
1.33×10⁻⁴ |
1.86×10⁻³ |
0.9662 |
| X4 |
0.43 |
1 |
0.43 |
6 |
0.0281 * |
| X1X2 |
0.13 |
1 |
0.13 |
1.81 |
0.1999 |
| X1X3 |
0.12 |
1 |
0.12 |
1.66 |
0.2182 |
| X1X4 |
0.93 |
1 |
0.93 |
13.00 |
0.0029 ** |
| X2X3 |
0.13 |
1 |
0.13 |
1.76 |
0.2059 |
| X2X4 |
0.068 |
1 |
0.068 |
0.94 |
0.3477 |
| X3X4 |
0.073 |
1 |
0.073 |
1.02 |
0.3301 |
| X12 |
8.46 |
1 |
8.46 |
118.18 |
< 0.0001 *** |
| X22 |
0.75 |
1 |
0.75 |
10.53 |
0.0059 ** |
| X32 |
0.54 |
1 |
0.54 |
7.60 |
0.0154 * |
| X42 |
0.88 |
1 |
0.88 |
12.30 |
0.0035 ** |
| Residual |
1 |
14 |
0.072 |
|
|
| Lack of fit |
0.94 |
10 |
0.094 |
5.54 |
0.0566 |
| Pure error |
0.067 |
4 |
0.017 |
|
|
| Cor total |
14.38 |
28 |
|
|
|
| R2 =0.9303; R2Adj= 0.8605; CV=0.618 |
Subscripts: 1 = NaCl concentration; 2 = liquid-solid ratio; 3 = time; 4 = temperature.
* Significant at 0.05 level.
** Significant at 0.01 level.
*** Significant at 0.001 level.
Table 3.
Amino acid and monosaccharide compositions of SPMG-I and SPMG-II.
| Amino acids and monosaccharide |
SPMG-I |
SPMG-II |
|
g/100g |
| Amino acids |
|
|
| Asp |
8.50 |
6.72 |
| Thr |
2.29 |
1.73 |
| Ser |
2.98 |
1.54 |
| Glu |
19.6 |
8.09 |
| Gly |
0.84 |
1.38 |
| Ala |
5.39 |
1.71 |
| Val |
2.12 |
1.42 |
| Met |
0.65 |
1.59 |
| Ile |
2.61 |
1.31 |
| Leu |
8.12 |
4.29 |
| Tyr |
1.02 |
0.66 |
| Phe |
0.92 |
2.46 |
| His |
0.45 |
0.27 |
| Lys |
6.41 |
3.75 |
| Arg |
7.95 |
2.28 |
| Cys |
0.22 |
0.35 |
| Try |
0.99 |
0.78 |
| Pro |
0.07 |
1.12 |
| Total |
71.11 |
41.43 |
|
% |
| Monosaccharide |
|
|
| Fuc |
20.02 |
13.06 |
| Ara |
4.21 |
3.59 |
| Xyl |
2.13 |
2.52 |
| Man |
12.08 |
16.93 |
| Glu |
57.18 |
59.02 |
| Gal |
4.38 |
4.87 |
Optimization of extraction conditions Three-dimensional (3D) response surfaces and two-dimensional (2D) contour plots were the graphical representations of regression Eq.(6), which were obtained using the software of Design-Expert 8.0.5. They provided a method to illustrate the main and interactive effects of independent variables on the dependent one. In the present study, the results of SPMG yield affected by NaCl concentration, liquid-solid ratio, extraction time and temperature were presented in Fig.1. Analyses of the 3D response surfaces and their respective 2D contour plots allowed us to conveniently investigate the interactions between any two variables, and located the optimum ranges of the variables efficiently such that the response was maximized. In the 3D response surfaces and 2D contour plots, the yield was obtained along with two continuous variables, while the other two variables were fixed constantly at their zero levels.
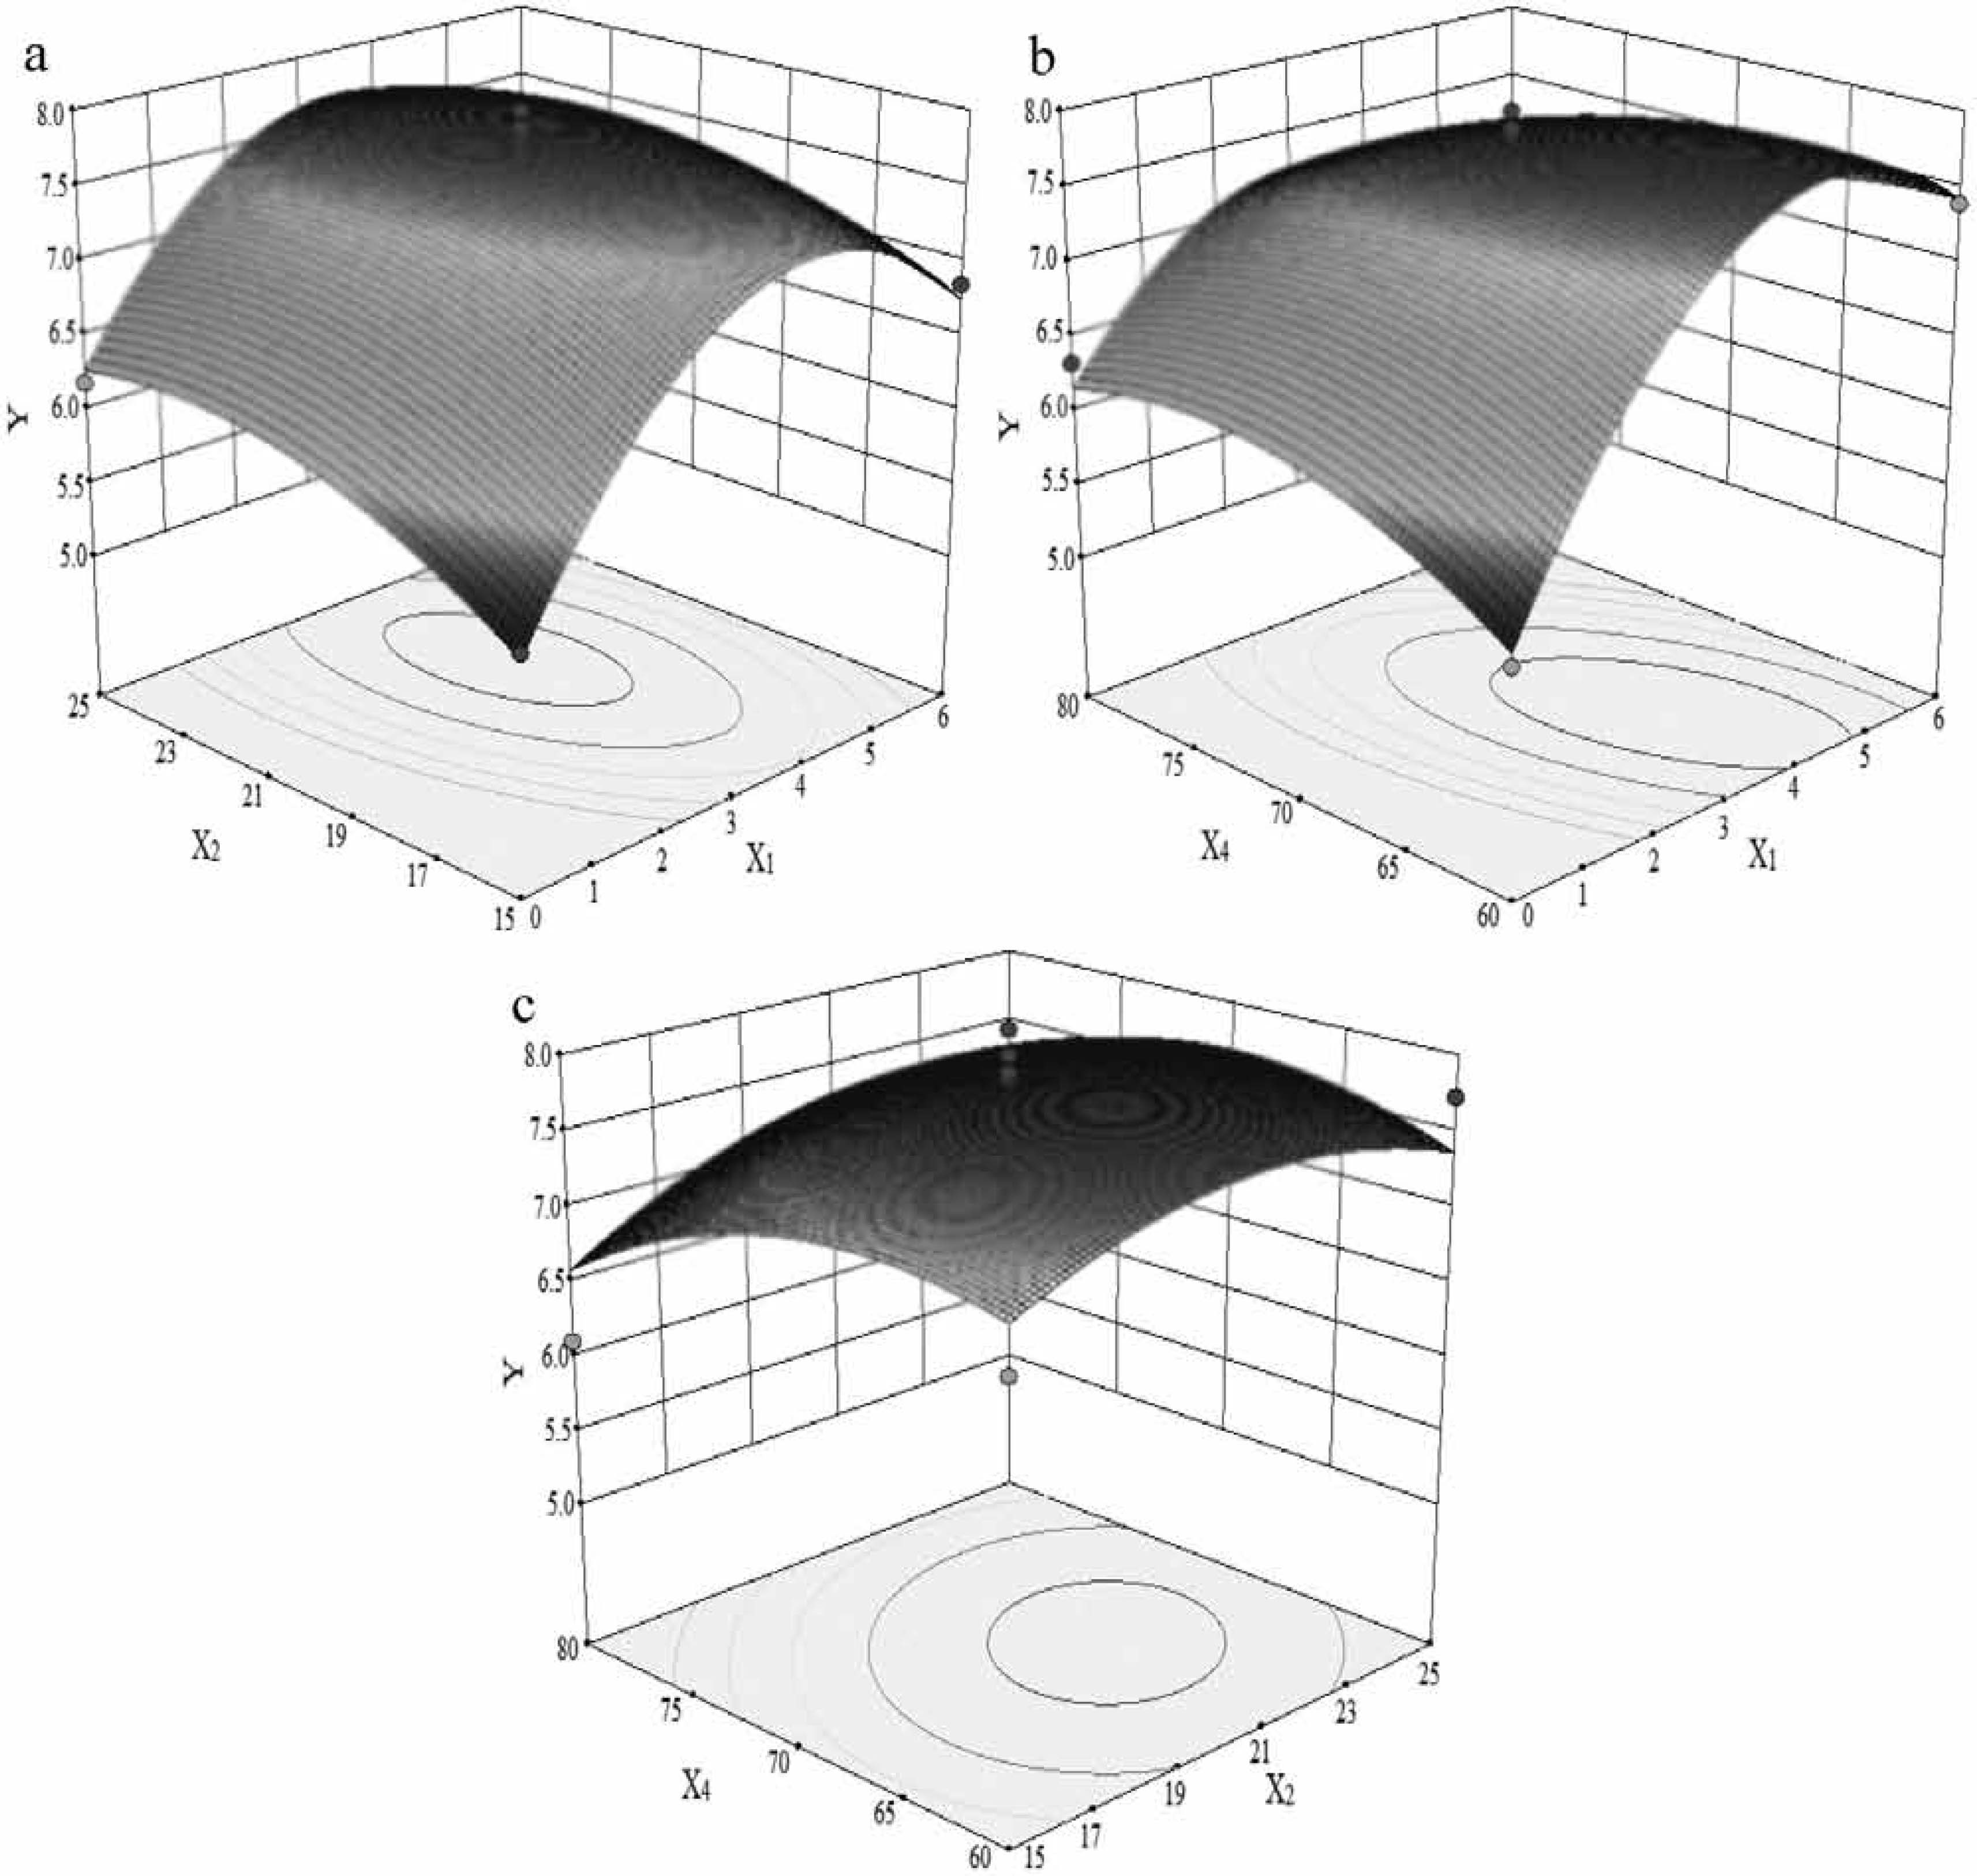
The extraction time had no significant effect on the SPMG yield and was maintained for 1.5 h (coded zero level), we analyzed the other three independent variables. The 3D surface plots and contour plots in Fig.1a showed the effects of NaCl concentration, liquid-solid ratio and their interactions on the yield when the extraction time and temperature were fixed as 1.5 h and 70°C, respectively. An increase of the yield was observed with increasing NaCl concentration at first, but the trend was reversed when NaCl concentration reached a certain value. In the investigated range of liquid-solid ratio, the yield increased evidently with increasing liquid-solid ratio from 10 to 20 mL/g, but beyond 20 mL/g, the yield increased slowly as liquid-solid ratio ascended. Fig.1b depicted the effects of NaCl concentration and extraction temperature on the yield of SPMG with extraction time of 1.5 h and liquid-solid ratio of 20 mL/g. It was evident that the yield increased rapidly with the increasing extraction temperature from 60 to 75°C, but above 75°C, the yield decreased slowly with increasing extraction temperature. The effects of extraction temperature and liquid-solid ratio on the yield were depicted in Fig.1c, while NaCl concentration and extraction time were kept at a zero level (3% and 1.5 h). The yield increased slightly with the increasing liquid-solid ratio. The yield increased with an increase of extraction temperature at first, but beyond 75°C, the yield decreased as the temperature ascended.
Based on response surface plots, contour plots and variance analysis, the optimal extraction conditions can be predicted as follows: NaCl concentration 3.8%, liquid-solid ratio 20 mL/g, extraction temperature 66°C and extraction time 1.5 h. To ensure the predicted value was not biased toward the practical value, the optimum response value was tested by three additional independent experiments under the optimal conditions as mentioned above. The results indicated that the experimental value (7.87%) was not significantly different from the predicted value (7.93%), demonstrated the validation of the RSM model. The results of analysis also confirmed that the response model was adequate for reflecting the expected optimization, and the model of Eq.(4) was satisfactory and accurate.
The SPMG yield (7.87%) from the muscle of S.pharaonis was higher than other marine animal materials. Zhang and Lei (2008) extracted the glycoprotein from squid viscera and the yield was only 2.24%. Liu et al. (2011) extracted the glycoprotein from Sanguinolaria acutas and the yield was only 5.03%. Bao et al. (2011) extracted the glycoprotein from abalone visceral using ultrasound-assisted method and the yield was up to 6.97%, but still lower than the 7.87% of SPMG yield. All of those indicated that S.pharaonis muscle was a promising material to produce glycoproteins and the optimized conditions could be an important basis for developing low-cost, large-scale methods for industrial production of SPMG in the future.
Purification The purification of SPMG from S.pharaonis muscle was carried out by liquid chromatography. As shown in Fig.2a, SPMG was fractionated by DEAE-Cellulose 52 anion-exchange column eluted with a linear gradient of NaCl (0 ∼ 1 mol/L) in the phosphate buffer (0.05 mol/L, pH 7.4) at a flow rate of 1 mL/min, and was separated into two major glycoprotein peaks (SPMG-A and SPMG-B) having absorbance at 280 and 490 nm. Fraction SPMG-A was difficult to collect due to its low glycoprotein content, so we considered fraction SPMG-B as the main peak. Then SPMG-B was pooled (6 mL/each fraction), lyophilized and subjected to gel filtration chromatography on Sephadex G-100 for further purification, eluting as two peaks with phosphate buffer (0.05 mol/L, pH 7.4) at a flow rate of 0.3 mL/min (Fig.2b). The two peaks, named as SPMG-I and SPMG-II, were pooled, lyophilized and determined for their characterizations and antioxidant activities. The lyophilized SPMG-I and SPMG-II were fluffy white powders, freely soluble in water but not soluble in organic solvents such as ethanol, acetone.
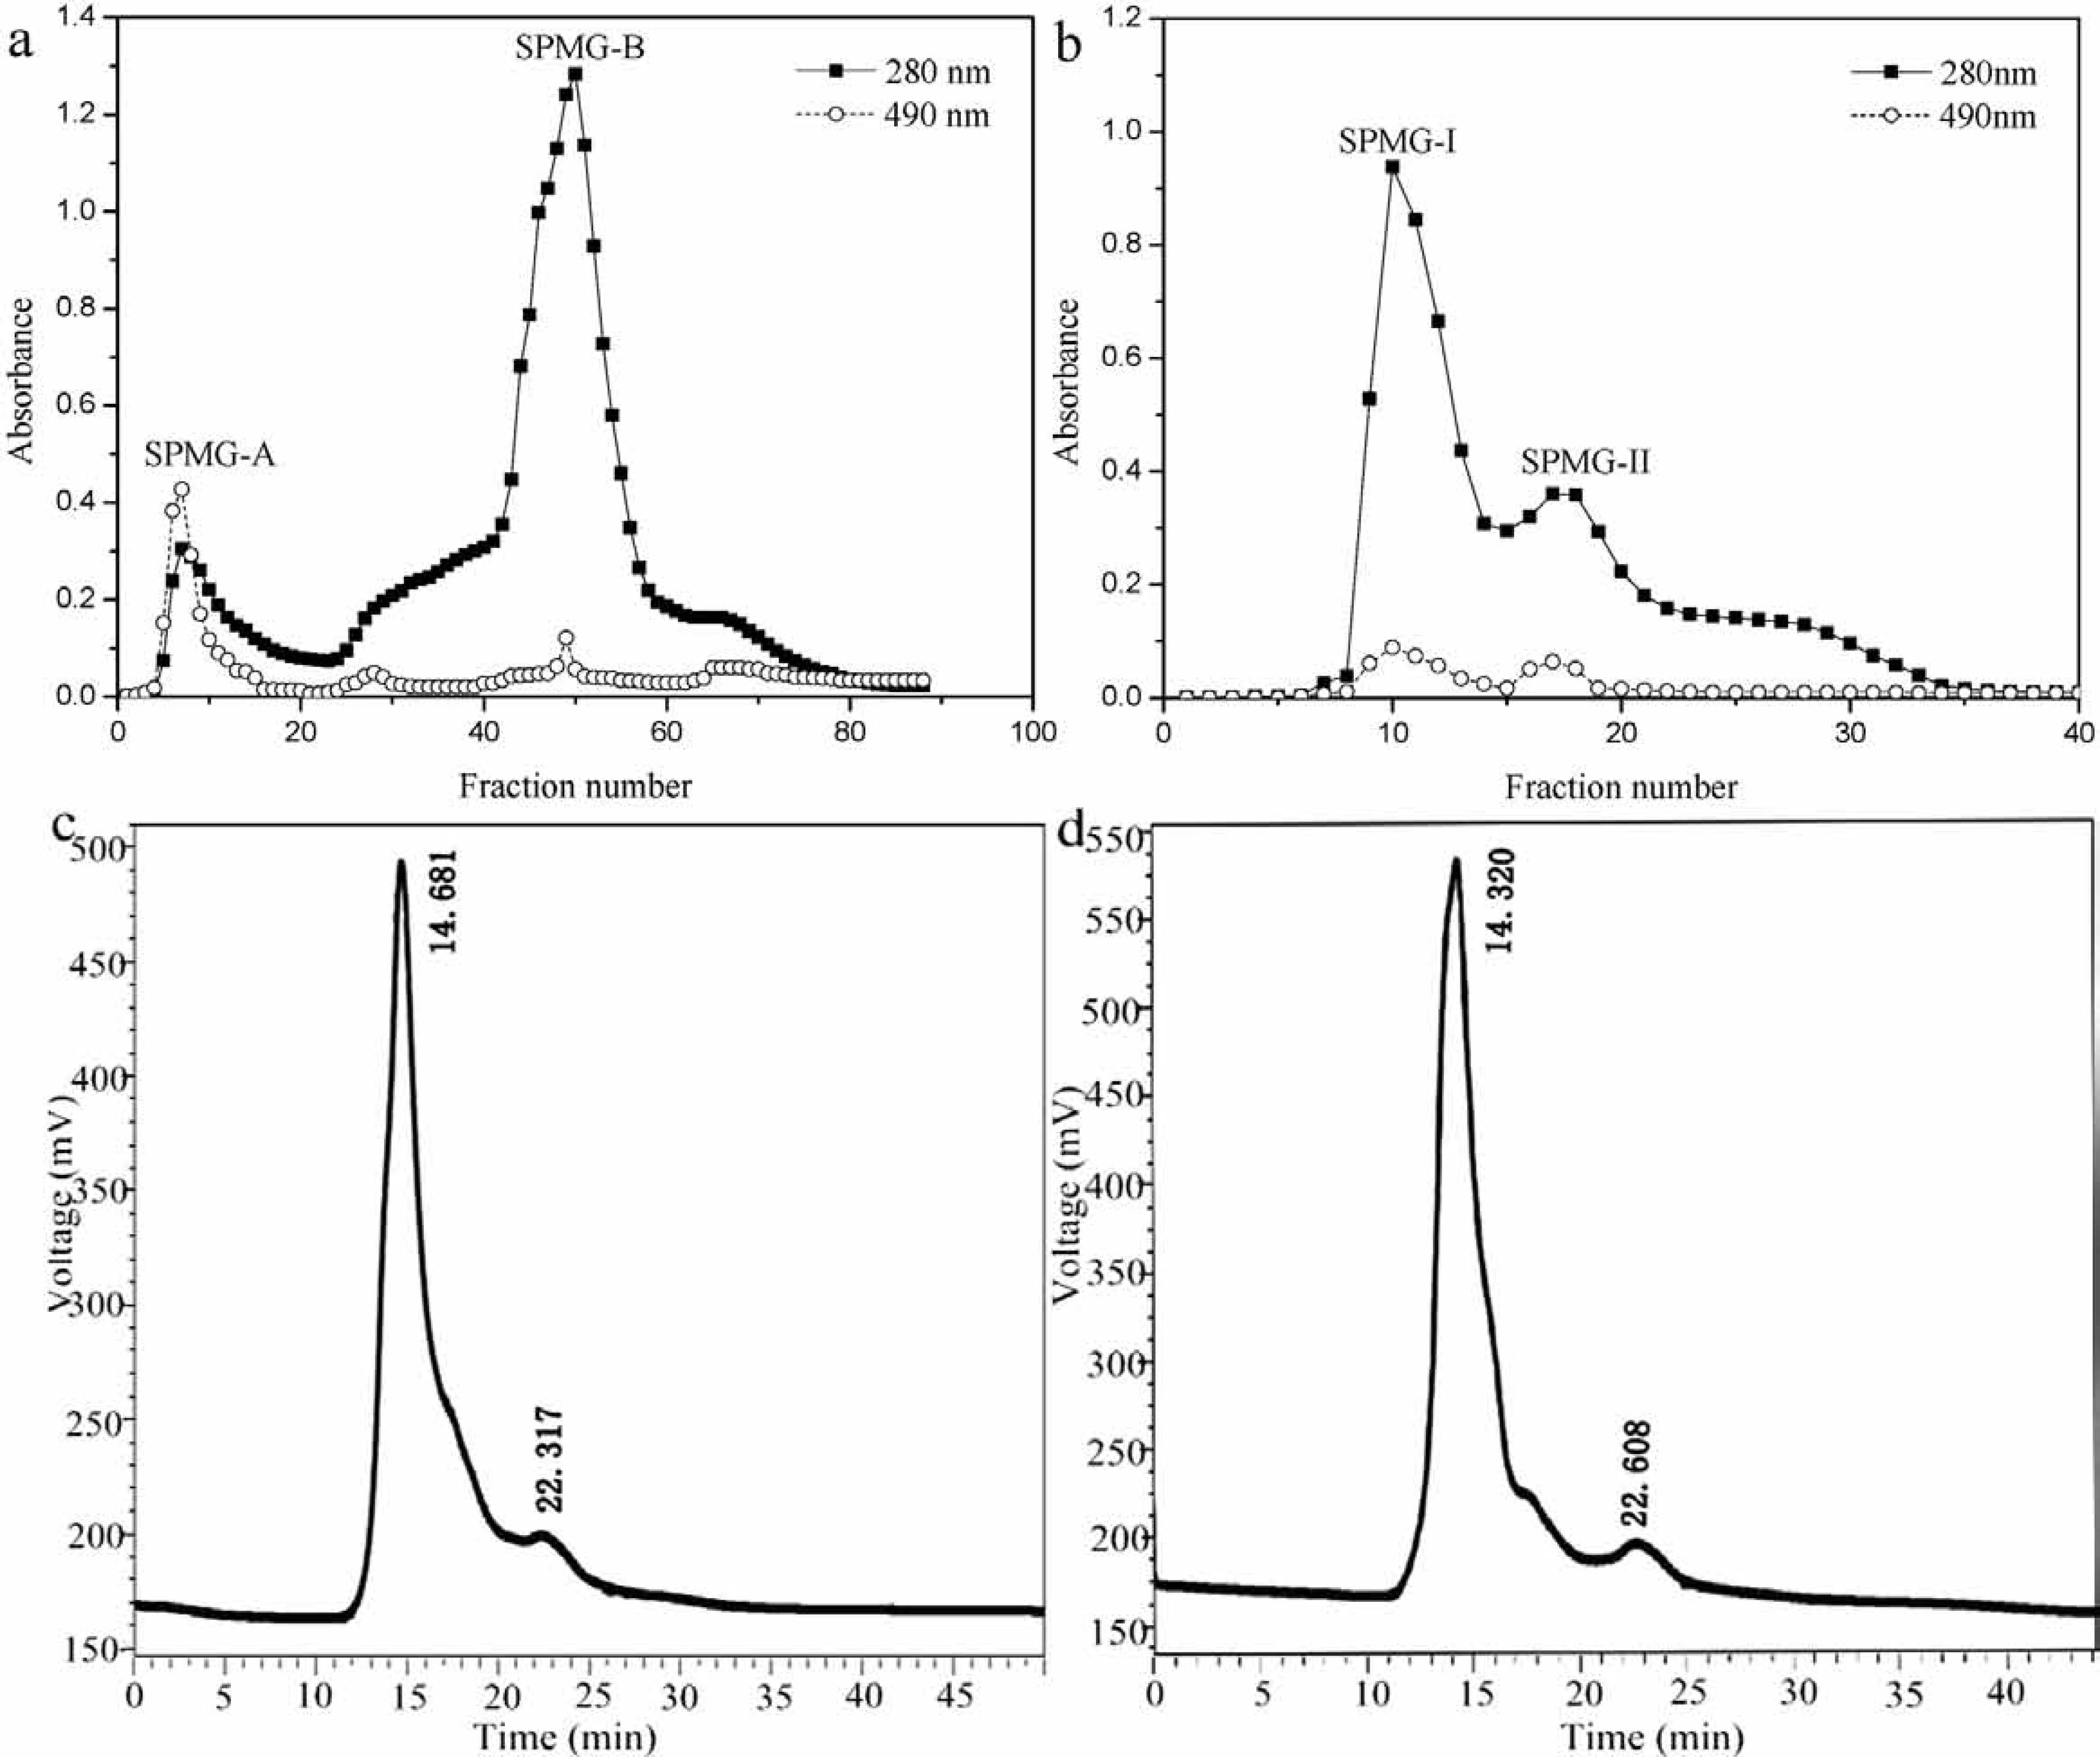
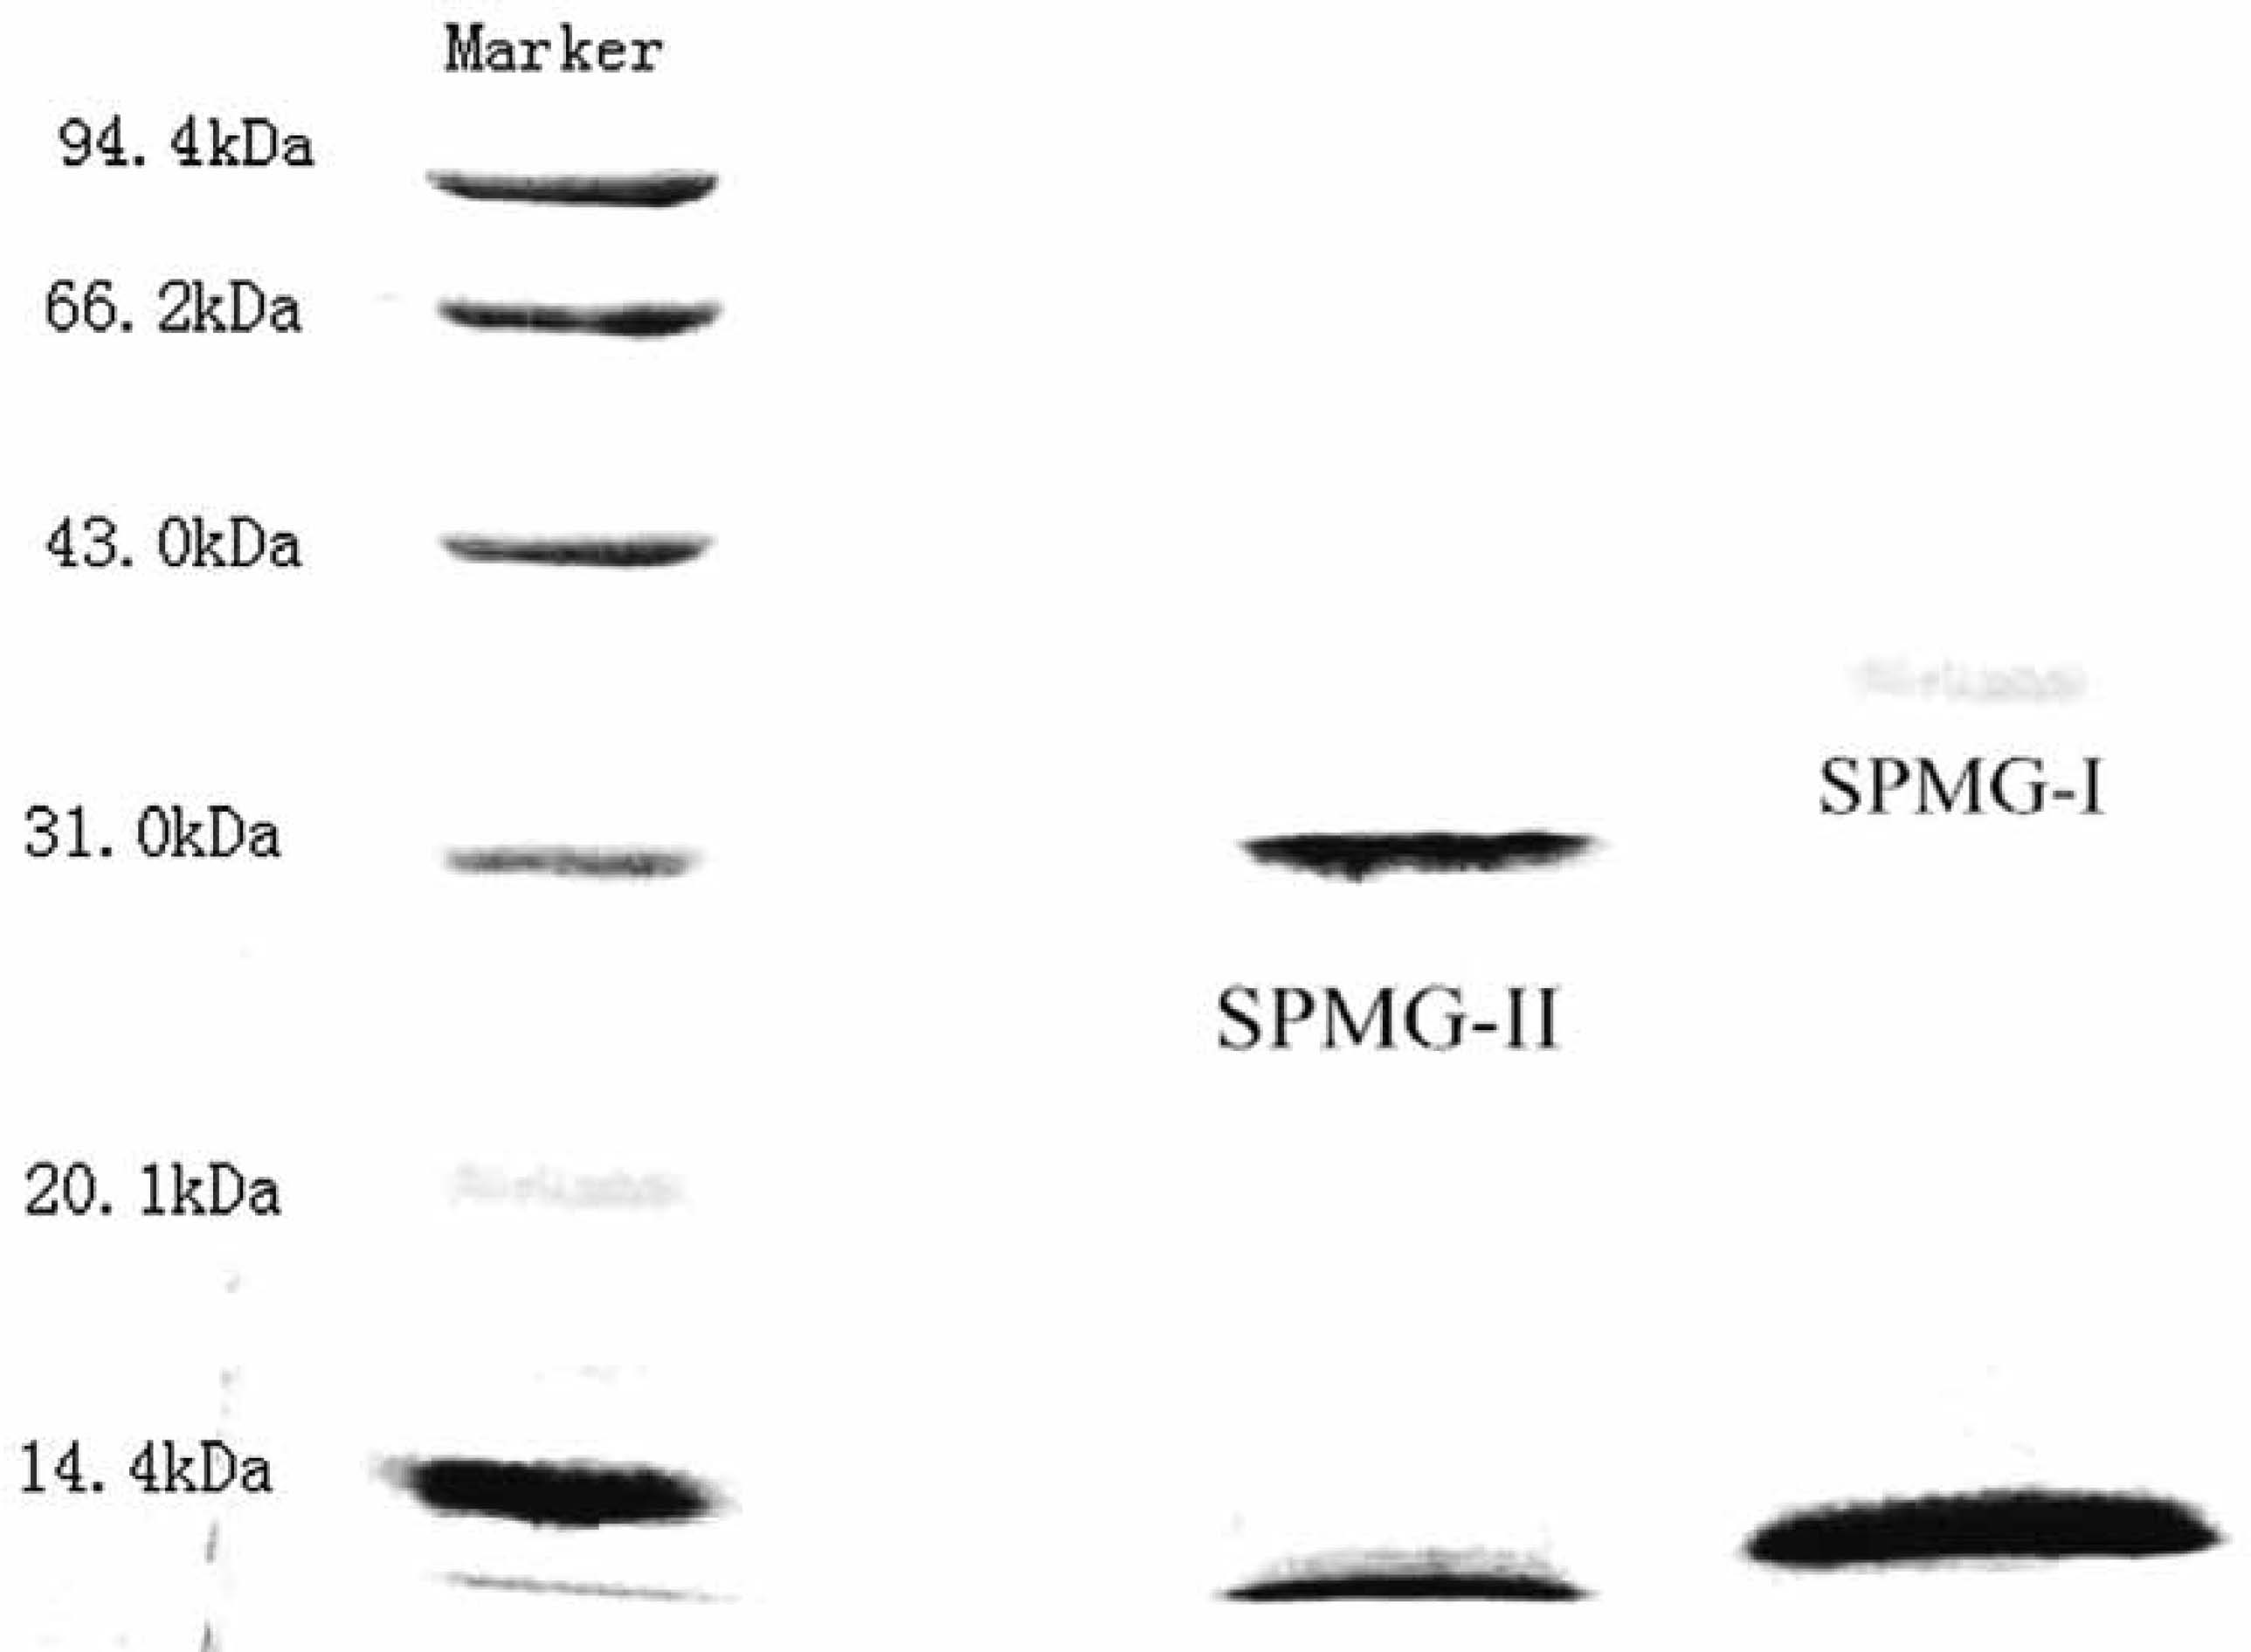
Homogeneity and molecular weight analysis The homogeneity of sample was proved by HPGPC. SPMG-I (Fig.2c) and SPMG-II (Fig.2d) showed a single and symmetrical peak, indicating SPMG-I and SPMG-II were homogeneous. The shoulder peak (RT: 22 min) is due to the solvent. In order to further confirm the homogeneity of SPMG-I and SPMG-II, another method was used. SDS-PAGE was often employed to determine the homogeneity and molecular weight of polysaccharide, protein or glycoprotein. As shown in Fig.3, SPMG-I and SPMG-II displayed a single band with apparent relative molecular weight of 42.5 kDa and 36.3 kDa, respectively. The electrophoretic bands of marker, SPMG-I and SPMG-II existed in the bottom of SDS-PAGE gel were caused by bromophenol blue (BPB), which is added to the sample solution to track the progress of the sample solution through the gel during the electrophoretic run (Wyckoff et al., 1977). The molecular weight of SPMG-I and SPMG-II were close to a neutral glycoprotein (NGP, 35.0 kDa) and a acidic glycoprotein (AGP-III, 43.0 kDa) from Ruditapes philippinarum (Wu et al., 2008) and slightly higher than an antioxidant glycoprotein (AIV-2, 27.2 kDa) from hydrolysate of Mustelus griseus muscle (Li et al., 2013).
FT-IR analysis The FT-IR spectrum recorded in the region of 4000 ∼ 500 cm−1 for SPMG-I and SPMG-II were presented in Fig.4. All samples showed a broad stretching intense characteristic peak at 3303.13 and 3307.31 cm−1 for the hydroxyl group and a weak peak at 2960.52 and 2960.97 cm−1 for C-H stretching vibration, which were typical absorption for carbohydrates (Li et al., 2013). The absorption peak at 2361.45 cm-1 observed only in SPMG-I was characteristic of CO2. The absorption peaks at 1654.42, 1655.35, 1543.90 and 1541.67 cm−1 were characteristic of IR absorptions for protein. The strong signals at 1654.42 and 1655.35 cm−1 were from the hydrolyzed carbonyl stretching of the amide functionality C=ONH (Li et al., 2013). The absorption bands at 1543.90 and 1541.67 cm−1 belonged to Amide II. The signals at 1000 ∼ 1250 cm−1 suggested the presence of C-O-H in glucosidal bond or C-O-C stretching vibration in ring (Jia et al., 2014). These results further confirmed that SPMG-I and SPMG-II were complexes of carbohydrate and protein.

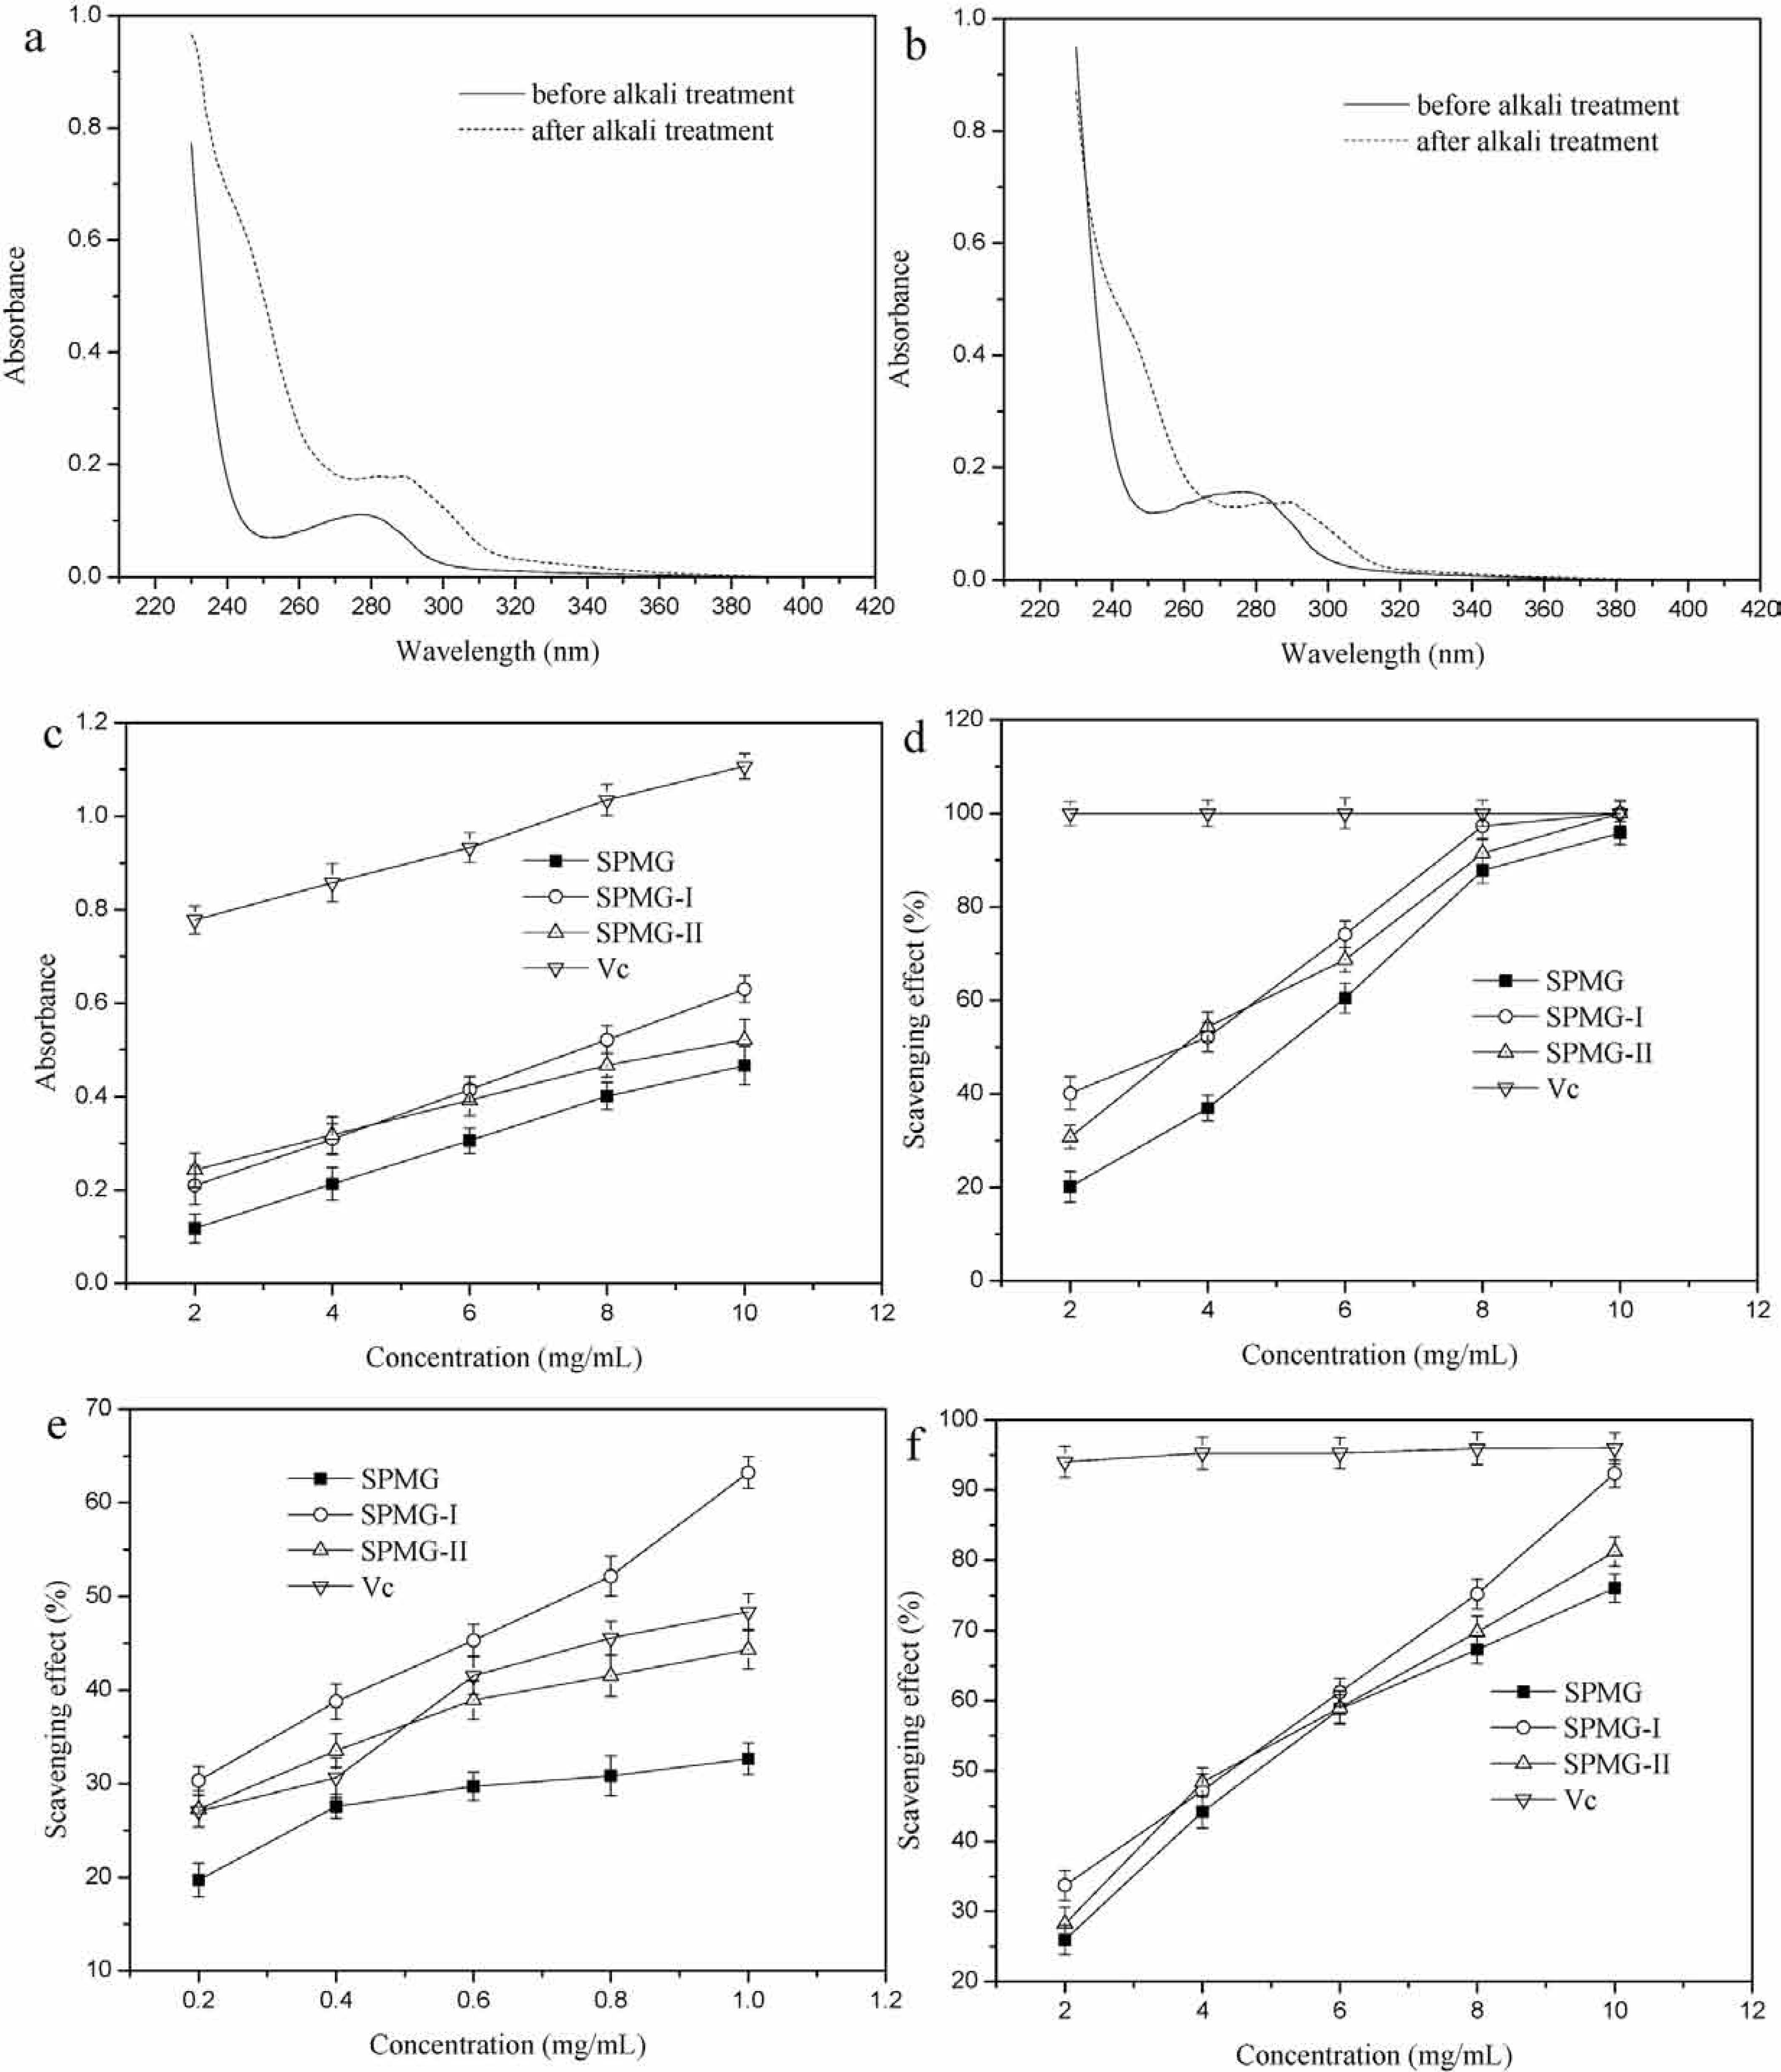
Linkage analysis Linkages in the structure of glycoprotein can be divided into two kinds based on their stability to alkali: O- and N-glycosidic linkage. Many examples of such glycosylation have been reported in known glycoproteins mainly from animal sources and recently from recombinant protein expression systems (including plants, fungi, insect and animal cells (Spiro, 2002). According to principle of β-elimination reaction, the N-glycosidic linkage always keeps stable under low concentration alkaline treatment, while the O-glycosidic linkage, involving hydroxyamino acids, is easy to be decomposed. The serine and threonine, alkali sensitive components of O-glycosidic linkage, form the α-aminoacrylic acid and α-aminocrotonic acid, respectively, which have an absorption peak at 240 nm. This method has been widely employed to analyze the type of glycosidic linkage in glycoprotein. UV scaning spectra of SPMG-I and SPMG-II with and without alkali treatment were shown in Fig.5a and Fig.5b, respectively. By comparison, the absorbance at 240 nm of SPMG-I and SPMG-II with alkali treatment significantly enhanced after the β-elimination reaction, suggesting the existence of O-glycosidic linkage. Li et al. (2013) reported the existence of O-glycosidic linkage in the glycoprotein from the hydrolysate of Mustelus griseus using β-elimination reaction.
Amino acid and monosaccharide compositions The total protein content of SPMG-I and SPMG-II were determined as 74.3% and 44.7%, respectively. The carbohydrate content of SPMG-II and SPMG-II were determined as 10.6% and 8.7%, respectively. This was one of the remarkable characteristics of glycoprotein, namely the content of protein was higher than carbohydrate. The amino acid and monosaccharide compositions of SPMG-I and SPMG-II were depicted in Table 3. Eight kinds of essential amino acids, including lysine, phenylalanine, methionine, threonine, isoleucine, leucine, tryptophan and valine, were detected in SPMG-I and SPMG-II. SPMG-I and SPMG-II were rich in glutamic acid, aspartic acid, leucine, arginine and lysine. The percentages of essential amino acids were 32.92% and 32.32%, respectively. The total percentages of aspartic acid and glutamic acid having acidic side chains were 39.52% and 35.74%, respectively. The results indicated that SPMG-I and SPMG-II had similar amino acid composition, which were also similar to glycoproteins from the Haliotis discus hannai Ino visceral (Bao et al., 2012). The monosaccharide compositions of SPMG-I and SPMG-II contained fucose, arabinose, xylose, mannose, gluose and galactose, based on GC-MS analysis. The results indicated glucose was the predominant monosaccharide composition of SPMG-I (57.18%) and SPMG-II (59.02%). The percentages of fucose and mannose were 20.02% and 13.06% (SPMG-I), and 12.08% and 16.93% (SPMG-II), respectively.
From the results above, we can induce the purified glycoproteins (SPMG-I and SPMG-II) should be acidic glycoproteins. The attachment of carbohydrate to protein can occur in different linkages involving a variety of amino acids that have often been found in many known glycoproteins. The based ones are O- and N-glycosidic linkage occurring exclusively through GlcNAc-b-Asn and GalNAc-a-Ser/Thr linkages, respectively. From the amino acid and monosaccharide compositions of glycoproteins (SPMG-I and SPMG-II), it could be seen that glucose was the predominant monosaccharide and relatively high contents of serine and threonine were found by amino acid analysis. It was in agreement with the previous results that O-glycosidic linkage existed in glycoproteins (SPMG-I and SPMG-II).
Reducing power assay Reducing power is an important index for evaluation of antioxidant activity of a compound. Reducing power is generally associated with the presence of reductones, which have been shown to exhibit antioxidant action by breaking the chain reactions by donating a hydrogen atom. Reductones are also reported to react with certain precursors of peroxide, thus preventing peroxide formation (Chen et al., 2012). Fig.5c showed the reducing powers of SPMG, SPMG-I and SPMG-II. For these samples, the reducing powers were all increased with the increasing concentration from 2 to 10 mg/mL. The reducing power of SPMG-I was higher than that of SPMG and SPMG-II, and all of them showed slightly lower reducing power than Vc. The reducing power of SPMG-I was close to SPMG at a concentration of 10 mg/mL. At the concentration of 10 mg/mL, the reducing power (absorbance at 700 nm) was 0.466, 0.631 and 0.521 for SPMG, SPMG-I and SPMG-II, respectively. Sun et al. (2010) obtained two kinds of glycoproteins (CYG-1 and CYG-2) from Chinese yam, and their reducing powers were much lower than 0.4 at the concentration of 10 mg/mL. Although the reducing power of the glycoproteins (SPMG, SPMG-I and SPMG-II) was slightly lower than that of Vc, the results showed that the glycoproteins (SPMG, SPMG-I and SPMG-II) had better reducing power and potential antioxidant properties.
Superoxide radical assay Although superoxide is a relative weak oxidant, it decomposes to produce stronger, reactive oxidative species, such as singlet oxygen and hydroxyl radicals. Furthermore, superoxide is also known to indirectly initiate lipid peroxidation as a result of H2O2 formation, creating precursors of hydroxyl radicals (Dahl and Richardson, 1978). Fig.5d depicted that the superoxide radical scavenging effect of SPMG, SPMG-I and SPMG-II. The scavenging effect of SPMG, SPMG-I and SPMG-II was concentration dependent at 2 ∼ 10 mg/mL. SPMG-I and SPMG-II showed slightly higher scavenging effect than SPMG and all of them showed lower scavenging effect than Vc at a low concentration. At the high concentration of 10 mg/mL, the scavenging effect of SPMG, SPMG-I and SPMG-II was 95.8, 100 and 100%, respectively, which is closed to Vc. It is known that Vc is a common antioxidant in food industry. The superoxide radical scavenging effect of glycoprotein from Crassostrea rivularis Gould by salt extracting was only 28% at the concentration of 10 mg/mL (Huang et al., 2011), evidently lower than that of glycoproteins (SPMG, SPMG-I and SPMG-II). The results showed that the glycoproteins (SPMG, SPMG-I and SPMG-II) had good superoxide radical scavenging activity, especially in the high concentration.
Hydroxyl radical assay Among the reactive oxygen species, the hydroxyl radical is the most reactive, and it induces severe damage to adjacent biological molecules by setting off free radical chain reactions. Thus, scavenging hydroxyl radicals is important for protecting human living systems (Samavati and Manoochehrizade, 2013). Fig.5e showed that the scavenging effects on hydroxyl radical of SPMG, SPMG-I and SPMG-II. They all exhibited a powerful scavenging effect on hydroxyl radical in a concentration dose-dependent within a relatively low concentration range of 0.2 ∼ 1 mg/mL. SPMG-I and SPMG-II showed a better scavenging effect than SPMG, and SPMG-I showed a better scavenging effect than SPMG-II and Vc. At the concentration of 1 mg/mL, the scavenging effect on hydroxyl radical of SPMG, SPMG-I, SPMG-II and Vc was 32.6, 63.2, 44.3, and 48.4%, respectively. The hydroxyl radical scavenging effect of glycoprotein from Crassostrea rivularis Gould was only 10% at the concentration of 2 mg/mL (Huang et al., 2011). The scavenging effect on hydroxyl radical of glycoproteins (PDG, PDG1 and PDG3) obtained from Polygonatum odoratum was only 8.1, 17.93, and 14.85%, respectively at the concentration of 10 mg/mL (Wang et al., 2015). The above results demonstrated the glycoproteins (SPMG, SPMG-I and SPMG-II) possessed higher scavenging activity to hydroxyl radical.
DPPH radical assay DPPH radical is a stable radical source that shows maximum absorption at 517 nm in methanol and widely used method to evaluate the free radical scavenging activities of natural compounds (Nie et al., 2007). The effect of antioxidants on DPPH radical scavenging was conceived to be due to their electron or hydrogen donating ability. DPPH radical will be scavenged and the absorbance at 517 nm will be reduced with a noticeable color change from purple to yellow when DPPH radical encounters antioxidants. In this experiment, the scavenging effects of glycoproteins (SPMG, SPMG-I and SPMG-II) on DPPH radical were shown in Fig.5f. The results indicated SPMG, SPMG-I and SPMG-II showed in all concentrations dose-dependent DPPH radical scavenging activities within the concentration range of 2 ∼ 10 mg/mL. SPMG-I and SPMG-II showed a better DPPH radical scavenging effect than SPMG, indicated that purified process can enhance the antioxidant activity. Furthermore, in the higher concentration (10 mg/mL), SPMG-I exhibited very high DPPH radical scavenging activity (92.3%), which was higher than that of SPMG-II (81.2%) and SPMG (76.1%). In the present study, the glycoproteins (SPMG, SPMG-I and SPMG-II) showed a noticeable effect on scavenging DPPH free radicals compared with the glycoproteins obtained from Chinese yam (Sun et al., 2010) and Crassostrea rivularis Gould (Huang et al., 2011). The results indicated that the glycoproteins (SPMG, SPMG-I and SPMG-II) had a excellent scavenging DPPH free radicals ability, especially at high concentration.
Discussion about the possible antioxidant mechanism Nowadays, antioxidants receive noticeable attention due to the ability to reduce risks for a number of chronic diseases and preserve foodstuffs by retarding deterioration, rancidity and/or discoloration caused by oxidation. Many experts put their research eyes on finding more natural antioxidants as alternatives to synthetic ones such as BHT, BHA and TBHQ. However, most attentions were given to proteins and polysaccharides rather than glycoproteins and little information is available on the antioxidant mechanism of glycoproteins. In this paper, the results showed that glycoproteins (SPMG, SPMG-I and SPMG-II) had better reducing power and certain scavenging ability on eliminating superoxide, hydroxyl and DPPH radical, and revealed good potential antioxidant properties.
Our results indicated that SPMG-I had higher antioxidant ability than SPMG and SPMG-II. The difference of antioxidant activity might be attributed to their slight differences in characterization. The recent studies indicated that antioxidant activity of glycoproteins was associated with glycosidic linkage, the content of protein and carbohydrate, molecular weight, compositions of amino acid and monosaccharide, etc. (Fuad, 2006; Behera et al., 2005; Liu and Zhao, 2011; Heo and Lim, 2004; Lo et al., 2011; Dahl and Richardson, 1978). Fuad (2006) reported that the O-glycosidic linkage was not important for in vitro bioactivity, but it played an important role in vivo bioactivity. However, N-glycosidic linkage was opposite to O-glycosidic linkage. It has been reported that the superoxide radical scavenging activity of polysaccharide extracts appears to depend on the amount of protein or peptide present in the form of polysaccharide-protein or polysaccharide-peptide complexes, lower polysaccharide/protein or polysaccharide/ peptide ratios can exhibit the excellent scavenging ability (Behera et al., 2005). Our results indicated that the increase of protein and carbohydrate contents of glycoproteins through consecutive separation and purification can lead to the improvement of DPPH radical scavenging activity, which is in good agreement with other reports in the literature (Li et al., 2013; Liu and Zhao, 2011). Other studies reported that glycoproteins with high molecular weights typically have greater biological activity than low-molecular weight glycoproteins (Heo and Lim, 2004), this may be a possible explanation that SPMG-I had better antioxidant activity than SPMG-II. The differences in amino acid and monosaccharide compositions may have an impact on antioxidant activity of S.pharaonis glycoproteins. In reported papers, the composition of monosaccharide was the most significant factor associated with antioxidant activity (Lo et al., 2011). Some studies reported that the levels of galactose, arabinose, mannose, and gluose were important factors associated with antioxidant ability (Lo et al., 2011; Dahl and Richardson, 1978). The discussions above are good explanation that SPMG-I has better antioxidant activity than SPMG and SPMG-II. However, the precise explanation of antioxidant mechanism underlying the free radical scavenging activity exerted by S.pharaonis glycoproteins is still not fully understood. The deformed glycoprotein cannot act as a scavenger because of changes in its three-dimensional structure and it is believed that the bioactivity of glycoprotein is closely related to the unique chemical properties and structural characteristics (Heo & Lim, 2004). Our further studies will focus on determination of the structure and bioactivity of the purified glycoproteins and the relationship between structure and bioactivity, which has already been underway in our lab.
Conclusion
The present study was the first report on the extraction, purification, characterization and antioxidant activity of S.pharaonis glycoprotein. The RSM was employed to optimize the extraction conditions of the crude glycoprotein (SPMG) from S.pharaonis muscle. The optimal extraction conditions were obtained as follows: NaCl concentration 3.8%, liquid-solid ratio 20 mL/g, extraction temperature 66°C and extraction time 1.5 h. Under the optimized conditions, the SPMG yield was 7.87%. SPMG contained two glycoprotein fractions (SMPG-I and SPMG-II) after being purified by DEAE-Cellulose 52 and Sephadex G-100 column chromatography. The purified glycoproteins (SPMG-I and SPMG-II) were confirmed of high purity and the average molecular weights were 42.5 kDa and 36.3 kDa, respectively. Moreover, SPMG-I and SPMG-II were characterized by automated amino acid analyser, UV spectrometer, FT-IR and GC-MS. The present study revealed that SPMG, SPMG-I and SPMG-II exhibited a certain antioxidant activity. Therefore, the glycoproteins from S.pharaonis muscle may be of potential utility in the health food and pharmaceutical industries as a source of natural antioxidants as opposed the toxic synthetic antioxidants such as BHT, BHA and TBHQ.
Acknowledgements This work was supported by the Central Government Special fund on Local University (grant number 0003015119), the National Department of Guangdong Province (grant number 2014B04040471), the National Natural Science Foundation of China (grant number 31201999), the Natural Science Foundation of Guangdong Province (grant number 2015A030310406), the Natural Science Foundation of Guangdong Province (grant number 2014A030307022), the Special Support Program of Guangdong Province (grant number 2014TQ01N621), the Foundation for Distinguished Young Teachers in Higher Education of Guangdong Province (grant number Yq2014115), the Foundation of Education Bureau of Guangdong Province (grant number 2014KTSCX159), the Technology Program of Guangdong Province (grant number 2015A030302089) , the Technology Program of Zhanjiang of China (grant number 2014A03011), the Project on the Integration of Industry, Education and Research of Guangdong Province (grant number 2013B090500036), the Programs for Financial Fund's Competitive Distribution of Zhanjiang of China (grant number 2013A05004), the Scientific Research Foundation of Lingnan Normal University of China (grant number HL1402), the Ph.D Programs Foundation of Lingnan Normal University of China (grant number ZL1313) and the Opening Foundation of Key Laboratory of Tropical Marine Bio-resources and Ecology, Chinese Academy of Sciences (LMB131006).
References
- Amonrat, T., Soottawat, B., and Wonnop, V. (2006). Chemical composition and thermal property of cuttlefish (Sepia pharaonis) muscle. J. Food Comp. Anal., 19, 127-133.
- Bao, Y.M., Hou, F., and Li, B.F. (2012). Preliminary configuration identification and immuno-enhancing activity of Haliotis discus hannai Ino visceral glycoprotein. Chinese J. Mar. Drugs, 4, 20-24.
- Bao, Y.M., Tao, Y., Hou, H., Zhao, X., and Li, B.F. (2011). Study on the ultrasound-assisted extraction and purification of abalone visceral glycoprotein. Food Ferment. Ind., 37, 11-15.
- Behera, B.C., Verma, N., Sonone, A., and Makhija, U. (2005). Evaluation of antioxidant potential of the cultured mycobiont of a lichen Usnea ghattensis. Phytother. Res., 1, 58-64.
- Bradford, M.M. (1976). A rapid and sensitive method for the quantitation of microgram quantities of protein utilizing the principle of protein-dye binding, Anal. Chem., 7, 248-254.
- Chen, J.J., Zhang, T., Jiang, B., Mu, W.M., and Miao, M. (2012). Characterization and antioxidant activity of Ginkgo biloba exocarp polysaccharides. Carbohyd. Polym., 87, 40-45.
- Dahl, M. K. and Richardson, T. (1978). Photogeneration of superoxide anion in serum of bovine milk and in model systems containing riboflavin and amino acid. J. Dairy Sci., 61, 400-407.
- Dubois, M., Gilles, K.A., Hamilton, J.K., Rebers, P.A., and Smith, F. (1956). Colorimetric method for determination of sugars and related substances. Anal. Chem., 28, 350-356.
- Fuad, F. (2006). The role of O-linked and N-linked oligosaccharides on the structure-function of glycoprotein hormones: development of agonists and antagonists. BBA-Biomembranes, 4, 560-567.
- Giovanni, M. (1983). Response surface methodology and product optimization. Food Technol., 37, 41-45.
- Grajek, W., Olejnik, A., and Sip, A. (2005). Probiotics, prebiotics and antioxidants as functional foods. Acta. Biochim. Pol., 52, 665-671.
- Hinneburg, I., Damien, D.H.J., and Hiltunen, R. (2006). Antioxidant activities of extracts from selected culinary herbs and spices. Food Chem., 97, 122-129.
- Huang, L.Z., Zhou, M., Hu, X.Q., Liang, C., and Wu, H.M. (2011). Anti-oxidant activities in vitro of glycoprotein from Crassostrea rivularis Crould by different extraction methods. J. Guangdong Ocean Univ., 3, 95-98.
- Heo, K.S. and Lim, K.T. (2004). Antioxidative effects of glycoprotein isolated from Solanum nigrum L. J. Med. Food, 3, 349-357.
- Jia, X., Ding, C., Yuan, S., Zhang, Z., Chen, Y., Du, L., and Yuan, M. (2014). Extraction, purification and characterization of polysaccharides from Hawk tea. Carbohyd. Polym., 99, 319-324.
- Laemmli, U.K. (1970). Cleavage of structural proteins during the assembly of the head of bacteriophage T4. Nature, 227, 680-685.
- Li, A., Huang, N., Lu, F., and Hou, D. (2011). Antioxidant and immunoregulatory activity of different polysaccharide fractions from tuber of Ophiopogon japonicus. Carbohyd. Polym., 3, 1273-1280.
- Liu, Q., Fan, X.P., Wu, H.M., and Hu, X.Q. (2011). Extraction of glycoprotein from Sanguinolaria Acutas and its anti-CNE-2Z activity. Mod. Food Sci. Technol., 27, 260-261.
- Lee, W.C., Yusof, S., Hamid, N.S.A., and Baharin, B.S. (2006). Optimizing conditions for enzymatic clarification of banana juice using response surface methodology (RSM). J. Food Eng., 73, 55-63.
- Lo, T.C.T., Chang, C.A., Chiu, K.H., Tsay, P.K., and Jen, J.F. (2011). Correlation evaluation of antioxidant properties on the monosaccharide components and glycosyl linkages of polysaccharide with different measuring methods. Carbohyd. Polym., 1, 320-327.
- Liu, T.X. and Zhao. M.M. (2011). Physical and chemical modification of SPI as a potential means to enhance small peptide contents and antioxidant activity found in hydrolysates. Innov. Food Sci. Emerg., 4, 677-683.
- Laemmli, U.K. (1970). Cleavage of structural proteins during the assembly of the head of bacteriophage T4. Nature, 227, 680-685.
- Li, Y.H., Jiang, B., and Zhang, T. (2008). Antioxidant and free radical-scavenging activities of chickpea protein hydrolysate (CPH). Food Chem., 106, 444-450.
- Li, Z.R., Wang, B., and Chi, C.F. (2013). Purification and characterization of an antioxidant glycoprotein from the hydrolysate of Mustelus griseus. Int. J. Mol. Sci., 52, 267-274.
- Minton, J.W., Walsh, L.S., and Lee, P.G. (2001). First multigeneration culture of the tropical cuttlefish Sepia pharaonis Ehrenberg, 1831. Aquacult. Int., 9, 375-392.
- Nie, S.P., Xie, M.Y., Fu, Z.H., Wang, Y.Q., and Yan, A.P. (2008). Study on the purification and chemical compositions of tea glycoprotein. Carbohyd. Polym., 71, 626-633.
- Nie, S.P., Xie, M.Y., and Wang, Y.X. (2005). Preparation of tea glycoprotein and its application as a calibration standard for the quantification and molecular weight determination of tea glycoprotein in different tea samples by high-performance gel-permeation chromatography. Anal. Bioanal. Chem., 4, 680-686.
- Nie, S.P., Xie, M.Y., Zhou, P., and Cao, S.W. (2007). In vitro antioxidative and anticancer activities of tea glycoprotein in green tea. Eur. Food Res. Technol., 224, 437-442.
- Sin, H.N., Yusof, S., Sheikh Abdul Hamid, N., and Rahman, R.A. (2006). Optimization of enzymatic clarification of sapodilla juice using response surface methodology. J. Food Eng., 73, 313-319.
- Spiro, R.G. (2002). Protein glycosylation: Nature, distribution, enzymatic formation, and disease implications of glycopeptide bonds. Glycobiology, 4, 43-56.
- Samavati, V. and Manoochehrizade, A. (2013). Polysaccharide extraction from Malva sylvestris and its anti-oxidant activity. Int. J. Mol. Sci., 60, 427-436.
- Sun, Y.J., Han, T., Li, L.P., and Yang, R. (2010). Antioxidant activity in vitro of glycoprotein from Chinese Yam. Acta. Hortic Sin., 6, 1009-1014.
- Vliegenthart, J.F.G. (1998). Studies on the structure of glycoproteins. Carbohyd. Polym., 4, 427-429.
- Wu, H.M., Ye, Z.G., Fan, X.P., Lian, H.H., Lei, X.L., and Hu, X.Q. (2008). Studies on the isolation, purification and physical chemistry properties of the glycoprotein from Ruditapes philippinarum. J. Chinese Inst. Food Sci. Technol., 5, 81-85.
- Witschi, H.P. (1986). Enhanced tumor development by butylated hydroxy toluene (BHT) in the liver, lung and gastrointestinal tract. Food Chem. Toxicol., 24, 1127-1130.
- Wyckoff, M., Rodbard, D., and Chrambach, A. (1977). Polyacrylamide gel electrophoresis in sodium dodecyl sulfate-containing buffers using multiphasic buffer systems: Properties of the stack, valid Rf-measurement, and optimized procedure. Anal. Biochem., 78, 459-482.
- Wu, S.H., Gong, G.L., Wang, Y.Y., Li, F., Jia, S.Y., and Qin, F.X. (2013). Response surface optimization of enzyme-assisted extraction polysaccharides from Dictyophora indusiata. Int. J. Biol. Macromol, 61, 63-68.
- Wang, Y., Hu, Y.H., Chen, Q.Z., Yin, L.Y., Zhang, X.J., and Liu, J.S. (2015). Purification of glycoprotein from Polygonatum odoratum and its antioxidant activity in vitro. Food Sci., 2, 52-57.
- Zhang, J.S. and Lei, X.L. (2008). Extraction of glycoprotein from Squid Viscera and its immunomodulation. Mod. Food Sci. Technol., 24, 167-169.
- Zheng, Y., Guo, Z., and Cai, Z. (2009). Combination of beta-elimination and liquid chromatography/quadrupole time-of-flight mass spectrometry for the determination of O-glycosylation sites. Talanta, 78, 358-363.