Introduction
Cooking could make food palatable, digestible and microbiologically safe. Many physical and chemical changes often occurred during cooking which influenced the final organoleptic properties and nutritional value of cooked food including texture, color and aroma development (Mora et al., 2011; Singhal et al., 2012). Nutrients in foods usually loss to different extent depending on cooking method (Mora et al., 2011). As muscle-based foods usually consumed in cooked form, the influence of cooking technique and procedure on the quality characteristic of muscle products is of great importance and attracting more attention in recent years. The final internal temperature is one of the key factors that affect the eating quality and flavor of cooked foods (Modzelewska-Kapitula et al., 2012). The juiciness of meat was closely related to the final centre temperature (Aaslyng et al., 2003). In addition, cooking loss and texture variation of muscle were largely affected by final meat temperature (Li et al., 2013).
Steam cooking is widely used in household and industrial cooking process and become more and more popular in daily life, because it is a convenient and healthy cooking method with typical characteristics of color, flavor, texture, palatability and nutrients retention (Kahlon et al., 2008). Steam cooking resulted in significantly greater retention of vitamin C and DPPH radical-scavenging activity in red cabbage compared with stir-frying and boiling (Xu et al., 2014) and better preserved glucosinolates and phenolic compounds in Brassica rapa (Francisco et al., 2010). It was also reported that steam cooking could enhance anticancer potential of ginger on human Hela cancer cells (Cheng et al., 2011) and in vitro bile acid binding of some vegetables (Kahlon et al., 2008).
Shrimp (Metapenaeus ensis) is an important fisheries species and widely consumed throughout Asia due to its distinctive delicious taste and high nutritional value. Texture and taste were regarded as most important quality attributes which influences consumer acceptability of cooked shrimp. The taste active components including free amino acid, nucleotides, and peptides have been considered important contributor to the taste of muscle foods (Sasaki et al., 2007). Although thermal processing on taste-related components of porcine muscle (Sasaki et al., 2007), beef muscle (Ishiwatari et al., 2013), crab (Chen and Zhang, 2007), and squid (Rosas-Romero et al., 2010) were widely reported, the influence of thermal processing on taste of shrimp is still unclear.
Though changes in protein compositions and physical changes of shrimp during boiling have been described (Benjakul et al., 2008; Erdogdu et al., 2004; Niamnuy et al., 2007; Niamnuy et al., 2008), steam cooking is usually regarded as an useful method to cook shrimp in comparision with other methods including oven baking and boiling in terms of nutrients retention. Therefore, the objective of present study is to evaluate the influence of steaming end center temperature on the textural properties and taste compounds of steamed shrimp, providing information for improvement of quality of cooked shrimp.
Materials and Methods
Materials Live shrimps (Metapenaeus ensis) were purchased from a local market (Wuxi, Jiangsu Province) and transported to the laboratory within 30 min. Average weight of shrimp was 16 g with individual weighting from 14 g to 18 g.
5′-guanosine monophosphate (GMP), 5′-adenosine monophosphate (AMP), 5′-inosine monophosphate (IMP), inosine (Ino) and hypoxanthine (Hx) were purchased from Sigma Chemical Co. (St. Louis, MO, USA). All other chemicals were of analytical grade and purchased from Sinopharm Chemical Reagent Co., Ltd (Shanghai, China).
Cooking treatment After washing with tap water, raw shrimps were divided into five groups. Each group of approximately 450 g was subjected to different steam cooking treatments with an electric steaming box (Fotile SCD26-D1) to achieve different internal temperatures of 75°C, 80°C, 85°C, 90°C, 95°C, respectively. The safe minimium internal cooking temperature for shellfish is 74°Ci). For monitoring the internal temperature of shrimp, a TP9000 digital thermometer (Toprie Electronic Co., Ltd, China) was used. After inserting the thermometer probe with diameter about 1 mm into the middle through the thickest part of the shrimp, the shrimp with probe was then placed at the central of the group of shrimps. The shrimps were removed immediately when the internal temperature of shrimp reached the preseted temperature and cooled to room temperature. And then the shrimps were stored in 4°C refrigerator for further analysis within 1 day. The raw shrimp without cooking was taken as control. All the cooking experiments were conducted at least in triplicate. Each group of approximately 25 whole deshelled and deheaded shrimps were finely minced and mixed homogenously, and then used for determination of amino acid, nucleotide, and moisture.
Moisture content determination Water content in each group of sample was determined by drying 3 – 5 g of sample at 105°C to a constant weight (AOAC, 1998).
Cooking loss Each shrimp before and after steaming was surface-dried by using filter paper to wipe up water on the surface of the shrimps and weighted using an analytical balance (Metler AE100-0.01). The cooking loss was caculated as follows:
W1-weight before cooking; W2-weight after cooking.
Color measurement Color measurement was performed according to the method of Parisenti et al. (2011) with slight modification using the L*, a*, b* mode of CIE with a chromometer (Model CR-400, Konica Minolta, Osaka, Japan). The color of shell of the second segment of shrimp and the middle section of shrimp muscle were measured. The measurement of L* (indicator of lightness), a* (indicator of redness/greenness), b* (indicator of yellowness/blueness) was performed in six replications.
Texture analysis Texture analysis was performed as described by Niamnuy et al. (2007) with some modification. Meat were removed from raw and cooked samples, and equilibrated to room temperature prior to analysis. For texture profile analysis (TPA), the second segment of shrimp was cut into a section with length about 1.5 cm. TA.XTPlus texture analyser (Stable Micro Systems, Surrey, UK) equipped with a cylindrical P/25 probe of 25 mm in diameter was used. The samples were compressed twice to 70% of their original height. Force-time deformation curves were obtained with a 25 kg load cell applied at a cross-head speed of 1 mm/s. Hardness, springiness, cohesiveness, and chewiness were calculated using the Texture Expert software version 1.22 (Stable Micro Systems, Surrey, UK).
For Warner-Bratzler shear force measurement, TA.XTPlus texture analyser with a shearing probe (A/CKB) was used. Samples were perpendicularly sheared to the second segment of shrimp meat at a constant speed of 2.0 mm/s with a shearing probe (A/CKB) to 80% of their original height. The maximum force (N) recorded throughout the press was recorded as the shear force. The results were expressed as the average of six measurements.
Free amino acids analysis Finely ground samples (5 g) were mixed with 20 mL of 5% (w/v) TCA solution and sonicated for 50 min. The homogenates were transferred into a 25-mL volumetric flask and made up to 25 mL with TCA solution, then filtered through a filter paper. The filtrate was centrifuged at 15,000 g for 10 min and the obtained supernatant was used for amino acids analysis after pre-column derivation with o-phthaldialdehyde (OPA) by reversed-phase high-performance liquid chromatography (RP-HPLC) using an Agilent 1100 HPLC system.
Nucleotide analysis The nucleotides were extracted and determined according to the method of Chen and Zhang with slight modification (Chen et al., 2007). Finely ground samples (5 g) were homogenized with 25 mL of 0.6 M cold perchloric acid (PCA) solution and sonicated for 5 min. The supernatant after centrifugation at 8,000 g for 10 min (4°C) was collected and the pH was adjusted to 6.5 – 6.8 with 1 M potassium hydroxide (KOH) solution. The resulting mixture was kept for 30 min at 4°C to precipitate potassium perchlorate and then filtered through a filter paper. The filtrate was made up to 25 mL and centrifuged at 15,000 g for 10 min. The obtained supernatant was used for nucleotide analysis by high-performance liquid chromatography (Agilent 1100) with an intersil ODS-3 column (250 mm × 4.6 mm) and UV detector at 254 nm. The mobile phase A (0.05 M phosphate buffer, pH 7.0) and B (methanol) at rate of 95:5 were used with a flow rate of 1.0 mL/min. The Nucleotide including GMP, AMP, IMP, Hx, and Inosine were identified and quantified by comparision with the retention times and peak areas of each nucletide standard.
Statistical analysis Results were expressed as the mean of at least three determinations. Statistical analysis was performed using SPSS 11.0 for windows software (SPSS Inc., Chicago, Illinois, USA). Comparisons of group means were obtained using Duncan's multiple range test.
Results and Discussion
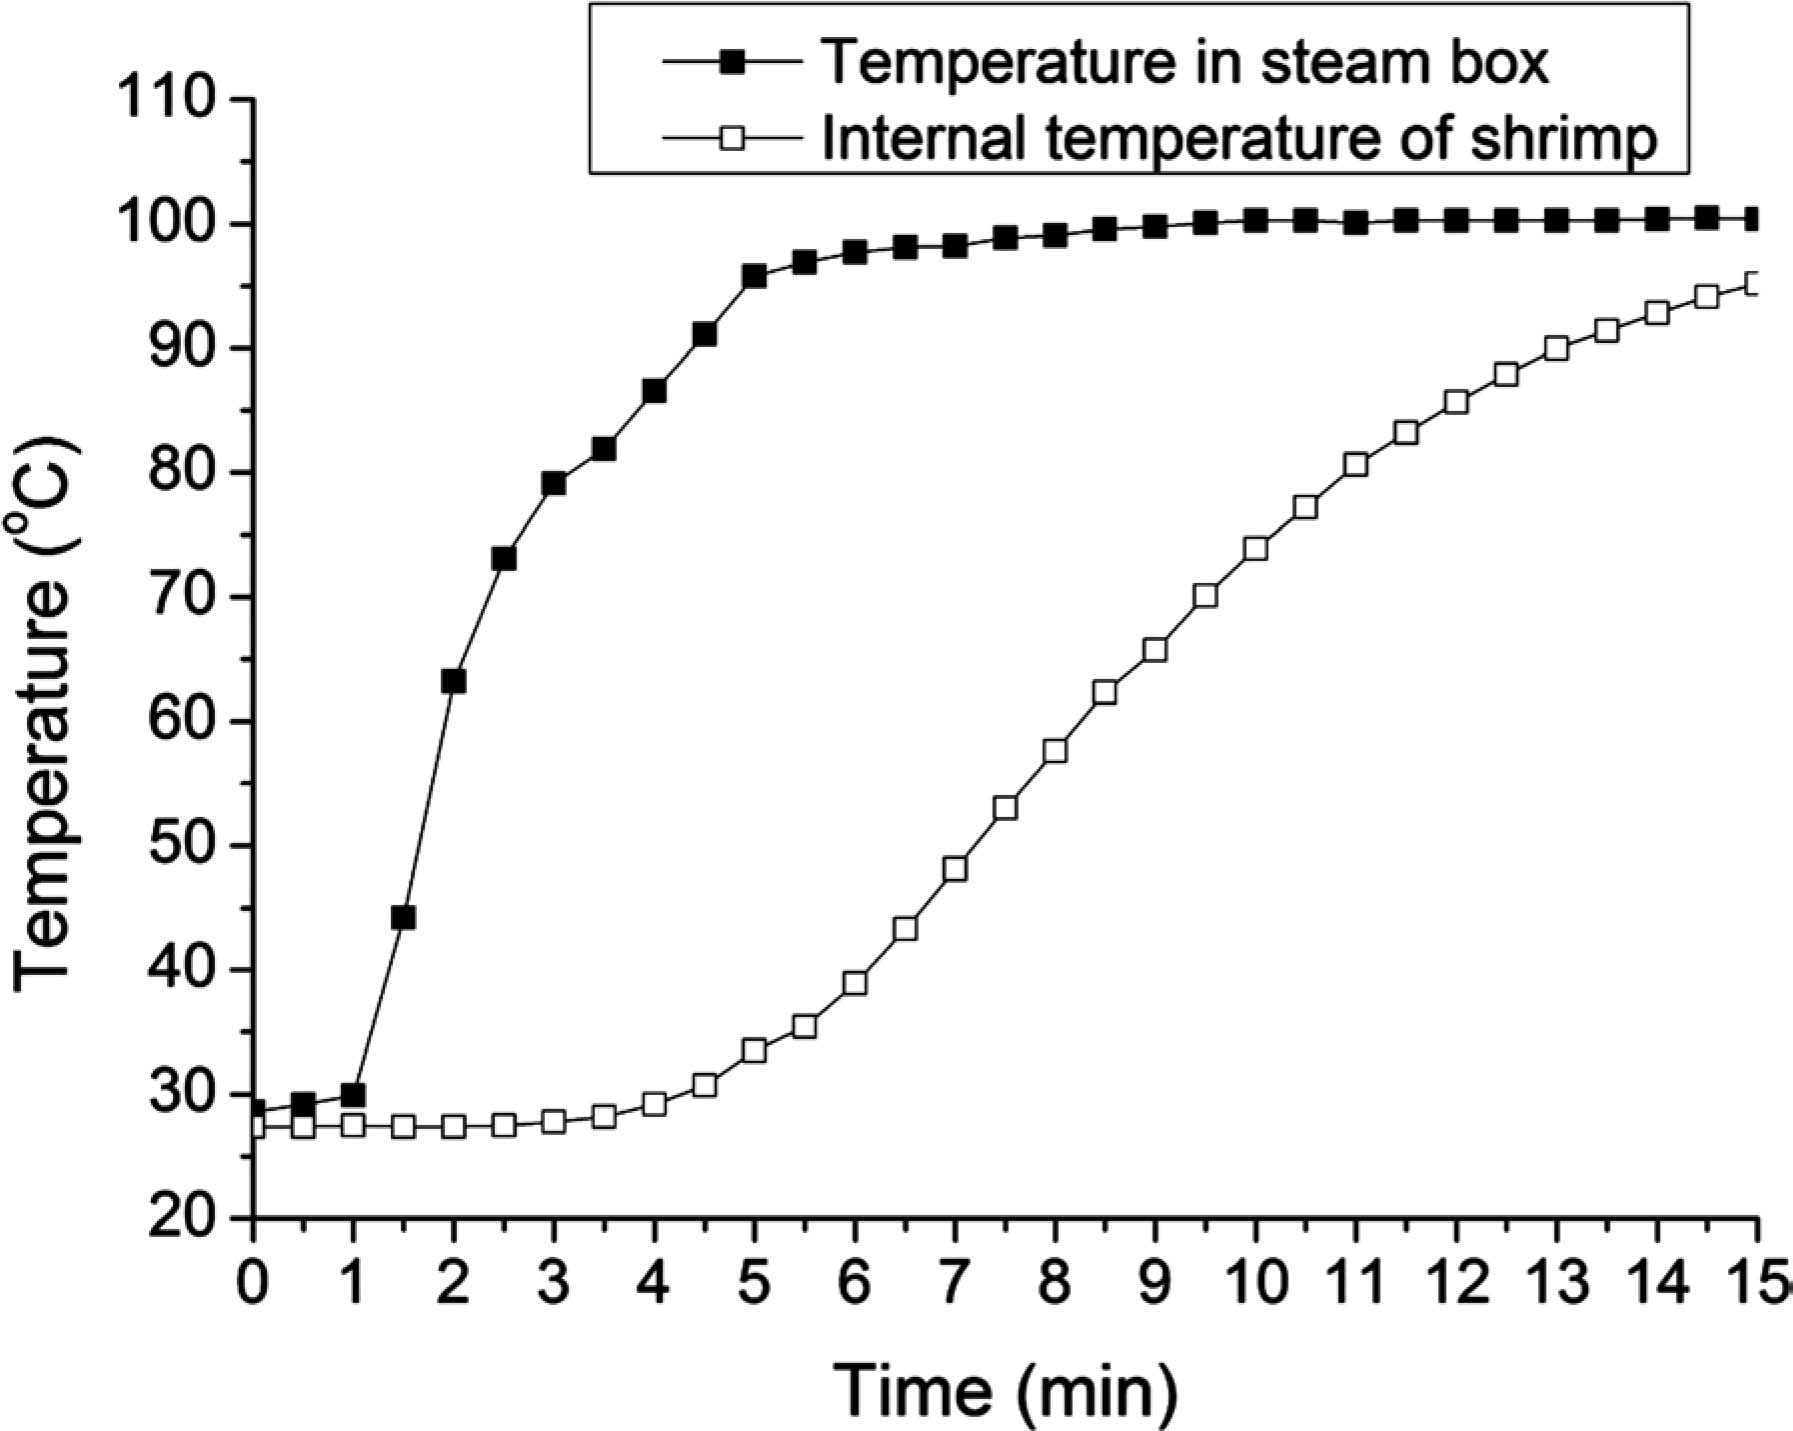
Heating curve Internal temperature changes in shrimps and the temperature in steam box during cooking are shown in Fig.1. The initial internal temperature of shrimps was 27.4°C. For imitating household cooking, the shrimps were put in steam box firstly, and then steam box began to heat. As shown in Fig.1, the temperature in steam box increased sharply with increasing cooking time, while the internal temperature of shrimps began to increase after 4 min. The cooking times for reaching different internal temperatures of 75°C, 80°C, 85°C, 90°C, 95°C were 10 min, 11 min, 12 min, 13 min and 15 min, respectively.
Cooking loss Cooking loss is an important quality index for evaluating of cooking technique and it is also of great economic importance. Cooking loss is highly related to the eating quality including appearance, tenderness and juiciness of cooked foods (Aaslyng et al., 2003).
Cooking loss of shrimps with different internal temperature was presented in Table 1. As shown in Table.1, the cooking loss of shrimps increased with increasing internal temperature from 75°C to 90°C, but no significant differences in the range of internal temperature from 90°C to 95°C. Increasing temperature of steamed shrimps caused a decrease in moisture content. Similar result was observed in boiled Pacific white shrimps that the cooking loss increased with the core temperature of shrimps increasing from 65°C to 90°C (Manheem et al., 2012). In another report found that yielding losses for different sizes of boiled white shrimp were in the range of 15.8 – 28.7% when the internal temperature was 90°C, and dipping in sodium tri-polyphosphate solutions before boiling could prevent the large cooking-related yield losses of different sizes of white shrimps (Erdogdu et al., 2004). Cooking loss was also significantly influenced by final internal temperature in steamed beef (Modzelewska-Kapitula et al., 2012). It was reported that cooking loss depends on raw meat quality, centre temperature and cooking procedure (Aaslyng et al., 2003). Higher cooking loss was generally associated with heat-induced protein denaturation and coagulation during cooking, causing less water to be entrapped within the protein structures held by capillary forces (Aaslyng et al., 2003; Domínguez et al., 2014). Thermal denaturation of proteins and shrinkage of fibre could lead to loss of moisture (Niamnuy et al., 2007). When the temperature of muscle was higher than 60°C, the connective tissue network and the muscle fibres began cooperatively shrink longitudinally, and the extent of shrinkage increased with increasing temperature, thus causing the increasing water loss during cooking (Tornberg, 2005). Martínez-Alvarez et al. (2009) found that cooking loss of shrimps was not affected by different cooking methods in terms of vacuum cooking, steaming and boiling, and the cooking loss could be ascribed mainly to the diminution of the moisture content induced by the effect of high temperatures on the water holding capacity of the muscle protein.
Table 1.
Cooking loss of shrimp after cooking to different internal temperature
| Internal temperature (°C) |
Cooking loss (%) |
| 75 |
4.67 ± 0.51c |
| 80 |
5.69 ± 0.56bc |
| 85 |
7.92 ± 1.13b |
| 90 |
10.44 ± 0.70a |
| 95 |
10.99 ± 2.92a |
Data are expressed as means ± standard deviation (n = 6).
a–c Means with different superscript letters in the same column indicate significant differences (p < 0.05).
Color Meat color is one of the most important factors influencing meat quality and consumer preference, and is considered as an indicator of cooked meat doneness (Dai et al., 2013). As shown in Table 2, steaming resulted in significantly increase in L*, a*, b* values for both shell and muscle of shrimps in comparison with raw shrimp, suggesting that the cooked shrimps showed more lighter and yellow. Whereas no significant differences in L*, a* and b* values among cooked shrimps with different internal temperature were observed, indicating that cooked shrimps exhibited similar color when the internal temperature exceeded 75°C. The increasing in lightness (L*) correlated with protein denaturation, coagulation and heat displacement (Dai et al., 2013). It was noted that L* of shell was lower than that of muscle regardless of internal temperature, while the redness (a*) and yellowness (b*) of shell were obviously higher than those of muscle, resulting from the higher content of carotenoids in shell than those in muscle (Bono et al., 2012). Cooking caused protein denaturation and consequently red astaxanthin was released from ovoverdin, resulting in increase in redness of the carapace (Martínez-Alvarez et al., 2009; Niamnuy et al., 2007).
Table 2.
Color of shell and muscle of shrimp after cooking to different internal temperature
| Internal temperature (°C) |
Shell of shrimp |
Muscle of shrimp |
| L* |
a* |
b* |
L* |
a* |
b* |
| Raw |
35.96 ± 1.36a |
0.75 ± 0.25a |
1.54 ± 0.29a |
37.88 ± 2.04a |
0.69 ± 0.28a |
−2.13 ± 0.61a |
| 75 |
65.41 ± 1.18b |
18.04 ± 2.37b |
26.61 ± 2.96bc |
73.33 ± 4.24b |
5.35 ± 0.32c |
13.93 ± 2.02c |
| 80 |
65.59 ± 2.99b |
16.44 ± 5.01b |
22.28 ± 6.19b |
77.03 ± 2.21bc |
3.08 ± 1.56b |
13.70 ± 0.77c |
| 85 |
64.41 ± 1.67b |
17.80 ± 2.84b |
27.75 ± 2.87c |
74.09 ± 3.07bc |
3.22 ± 0.78b |
17.84 ± 1.23d |
| 90 |
63.79 ± 4.39b |
18.93 ± 4.74b |
25.92 ± 3.00bc |
78.73 ± 3.73c |
2.25 ± 1.41ab |
8.90 ± 0.56b |
| 95 |
61.80 ± 4.07b |
16.90 ± 4.19b |
24.33 ± 3.07bc |
77.37 ± 4.85bc |
2.45 ± 1.32b |
11.90 ± 2.11c |
Data are expressed as means ± standard deviation (n = 6).
a–c Means with different superscript letters in the same column indicate significant differences (p < 0.05).
Texture Texture profile analysis (TPA) of shrimp muscle after cooking to different internal temperature is presented in Table 3. As shown in Table 3, texture properties were significantly affected by thermal treatment. Compared with raw shrimp, cooking resulted in significantly increase in hardness, springiness, cohesiveness and chewiness in all cases regardless of internal temperature. The increase in hardness of cooked shrimps was probably attributed to the thermal shrinkage of shrimp muscle proteins (Martínez-Alvarez et al., 2009; Niamnuy et al., 2007). Shrinkage of shrimp muscle occurred due to shrinkage of myofibrillar proteins and collagen, which denatured and coagulated during cooking (Niamnuy et al., 2007). However, no significant differences in hardness, springiness, cohesiveness and chewiness were observed amongst shrimps with different internal temperature. This was because the temperature of cooked shrimps reached the denaturation temperature of most proteins (Sriket et al., 2007). The denaturation and coagulation of myofibrillar proteins and collagen caused an increase in the hardness of shrimp (Niamnuy et al., 2007; Niamnuy et al., 2008) It was noticed that the hardness of shrimp showed a slight reduction when the internal temperature above 85°C.
Table 3.
Textural properties of shrimp after cooking to different internal temperature
| Internal temperature (°C) |
Hardness (g) |
Springiness |
Cohesiveness (N/mm2) |
Chewiness (g) |
Shear force (N) |
| Raw |
273.28 ± 67.69a |
0.73 ± 0.13a |
0.56 ± 0.02a |
133.13 ± 20.07a |
1.58 ± 0.26a |
| 75 |
552.46 ± 73.85b |
0.87 ± 0.09b |
0.77 ± 0.02b |
383.84 ± 46.06bc |
1.91 ± 0.18bc |
| 80 |
593.88 ± 36.67b |
0.83 ± 0.09ab |
0.77 ± 0.02b |
347.26 ± 18.53bc |
1.93 ± 0.19bc |
| 85 |
554.34 ± 86.08b |
0.79 ± 0.05ab |
0.76 ± 0.02b |
386.60 ± 56.67c |
2.12 ± 0.15c |
| 90 |
491.95 ± 62.594b |
0.78 ± 0.07ab |
0.75 ± 0.03bc |
318.81 ± 93.97bc |
1.89 ± 0.16bc |
| 95 |
476.20 ± 33.12b |
0.77 ± 0.09ab |
0.72 ± 0.03b |
303.63 ± 76.39b |
1.73 ± 0.16ab |
Data are expressed as means ± standard deviation (n = 6).
a–c Means with different superscript letters in the same column indicate significant differences (p < 0.05).
Shear force could effectively characterize the textural changes of muscle (Luckett et al., 2014). It was noted that shear force increased with increasing internal temperature in the range of 75°C to 85°C, accompanied by a slight reduction when the internal temperature further increased from 85°C to 95°C. This was in agreement with the results of hardness. The reduction in shear force of shrimp was probably related to the degradation of myofibrillar proteins and gelation of collagen at higher temperature (Niamnuy et al., 2007). Benjakul et al. (2008) reported that shear force of black tiger shrimp and white shrimp meats increased as the internal temperature increased from 70°C to 75°C. Cooking of shrimps by vacuum cooking, steaming and boiling could significantly enhanced shear strength, probably by thermal shrinkage of muscle proteins (Martínez-Alvarez et al., 2009).
Free amino acids Taste is one of the most important sensory properties of muscle foods. Free amino acids are well-known as taste active compounds in foods. Amino acids usually have characteristic taste, such as sweet, sour, or bitter. The improvement of taste of foods is related to the increase in the amount of free amino acids (Ishiwatari et al., 2013).
The contents of free amino acids in shrimps steamed to different internal temperature were shown in Table 4. Glycine, arginine, proline, alanine and glutamic acid were the main free amino acids, accounting for more than 85% for all the samples. Glycine and alanine have a pleasant sweet taste, and they are widely presented in large quantity in seafoods. The contents of main sweet amino acids of glycine and alanine were much higher than other free amino acids, resulting in sweet taste of shrimp. Aspartic acid and glutamic acid gave the umami taste like monosodium glutamate (MSG) in the presence of sodium salt (Chen et al., 2007; Lee et al., 2009). Amino acids with hydrophobic side chains usually have an unpleasant bitter taste. Arginine is a bitter amino acid with slight sweetness, and its bitterness can be masked by NaCl, glutamic acid, and it also could intensify the sweetness (Kani et al., 2008).
Table 4.
Free amino acid composition of shrimp (Metapenaeus ensis) after cooking to different internal temperature
| Amino acids |
content (mg/100 gdry basis) |
| Raw |
75°C |
80°C |
85°C |
90°C |
95°C |
| Aspartic acid |
105.98 |
131.54 |
142.11 |
152.67 |
127.74 |
99.49 |
| Glutamic acid |
821.21 |
709.71 |
712.82 |
648.95 |
603.82 |
586.26 |
| Serine |
27.63 |
15.99 |
13.63 |
15.68 |
14.22 |
15.32 |
| Histidine |
127.68 |
97.67 |
90.56 |
92.97 |
86.22 |
80.07 |
| Glycine |
3123.26 |
2936.34 |
2828.13 |
2512.91 |
2451.79 |
2256.57 |
| Threonine |
135.36 |
81.90 |
79.26 |
70.61 |
71.11 |
72.29 |
| Arginine |
1505.04 |
1344.62 |
1311.23 |
1106.86 |
1229.49 |
1152.42 |
| Alanine |
1244.87 |
855.09 |
842.54 |
832.91 |
829.63 |
784.71 |
| Tyrosine |
118.13 |
84.70 |
84.40 |
86.52 |
69.59 |
46.03 |
| Cysteine |
2.37 |
0.86 |
0.92 |
2.16 |
0.10 |
0.13 |
| Valine |
218.57 |
156.67 |
148.35 |
152.09 |
136.25 |
120.91 |
| Methionine |
84.60 |
35.48 |
37.22 |
32.53 |
32.33 |
34.68 |
| Phenylalanine |
110.18 |
76.27 |
51.27 |
50.30 |
51.59 |
58.55 |
| Isoleucine |
92.77 |
57.53 |
59.12 |
54.46 |
72.67 |
53.43 |
| Leucine |
213.08 |
126.63 |
117.54 |
103.07 |
140.17 |
113.10 |
| Lysine |
263.17 |
158.82 |
82.36 |
83.68 |
166.52 |
160.88 |
| Proline |
1388.88 |
1539.46 |
1410.25 |
1284.56 |
1136.82 |
1014.92 |
| MGS-like (Umami) |
927.19 |
841.25 |
854.93 |
801.62 |
731.55 |
685.76 |
| Sweetness |
4531.12 |
3889.32 |
3763.56 |
3432.09 |
3366.76 |
3128.89 |
| Bitter |
2470.04 |
1979.57 |
1899.68 |
1678.82 |
1818.31 |
1659.19 |
| Tasteless |
383.66 |
244.37 |
167.68 |
172.36 |
236.22 |
207.04 |
| Total |
9582.78 |
8409.28 |
8011.71 |
7282.93 |
7220.06 |
6649.76 |
MGS-like (Umami): Asp+Glu; Sweetness:Ala+Gly+Ser+Thr; Bitter:Arg+His+Ile+Leu+Met+Phe+Tyr+Val; Tasteless: Cys+Lys+Tyr.
It was noted that the total contents of free amino acids, umami amino acids, sweet amino acids and bitter amino acids in cooked shrimps were all lower than those in raw shrimps. And these amino acids decreased with increasing internal temperature. It was reported that the total free amino acids contents in the microwave-cooked shrimp and boiled shrimp were decreased by 15.81% and 20.19%, respectively (Chi et al., 2012). The decrease in amino acids content was mainly related to the increased cooking loss. The soluble free amino acids could exude with fluid during cooking. Sasaki et al. (2007) found that the amounts of gultamic acid, total free amino acids decreased significantly in porcine muscle and increased in cooking juice, but total amount of glutamic acid and free amino acids in both muscle and cooking juice remained unchanged during cooking. Higher protein loss was also observed during boiling of shrimps in different concentrations of salt solution (Niamnuy et al., 2008). The decrease in free amino acids after cooking was also related to the formation of volatile compounds from the amino acids (Liu et al., 2007).
Nucleotides Besides free amino acids, the improvement of taste of cooked meat is usually considered to be related to the increase in nucleotide-related compounds (Ishiwatari et al., 2013). Nucleotide-related compounds are naturally present in many protein-rich foods including fish, shrimp, and meat (Chen et al., 2007). Nucleotides mainly IMP, GMP and AMP are important contributors to the umani-taste of foods, and there is a synergistic effect between MSG, IMP, GMP and AMP (Chen et al., 2007; Ishiwatari et al., 2013; Sasaki et al., 2007).
The levels of nucleotides in cooked shrimps with different internal temperature are presented in Table 5. As shown in Table 5, steam cooking had a significant influence on the concentration of nucleotides in shrimps. Compared to raw shrimps, cooking resulted in significant increase in the contents of AMP, but sharply decrease in IMP, Inosine and Hx contents. The GMP contents in cooked shrimps were in the range of 67.7 and 87.7 µmol /100 g dry basis, which slight higher than that in raw shrimp, and there was no obvious trend with increasing temperature. In addition, it was noted that the total content of nucleotides in cooked shrimps ranged from 2333.0 to 2567.2 µmol /100 g dry basis, which were much lower than that in raw shrimps. In tested cooked shrimps, AMP was the main nucleotides, followed by IMP, Inosine, GMP and Hx, regardless of internal temperature. In the case of raw shrimp, GMP was the least nucleotide. IMP and GMP are intense flavor-enhancers of umami taste. The total contents of IMP and AMP in cooked shrimps were much lower than those in raw shrimps. This phenomenon may be related to degradation of IMP and the leaching of IMP during cooking as shown in the increased cooking loss in cooked shrimps (Table 1). On the other hand, the much higher content of IMP and lower content of AMP in raw shrimp may be mainly due to the degradation of nucleotides during 1 day of storage at 4°C before nucleotides content analysis in present study (Itoh et al., 2013). Furthermore, the slightly higher content of IMP, inosine and Hx but lower content of AMP at 95°C as compared to those at 90°C may also related to degradation of nucleotides during the delay time before cooking. Overall, there was a clear difference of nucleotide content between raw shrimp and steam cooked shrimp, but that there was a little difference of steam cooked shrimp to various internal temperature. The slight fluctuation change of IMP and GMP as the internal temperature increasing may be related the thermal inactivation of nucleotides degradation enzyme and thermal degradation of nucleotides. After microwave and water-boiled treatments, the contents of total nucleotides, IMP and GMP in shrimp (Litopenaeus vannamei) significantly decreased, while AMP increased slightly (Chi et al., 2012). Vani et al.(2006) found that the IMP degradation increased with increasing temperature in the range of 80°C to 120°C. Whereas the whole amount of IMP in both porcine muscle and cooking juice increased slightly during the initial phase of cooking but remained unchanged after 10 min of cooking (Sasaki et al., 2007).
Table 5.
Nucleotides in shrimp (Metapenaeus ensis) after cooking to different internal temperature
| Nucleotide |
Content (µmol /100 g dry basis) |
| Raw |
75°C |
80°C |
85°C |
90°C |
95°C |
| AMP |
691.6 |
1513.5 |
1515.5 |
1596.8 |
1332.5 |
1130.9 |
| IMP |
2417.3 |
716.8 |
778.3 |
573.5 |
824.7 |
846.7 |
| GMP |
52.3 |
73.6 |
84.8 |
87.7 |
67.7 |
82.9 |
| Inosine |
596.2 |
174.4 |
172.2 |
169.7 |
205.8 |
227.2 |
| Hx |
468.9 |
18.5 |
16.3 |
17.4 |
40.3 |
45.3 |
| Total |
4226.3 |
2496.8 |
2567.2 |
2445.1 |
2470.9 |
2333.0 |
| IMP+GMP |
2469.6 |
790.4 |
863.2 |
661.2 |
892.4 |
929.6 |