Original papers
Expression of Two Endo-1,4-β-glucanase Genes During Fruit Ripening and Softening of Two Pear Varieties
2016 Volume 22 Issue 1 Pages 91-99
Details
2016 Volume 22 Issue 1 Pages 91-99
Endo-1,4-β-glucanase (EG) is involved in the metabolism of plant cell wall, and plays important roles in the growth and development of plants. EG is closely associated with cell elongation, fruit ripening, and tissue abscission. Here, two EG genes were cloned from Pyrus bretschneideri Rehd. cv. Chili, and their expression patterns were analyzed in fruit of Pyrus bretschneideri Rehd. cv. Chili and fruit of Pyrus pyrifolia Rehd. cv. Whangkeumbae. The two pear varieties showed different softening behaviors, ‘Chili’ maintained a stable firmness during the storage time, while the firmness of ‘Whangkeumbae’ decreased during the storage. The functions of two EG genes were discussed in the ripening and softening processes. During the 0°C storage period of ‘Chili’ pears, PbEG3 and PbEG4 expression levels both showed a downward trend. The expression levels of both the genes were high during the early harvest period (0 days), and declined rapidly thereafter. Treatment with 1-methylcyclopropene (1-MCP) inhibited PbEG3 expression, but had no significant effect on PbEG4. During the 0°C storage period of ‘Whangkeumbae’ pears, the expression of PbEG3 first increased, peaked at the 60 th day of storage, declining gradually thereafter until 120 d of storage. In contrast, PbEG4 gene expression displayed decreasing trend at first and increased thereafter. The different expression patterns of the PbEG3 and PbEG4 genes in ‘Chili’ pears and ‘Whangkeumbae’ pears showed that PbEG3 might be involved in ripening and softening, and the expression of the two genes are different in different cultivars.
Fruit ripening and softening is a complex process. Brummell (2006) considered that the pectin and hemicellulose of the cell wall would be degraded during fruit ripening. On the research of three varieties in pear fruit, Cell wall degradation is correlated with a decrease in firmness during ripening and the modification of both pectin and hemicellulose are essential for the development of a melting texture (Hiwasa et al., 2004). Endo-1,4-β-glucanases (EGs) (cellulase; EC 3.2.1.4) are hydrolytic enzymes produced by bacteria, fungi, insects, or plants, which can hydrolyze polysaccharides containing a 1,4-β-glucan backbone. Cellulose can be catalyzed and hydrolyzed by EGs, and degraded into dextrin or oligosaccharides by random actions (Wong et al. 1977; Hayashi et al. 1984). EGs play important roles in the growth and development of plants, and are closely associated with the processes of cell elongation (Sato et al. 1996; Shani et al. 2006), fruit ripening and softening (Real et al. 2004; Chourasia et al. 2008; Lee and Kim 2011), and abscission of tissues and organs (Kalaitzis et al. 1999; Gonzalez-Bosch et al. 1997). The expression level of Avocel1(cellulase gene of avacado) was low in immature avocados, but its expression has been reported to increase 37-fold when the fruit begins to mature, indicating the important role played by this gene in fruit ripening (Cass et al. 1990). Similarly, Cel1 encoding an endo-1,4-β-glucanase is a strawberry-specific expressed gene, and its expression has been reported to start at the white fruit stage. Furthermore, the Cel1 mRNA level increases rapidly at the beginning of fruit ripening and continues to be maintained at a high level throughout the ripening and subsequent decay processes, suggesting that Cel1 is a fruit ripening-specific EG (Harpster et al. 1998). LIop-Tous (1999) isolated two cDNA clones (Cel1 and Cel2) encoding divergent endo-β-1, 4-glucanases (EGase) from the cDNA library of red strawberry fruit. Of these, faEG1(Cel1) has fruit-specific expression, which begins to express at the white fruit stage, following which the expression level increases rapidly. The faEG3(Cel2) gene was expressed in young vegetative tissue but it was predominantly expressed during the ripening process (Trainotti et al. 1999). PcEG1 and PcEG2 of European pears exhibited different expression patterns at the shelf-life stage after cold storage: PcEG1 was constitutively expressed, while the expression of PcEG2 peaked at the end of the storage (Hiwasa et al. 2003).
EGs of higher plants are usually encoded by multigene family, for example, Arabidopsis thaliana has at least 25 EG genes (Shani et al. 2006), and Solanum lycopersicum has been reported to have 8 (Urbanowicz et al. 2007). Fragaria×ananassa and Prunus persica each have been reported to have 4 EG genes (Palomer et al. 2006; Trainotti et al. 2006). Currently, more and more plant EG genes have been cloned, and their substrates have been investigated by researchers.
EG is involved in plant cell wall metabolism, but its natural substrate remains to be completely elucidated. Furthermore, the synergic relationships between different EGs as well as between EGs and other hydrolytic enzymes have not yet been understood. Shani et al. (2006) reported that each EG might have specific action sites in the cell wall of the same cell. In other words, cell elongation, tissue abscission, fruit ripening and other processes would require the participation and function of multiple EGs, and the modification of plant cell walls would also require the joint action of various hydrolytic enzymes other than EGs (Cosgrove, 2005).
In this study, we cloned two EG genes of pear, analyzed their expression patterns in Pyrus bretschneideri Rehd. cv. Chili and Pyrus pyrifolia Rehd. cv. Whangkeumbae, two varieties of pears that showed different ripening characteristics.
Materials and treatments Mature ‘Chili’ pear fruits were collected from an orchard at Laiyang, Shandong, China on October 12, 2010, and delivered to our laboratory on the same day. Fruits of uniform size with no pests signs and with relatively consistent maturity were selected for the experiment. The fruits were first treated with or without 5 µL/L 1-methylcyclopropene (1-MCP) for 24 h at 20°C, then stored at 0°C. Ten fruit per replicate of each treatment randomly selected on 15, 30, 45, 60, 75, 90, 105 and 120 d for firmness measurement. After removing the fruit peels and cores, the flesh was cut into 1-cm3 pieces and mixed, treated with liquid nitrogen, and stored at −70°C until analysis.
Mature ‘Whangkeumbae’ pears were collected from Laiyang, Shandong, China on September 28, 2010, and delivered to our lab on the same day. Fruits of uniform size, without pests, and with relatively consistent maturity were selected for the experiment. The treatment and test indicators used to study these pears were the same as those for ‘Chili’ pears.
Fruit firmness and ethylene production analysis Fruit firmness was determined of 10 fruit in each of three replicates on the fruit equator. A texture analyzer (CT3, Brookfield, USA) was used with a 2-mm-diameter probe, 10-mm penetration depth, and 0.5 mm/s penetration rate. Measurements were made on four sides of each fruit after the removal of a small piece of peel, and the data were expressed in Newtons (N).
The ethylene release rate was detected on a Shimadzu GC-2010 gas chromatograph, as described prevoiusly (Ma et al. 2009). The chromatographic parameters to determine the ethylene release rate were as follows: carrier gas, high-purity N2; velocity, 38.7 mL·min−1; carrier gas temperature, 150°C; flame ionization detection (FID); inspection room temperature, 200°C; GDX-502 packed column inner radius, 0.53 n; film thickness, 1.00 µm; column length, 10 m; temperature, 80°C. The ethylene content was represented as µL·kg−1·h−1.
Biochemical and physiological analyses The cellulose content of the pears was detected according to the method of Updegraff (1969).
The cellulase activity, represented as viscosity·g−1·h−1, was determined according to the method of Zhou et al (2000).
Total flesh RNA extraction and cDNA synthesis Total RNA was extracted from the flesh tissue using TianGen RNAplant Reagent (TianGen, China), according to the manufacturer's instructions. DNA contamination was removed using DNase (Fermentas, Lithuania). The first cDNA strand was reverse transcribed using 2.0 ug RNA according to a Revert Aid™ First Strand cDNA Synthesis kit (Fermentas, Lithuania), according to the manufacturer's instructions. For each time point, three batches of RNA were isolated as three biological repeats for separate cDNA synthesis.
EG gene clone of pear fruits We designed the degenerate primers EGAP and EGSP (Table 1) according to the EG sequences of Fragaria x ananassa(Cel, AY619689), Mangifera indica (Cel1, AJ505607, Cel2, AJ505608), Solanum lycopersicum (Cel, AJ505749) reported by GenBank for RT-PCR, and sequenced the cloned products (Invitrogen, Shanghai). BLAST search in the NCBI database was used for sequence alignment, and after the cDNA fragment of the EG gene was obtained, the 3′- and 5′-ends of cDNA were amplified.
| Gene name | Primer name | Primer sequence (5′ to 3′) |
|---|---|---|
| Degenerated primers | EGAP | GGCGG(A/C)TACTATGATGC(C/A)GG |
| EGSP | TGC(A/T)CCCCACAG(T/C)AAT(T/C)CATC | |
| 3′RACE primers | EG3SP | CCACCGACTACCTCCTCAAA |
| EG4SP | CTGCTGGGAGCGGCCGGAGG | |
| 5′RACE primers | EG3AP | CCCTTCATCAACCCGCCGAACTCGA |
| EG4AP | AACTCGAAAACCCTAACGGCTCGAT | |
| PbEG3 | PbEG3SP | TCGTAGGAACGCTGGCTTAT |
| PbEG3AP | ACCTTGACCGTTTGTGCTTC | |
| PbEG4 | PbEG4SP | TGCAAAGCCGGGTCTAGATA |
| PbEG4AP | ATGAAAGTAGGCCCACCAAC | |
| Actin | ActinSP | CCCAGAAGTGCTCTTCCAAC |
| ActinAP | TTGATCTTCATGCTGCTTGG |
According to the obtained conserved sequences of EG gene cDNA, we used online Primer3 v.0.4.0 (http://frodo.wi.mit.edu/) to design 3′- and 5′-RACE primers (Table 1). cDNA amplification of the 3′-end was carried out using a 3′RACE Core Set ver. 2.0 kit (TakaRa, Japan) according to the manufacturer's instructions, and the amplification of the 5′-end cDNA was carried out using a SMART™ RACE cDNA amplification kit (Clontech, USA). The PCR products were cloned into pMD18-T vectors for positive clone selection, and the selected positive clones were sequenced (Invitrogen, Shanghai). The resultant sequences were submitted to the NCBI website for alignment to confirm whether the amplified fragments are EG gene sequences. DNAMAN and DNAStar were used for sequence analysis and assembly to obtain the cDNA sequences of the EG gene, following which specific primer across two splicing points was designed for cDNA sequence verification.
Bioinformatics analysis DNAMAN software was used to translate the nucleotides to amino acids, and NCBI BLAST (http://blast.ncbi.nlm.nih.gov/Blast.cgi) was used to predict the conserved domains of proteins. ProtParam tool (http://web.expasy.org/protparam/) was used to analyze the essential composition of amino acids. PBIL Lyon-Gerland (http://npsa-pbil.ibcp.fr/cgi-bin/npsa_automat.pl?page=/NPSA/npsa_hnn.html) was used to predict the secondary structure of PbEG. TMHMM Server v.2.0 (http://www.cbs.dtu.dk/services/TMHMM-2.0/) to analyze the trans-membrane domains of protein sequences, and SignalP 4.0 (http://www.cbs.dtu.dk/services/SignalP/) was used for signal peptide analysis of proteins.
Real-time quantitative analysis We used the PbEG3 and PbEG4 sequences obtained from this experiment, and designed real-time PCR primers by Primer3 v.0.4.0. The primers were synthesized by Shanghai Invitrogen (Table 1). The PCR product amplified by the primers were sequenced both in ‘Chili’ pear and ‘Whangkeumbae’ pear, and the homology between them were 100%.
Real-time PCR was operated in a real-time PCR instrument (Roche 480, Switzerland). The total volume of 20 µL included 2 µL of cDNAs, 250 nmol L−1 each primer, and 10 µL of 2× SYBR Green PCR Master Mix (Roche). The PCR protocols included annealing at 94°C for 5 min, 94°C for 15 s, followed by 40 cycles at 94°C for 15 S, 60°C for 1 min. A negative control without template for each primer pair was included in each run. Actin (The accession Number of AB190176) was selected as the internal standard to normalize the differences in the amount of templates. Real-time PCR data analysis was performed using 2−ΔΔCT method (Livak and Schmittgen 2001, Yin et al. 2010), where ΔΔCT = (CT, Target − CT, Actin)Time X − (CT, Target − CT, Actin)Time 0. Time x is any time point and Time 0 represents the 1×expression of the target gene normalized to actin. The expression level of PbEG3 at 0 days after harvest set as one and used as reference for the PbEG4 genes. Three separate biological replicates were performed for relative intensities. All relative intensities were calculated from standard curves for each gene.
Statistical analysis Standard errors (S.E.) were calculated by Origin (Microcal Software Inc., Northampton, MA, USA). LSDs calculated by DPS version 7.05 were used for mean separations in the Figures (α = 0.05).
Cloning and sequence analysis of PbEG3 and PbEG4 Mature pear fruit flesh were used to extract total RNA, and degenerate primers were designed according to the published conserved sequences of the EG gene. The first cDNA strand of ‘Chili’ pear flesh was used as a template for PCR amplification, and the length of the resultant amplified fragment was approximately 800 bp. We designed 3′ and 5′ RACE-specific primers according to the obtained conserved cDNA sequences for PCR amplification. After obtaining 3′- and 5′-end sequences of the EG gene, DNAStar software was used to splice the three acquired fragments, and the resultant cDNA sequences obtained from two EG gene homologues termed PbEG3 and PbEG4 different from PcEG1 and PcEG2 obtained from Europear pear (Hiwasa et al. 2003). The length of PbEG3 cDNA was 1926 bp, with a 509-amino-acid open reading frame, while the length of PbEG4 cDNA was found to be 1724 bp, and its open reading frame encodes 511 amino acids (Fig. 1). The homology of amino-acid sequences between PbEG3 and PbEG4 is 56.87%. NCBI BLAST search revealed that PbEG3 and PbEG4 were highly homologous to the EG gene of castor (RcEG1, XP002523114) and strawberry (FaEG1, AAC95009). We designed specific primers across the three fragments for full-length validation. Based on the above characteristics and the results of the full-length validation, it can be concluded that we obtained the complete cDNA sequence of PbEG3 and PbEG4. GenBank accession numbers for PbEG3 and PbEG4 were KJ948238 and KJ948239, respectively.
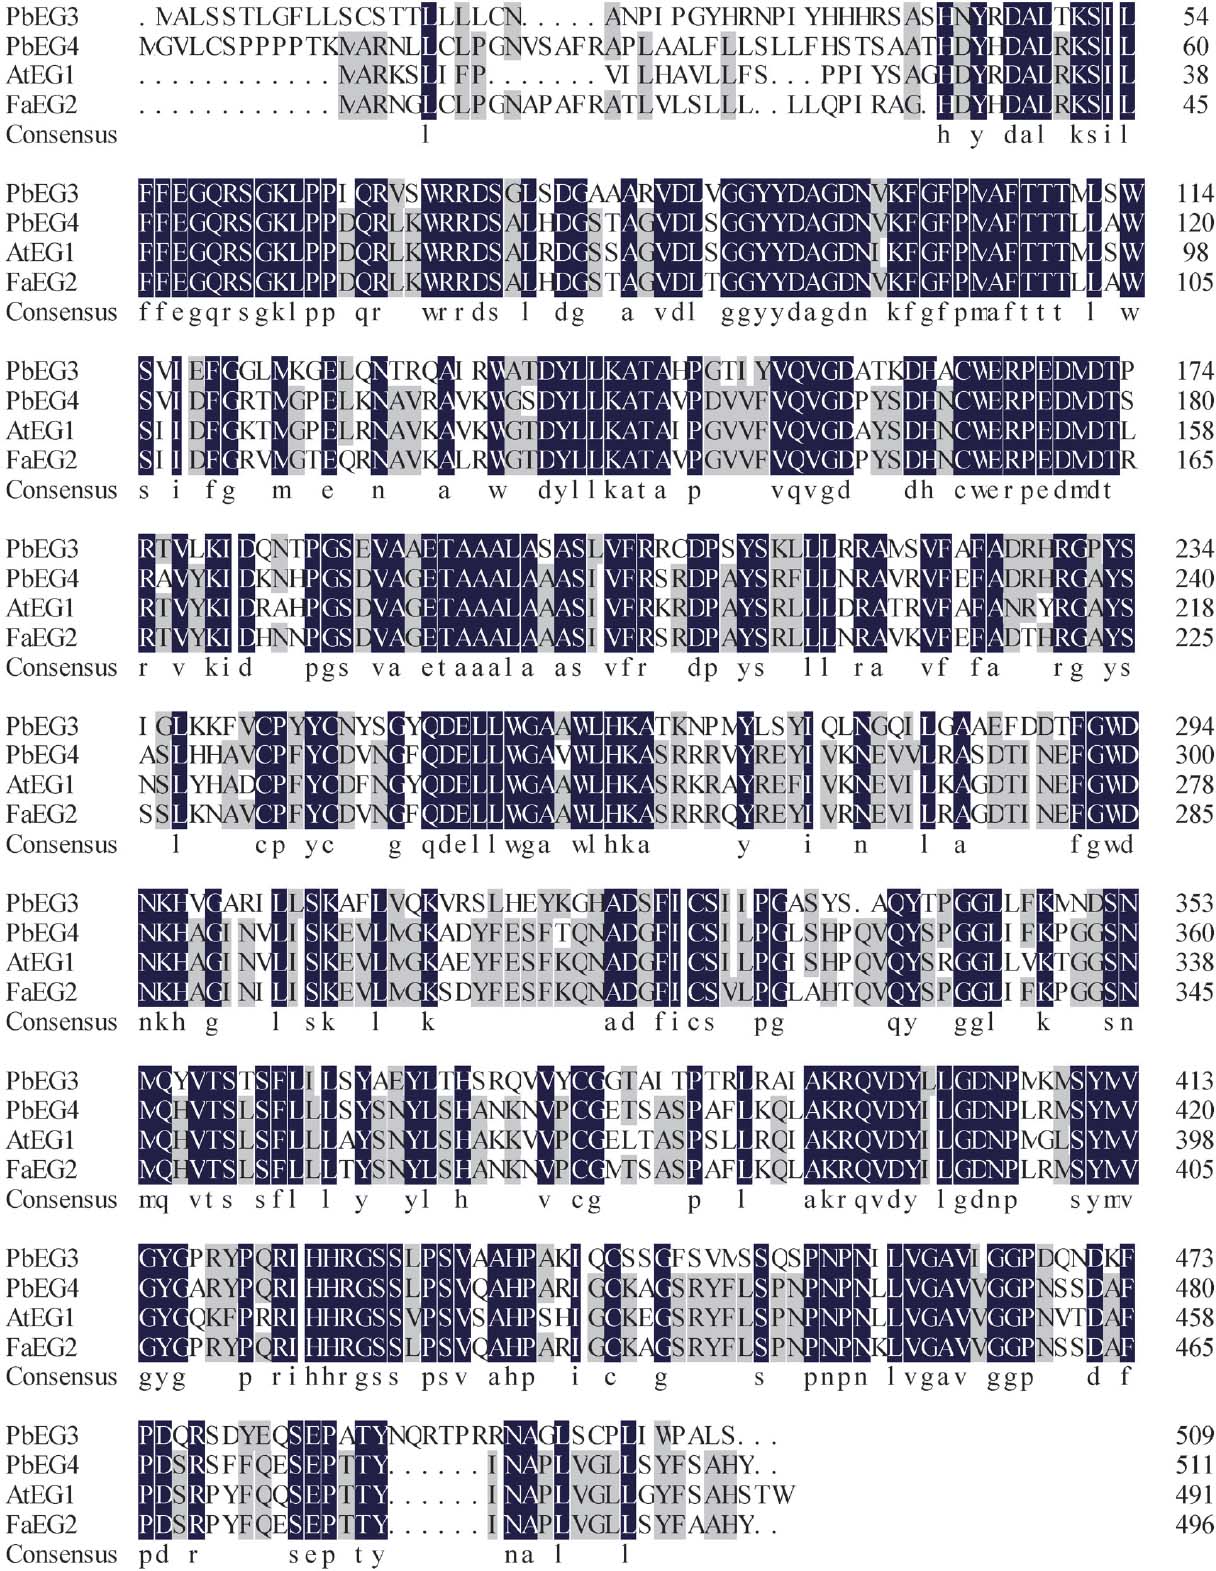
Deduced amino acid sequences of PbEG3 and PbEG4 and a multiple alignment of the EGase amino acid in pear (PbEG3, KJ948238, PbEG4, KJ948239), strawberry (FaEG2, AAQ15175) and Arabidopsis (AtEG1, CAA67157). Black shading Identical amino acids; gray shading highly conserved amino acids.
We constructed a phylogenetic tree of 22 EG genes, including ‘Chili’ pear PbEG3 and PbEG4, using DNAMAN software (Fig. 2). As shown in Fig. 2, EG can be classified into two categories (Urbanowicz et al. 2007): trans-membrane proteins and secreted proteins. The former category includes tomato Lecel3, barley Hvcel1, and European pear PcCL1 and PcEG1. ‘Chili’ pear PbEG3 and PbEG4 proteins are secreted proteins, and PbEG3 shares 77.19% and 74.85% homology with the EG amino acid of castor and grape, respectively, while PbEG4 shares 86.89% homology with strawberry FaCEL1.

Phylogenetic tree of the deduced amino acid sequence of plant EGs
We used ProtParam to predict the physicochemical properties of PbEG3 and PbEG4 proteins. The relative molecular weight of PbEG3 was found to be 56.51 kD, isoelectric point, 9.15; and the average hydrophilicity index, −0.276; therefore, this protein had a high probability of being hydrophilic. The relative molecular weight of PbEG4 was 56.37 kD; isoelectric point, 8.84; and the average hydrophilicity index was −0.191; therefore, we speculated that this protein might also be hydrophilic. Based on NCBI CDD prediction, which indicated that both these proteins contained active sites of glycosyl hydrolase family 9, the proteins were considered to belong to glycosyl hydrolase family 9.
We used TMHMM Server v. 2.0 to analyze the trans-membrane domains of PbEG3 and PbEG4 proteins, but no trans-membrane domains were found in these proteins. SignalP 4. 0 was used for signal peptide prediction, and the results revealed that the first 23 amino acid residues of PbEG3 constituted a signal peptide, and the cleavage site was between amino acids 23 and 24. PbEG4 did not have a predicted signal peptide.
PbEG3 and PbEG4 expression patterns and the changes in the cellulose content and EG activity during storage of ‘Chili’ pears No significant changes in firmness occurred during the early harvest stage of ‘Chili’ pears (Fig. 3a). After 60 days, the firmness decreased slightly, and the ethylene release rate first increased and then decreased, peaking at the 60th day after harvest. Treatment with 1-MCP was shown to inhibit the ethylene release rate (Fig. 3a, b). The fruit cellulose content increased gradually during the storage period, and this rate of increasing could be reduced by treatment with 1-MCP (Fig. 3c). EG activity decreased during storage, and there was no significant difference between control and 1-MCP-treated fruit (Fig. 3d). Both PbEG3 and PbEG4 showed a reducing trend during the storage period. The expression levels of the two genes were high during the early harvest stage (0 day), and these levels declined rapidly with time. Furthermore, 1-MCP treatment was found to inhibit PbEG3 gene expression on 15 d after treatment, while it had no significant effect on PbEG4 (Fig. 3e, f).
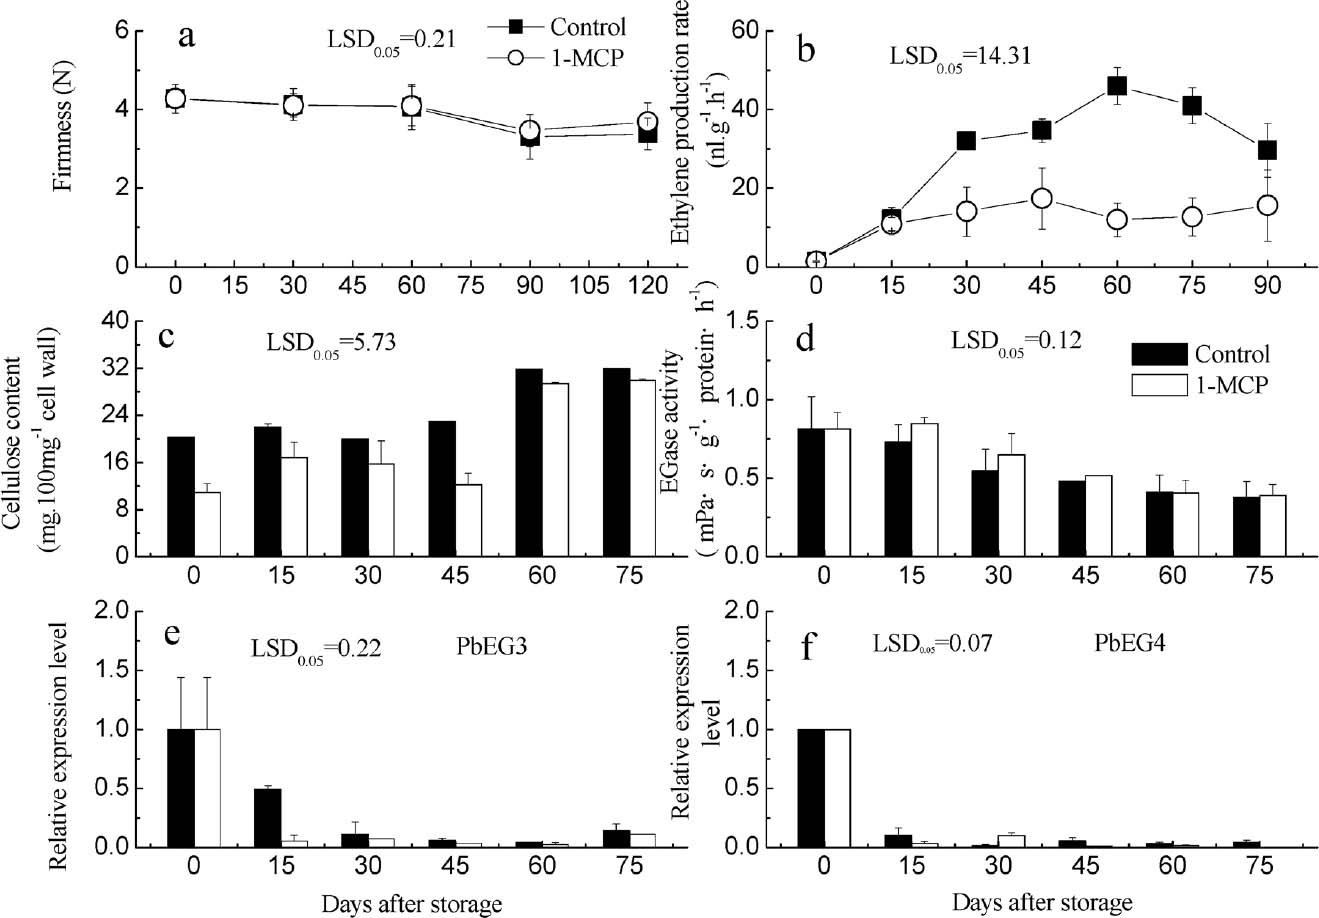
The fruit firmness (a), ethylene production rate (b), content of cellulose (c), activity of EGase (d) and relative intensity of PbEG3 (e) and PbEG4 (f) during the Pyrus bretschneideri Rehd. cv. Chili storage.
PbEG3 and PbEG4 expression patterns and the changes in the cellulose content and EG activity during storage of ‘Whangkeumbae’ pears No significant changes in firmness occurred until 60 days after harvest of ‘Whangkeumbae’ pears. However, the firmness of the control fruit decreased rapidly after 60 d of storage. Treatment with 1-MCP can significant delay the fruit softening process, and the firmness of treated fruit was maintained at 3.12 N after 120 days of storage (Fig. 4a). The ethylene release rate of the control fruit peaked at the 90th day of storage. As 1-MCP treatment can inhibit ethylene release, the ethylene release rate in the 1-MCP treated fruit was significantly lower than that in the control fruit (Fig. 4b). During the 0°C storage period of ‘Whangkeumbae’ pears, the cellulose contents of the control fruit increased before 20 d, then decreased after that and maintained stable content until 120 d after harvest. 1-MCP treated fruits showed higher cellulose content at 60 d and then decreased, which maintained stable level after that (Fig. 4c). The EG activity of the control fruit tended to increase during the early stage and then decreased after 60 d. The EG activity was lower in the 1-MCP treated fruit than in the control fruit (Fig. 4d). PbEG3 and PbEG4 displayed significantly different expression levels during the storage period of ‘Whangkeumbae’ pears. The PbEG3 expression first increased, peaked at the 60 th day of storage, and then declined gradually. The PbEG4 gene expression, however, decreased at first and then increased during the storage time (Fig. 4e, f). 1-MCP treatment could inhibit the expression level of PbEG3, which was consistent with the EGase changes during the storage. There was no significant effect of 1-MCP treatment on PbEG4 gene expression during the storage.

The fruit firmness (a), ethylene production rate (b), content of cellulose (c), activity of EGase (d) and relative intensity of PbEG3 (e) and PbEG4 (f) during the Pyrus pyrifolia Rehd. cv. Whangkeumbae storage time.
EGs of higher plants are encoded by a multigene family (Libertini et al. 2004). On the basis of the characteristics of the encoded amino acid residues, EGs can be divided into two classes (Urbanowicz et al. 2007): trans-membrane proteins, whose N-terminals contain a hydrophobic trans-membrane region, and secreted proteins, whose N-terminals contain a signal peptide. The latter class can further be divided into two groups depending on whether or not these proteins contain a cellulose-binding domain (CBD) at the C-terminal. It has been previously reported that trans-membrane EGs might be related to the biological synthesis of plant cellulose (Libertini et al. 2004; Brummell et al. 1997), and secreted EGs may be related to fruit ripening, organ abscission, and cell elongation (Libertini et al. 2004). In our study, protein trans-membrane region analysis showed that the PbEG3 protein obtained in our experiment did not contain any trans-membrane region, but a signal peptide was present at the N-terminal end; therefore, we speculated that PbEG3 belongs to the secreted proteins category. In case of the PbEG4 protein obtained in this study, no trans-membrane region or signal peptide was found.
The expression characteristics of different EGs during the fruit softening process have been shown to differ. For instance, peach PpEG4 is first expressed in young fruit and peaks before the respiration climacteric, after which its expression gradually decreases. On the other hand, only trace levels of PpEG1, PpEG2, and PpEG3 could be detected during the fruit ripening process (Trainotti et al. 2006; Claudio et al. 1998; Trainotti et al. 1997). Hiwasa et al. (2003) cloned 2 EG genes from European pears, and termed them PcEG1 and PcEG2. The expression of these two genes, however, showed no association with the ripening and softening processes.
The expression of pear PbEG3 and PbEG4 cloned in this study showed different levels during fruit storage in the two pear varieties. After harvest of ‘Chili’ pear, along with the increase in ethylene, the expression of both genes decreased. The fruit cellulose content of ‘Chili’ pears increased gradually after harvest, while the EG activity decreased during the storage. The cellulose changes were not as anticipated that associated with the fruit softening and ripening, these findings are in agreement with Ahmed et al. (1980), which showed that the cellulose levels remained constant or even increase slightly during ripening of pear. It is possible that EGase did not completely solubilize cell wall cellulose (Fischer et al. 1991). Treatment with 1-MCP can slow down the rate of ethylene production, while it also could inhibit the cellulose increase. The decrease of EGase and the increase of cellulose content during the ripening indicated that PbEG3 and PbEG4 genes might not involved in ‘Chili’ pear ripening and senescence.
In the case of ‘Whangkeumbae’ pears, the firmness showed an obvious downward trend after 60 d of storage, while the ethylene release rate began to increase at 60 days, eventually reaching a peak at the 90 th day after storage. While the cellulose content increased before 20 d and then decreased thereafter, the EG activity first increased and then decreased after 60 days, Which means there was minor cellulose depolymerisation in fruit ripening. Because we have no evidence showed that EGase are active against plant crystalline cellulose, so it could not be concluded there was some relationship between EGase and cellulose degradation. The expression levels of PbEG3 and PbEG4 in ‘Whangkeumbae’ pears were significantly different during the 0°C storage period. While PbEG3 expression first increased and then decreased after reaching a peak at the 60 th day of storage, PbEG4 expression first decreased and then increased. 1-MCP treatment could delay the fruit softening and the ethylene production. The EG activity and the expression of PbEG3 level were all lower in 1-MCP treated fruit. Therefore, PbEG3 gene expression showed a trend that was consistent with the fruit firmness and EG activity, indicating that it might play a role in promoting the decline of fruit firmness and leading to the gradual softening of fruit. 1-MCP treatment could delay the ‘Whangkeumbae’ pear fruit softening by inhibited the expression of PbEG3. The different expression patterns of PbEG3 and PbEG4 in ‘Chili’ pears and ‘Whangkeumbae’ pears indicated that the same two genes exhibited different expression levels in the different pear varieties. Furthermore, these expression levels are related to the different patterns of fruit softening observed in both these varieties. After the ‘Chili’ pears were harvested, the fruit firmness first changed slightly until 120 days of storage, while the firmness of ‘Whangkeumbae’ pears declined rapidly after 60 days. As illustrated by our results, the fruit softening process was more obvious during the later storage period in ‘Whangkeumbae’ pears, and this softening might be related to the degradation of the cell wall. Hiwasa et al. (2004) also showed that of the European pear ‘La Franca’, Japanese pear ‘Nijisseiki’, and the Chinese pear ‘Yali’, La Franca showed dramatic fruit softening post-harvest, followed by Nijisseiki, while the fruit firmness of Yali pears changed only slightly within one month after the harvest.
Our research showed that PbEG3 may contribute to fruit softening of ‘Whangkeumbae’ pears in this study, although there would be a certain possibility that another cell wall degrading enzyme related to softening. As a multi-gene family, there may be other EGs that involved in fruit softening. Transgenic studies have found no effect on softening when certain EGase genes are silenced. In tomato, after suppressed by Cel2 gene expression, the fruit softening and textural changes occurring in fruit pericarp was not revealed (Brummell et al. 1999). In the Cel1 (FaEG1) downregulated transgenic strawberry, the EG activity and firmness were indistinguishable from those of control fruit, and the expression of a second gene, Cel2 (FaEG3) was unaltered in the fruits of these transformants, which might have prevented the specific down-regulation of Cel1 from revealing its role in fruit softening (Woolley et al. 2001). The transgenic strawberry fruit with FaEG3 silencing showed similar firmness with control fruit (Mercado et al. 2010). There is more than one EGs expressed in tomato and strawberry fruit and this might explain the lack of effect. But in capsicum pepper, there was only a single gene of EG, and it has no effect on hemicellulose depolymerisation when the gene was silenced (Harpster et al. 2002a, 2002b). The function of PbEG3 in fruit softening will be further validated by next transgenic studies.
Acknowledgements The work was financially supported by the Project of National Natural Science Foundation of China (31201608), A Project of Shandong Province Higher Educational Science and Technology Program (J09LC13), Shangdong Province Young and Middle-Aged Scientists Research Awards Fund (BS2010NY009), and the Science and Technology Foundation Program of Qingdao, People's Republic of China (No. 12-1-4-5-(8)-jch).