Technical Papers
Characterization of Microbial Community during the Fermentation of Chinese Homemade paocai, a Traditional Fermented Vegetable Food
2016 Volume 22 Issue 4 Pages 467-475
Details
2016 Volume 22 Issue 4 Pages 467-475
The microbial community in the fermentation process of Chinese homemade paocai (CHP), which was a traditional fermented vegetable food in China, was analyzed firstly by PCR-denaturing gradient gel electrophoresis (DGGE) and quantitative PCR (qPCR). In bacterial DGGE profile, a total of 15 bands were identified, which fell into two phyla including Firmicutes and Proteobacteria, and Weissella, Lactobacillus, Lactococcus, Bacillus, Citrobacter, Pantoea, Pseudomomas and unclassified Pseudomonadales were detected. Weissella, Lactobacillus and Lactococcus are dominant lactic acid bacteria (LAB) during the CHP fermentation. The number of Weissella, which was detected as the dominant bacteria during the whole fermentation, was quantitated and its quantity was shown to exist at 107 – 108 cells/mL during the fermentation. The results of fungal DGGE analysis demonstrated two genera, Pichia and Geotrichum, were detected and Pichia was the main yeast during the whole CHP fermentation process. There are microbial successions occurred in the CHP fermentation process.
As a relatively cost-effective and low energy preservation process, fermentation is famous and ancient food processing and preservation technique which is essential in increasing the shelf-life, improving the microbiological safety, sensory and nutritional properties of the product (Liu et al., 2011). To date, the production of fermented vegetables is usually made by spontaneous fermentation with various naturally bacteria present on the raw materials (Tanganurat et al., 2009). Paocai is a typical representative of traditional mildly and lactic acid fermented vegetable foods in China, especially in Sichuan Province where it was originated. It was recorded that Chinese made paocai as early as more than 3000 years ago in Zhou Dynasty (Xiong et al., 2012). Nowadays, the production method of CHP has not been changed for many years and is mostly based on spontaneous fermentation both in homemade and industrial processes (Xiong et al., 2012). The general production process is that various vegetables, such as cabbage, radish, celery, lettuce and pepper, are pretreated and then immersed in 6 – 8% (w/v) salt solution along with a certain amount of spices and additives like garlic, Illicium verum, and then left at ambient temperature to undergo lactic acid fermentation. Then the majority fermentation is natural microorganisms in the vegetables and ingredients competing with each other under the presence of salt at the beginning of fermentation. Paocai is normally served as side dish or used as an appetizer and in recent years it has been recognized as a healthy functional food because of its healthcare function (Xiong et al., 2012; Yan et al., 2008). To meet the increasing demand of the people and improve the yield and quality of paocai, it is necessary to understand fully the microbial community occurred in the fermentation process of paocai. It is well-known that the conventional culture method is often time-consuming and laboursome. Due to these limitations, the powerful culture-independent 16S ribosomal RNA (rRNA) gene-based PCR technique, such as PCR-DGGE (Nie et al., 2015), real-time PCR (Paul et al., 2015), Amplified Ribosomal DNA Restriction Analysis (ARDRA) (Park et al., 2014), fluorescent in situ hybridization (FISH) (Ding et al., 2014), etc., have been widely applied to investigate the diversity and dynamics of the microbial community in the field of food in recent years. PCR-DGGE, a classical molecular ecological technic, has been shown to be a suitable tool and widely applied to directly reveal and rapidly monitor the microbial community in the process of fermentation (Nie et al., 2015; Ramos et al., 2010). PCR-DGGE has been used to study the microbial community structure of fermented vegetable food. Yeun et al. (2014) identified the most prevalent LAB in salted Chinese cabbage by using PCR-DGGE. Chang et al. (2008) characterized bacterial, archaeal and yeast dynamics during various types of kimchi fermentation by using PCR-DGGE. Lee et al. (2005) determined the microfloral composition during the fermentation of kimchi using PCR-DGGE and found that the LAB including Weissella confusa, Leuconostoc citreum, Lactobacillus sakei, and Lactobacillus curvatus were the main microorganisms responsible for kimchi fermentation. As a complementary method, qPCR technology which has been used to quantitatively determine microbe in various foods (Paul et al., 2015; Makino et al., 2010; Sakamoto et al., 2010) was used to quantitate the Weissella in the fermentation process of CHP.
Therefore, the major objective of this study was to investigate the characteristic of the microbial community structures in the fermentation process of CHP. For the best of our knowledge, this is the first report to reveal the diversity of microbial community in the fermentation process of CHP by using PCR-DGGE and qPCR methods.
CHP preparation and sampling Paocai fermentation was performed in accordance with the traditional method from western China. CHP were prepared using cabbage, cowpea, carrot and minor ingredients such as ginger, pepper and green pepper. Fresh vegetables was purchased from local supermarket, washed, cut into pieces and then submerged into brine solution (6% w/v NaCl) in sterilized jars. The jar was sealed with water, and then kept at ambient temperature (20 – 25°C) for 30 days. During the fermentation, brine samples were collected at regular interval for the measurements of pH, acidity and analysis of microbial community. Fermentation was performed twice and the average values are presented.
Physico-chemical analyses Fermentation was monitored by measuring pH value and total titratable acidity (TTA). The pH value of the brine was measured with a pH meter. TTA was titrated using 0.1 N NaOH to final pH 8.2 with phenolphthalein as the indicator. The TTA was expressed in % lactic acid. All analyses were conducted in duplicate and the average values are presented.
DNA extraction and PCR amplification The total DNA was extracted by using the E.Z.N.A.® Water DNA Kit (Omega, USA) and subsequently stored at −20°C until used.
The PCR was carried out in a MyCycler™ Thermal (Bio Rad, USA). The V3 fragment of 16S rRNA gene was amplified by using the primers P3-GC (5′ - CGC CCG CCG CGC GCG GCG GGC GGG GCG GGG GCA CGG GGG GCC TAC GGG AGG CAG CAG - 3′) and P2 (5′ - ATT ACC GCG GCT GCT GG - 3′) (Muyzer et al., 1993). For the fungi, the 18S rRNA gene was amplified by using primers NS3-GC (5′- CGC CCG CCG CGC GCG GCG GGC GGG GCG GGG GCA CGG GGG GGC AAG TCT GGT GCC AGC AGC C - 3′) and YM951r (5′- TTG GCA AAT GCT TTC GC - 3′) (Haruta et al., 2006). The primers were synthesized by the Sangon Biotech Company (Shanghai, China). The PCR was performed in a 50 µL volume containing PCR Mix (Tiangen Biotech, Beijing, China), 20 pmol primers, 10 ng of template DNA and distilled water. A touchdown PCR of 16S rRNA gene was performed as follows: initial denaturation at 94°C for 4 min, followed by 20 cycles of denaturation at 94°C for 60 s, annealing at 65°C for 60 s and reduced by 0.5°C every cycle, elongation at 72°C for 60 s, and afterwards, 10 cycles of denaturation at 94°C for 60 s, annealing at 55°C for 60 s, elongation at 72°C for 60 s, and finally a 10 min elongation step at 72°C. The PCR of 18S rRNA gene was initiated at 94°C for 5 min, followed by 30 cycles of denaturation at 94°C for 60 s, annealing at 53°C for 60 s and extension at 72°C for 60 s, and a final extension at 72°C for 5 min. After cycling, the PCR products were detected by electrophoresis on a 2% agarose gel to check the size of the amplification fragment.
PCR-DGGE analysis of microbial community during the fermentation The DGGE of PCR products were performed by using the D-Code™ Universal Mutation Detection System (Bio-Rad, Hercules, CA, USA). To acquire the microbial community structure, DGGE was performed with 8% polyacrylamide gel (Acrylamide/Bisacrylamide, 37.5:1 w/w) with a linear gradient of 30 – 50% denaturant for bacterial community and 20 – 40% for fungal community (100% denaturant corresponds to 7 mol L−1 urea and 40% formamide). The electrophoresis of 16S rRNA and 18S rRNA genes was performed in 1×TAE buffer at constant voltage of 200 V for 4 h and 160 V for 5h at 60°C respectively. After electrophoresis, the gel was stained using SYBR Green I diluted 1:10,000 (v/v) in distilled water three times at intervals of 15 min and subsequently the gel was visualized using a Gel Doc™ XR (Bio-Rad, USA). The DGGE profiles were analyzed by Quantity One software (Bio-Rad, USA). The band Richness (R), Shannon-Wiener index (H) and Pielou (E) were determined on the basis of the band presence/absence and relative quantity. The R showed that the number of bands in DGGE profiles. The H gives the proportional abundance of species and reacts sensitively to rare species and when all species are represented by the same number of individuals, the H reaches its maximum value (Shannon, 1949). In order to describe the uniformity of the distribution of the individuals on the number of bands, the E was presented (Pielou, 1966). To visualize the similarity of microbiota during the fermentation, principal component analysis (PCA) was performed using Canoco for Windows v4.5 software (Wageningen UR, Netherlands).
Sequencing of representative DGGE bands The representative bands observed in the DGGE profiles were excised from the gel with a sterile scalpel. The DNA which was eluted from excised bands was re-amplified using the primers mentioned above with no GC-clamp and then the amplified products were sent for cloning and sequencing by Sangon Company (shanghai, China). To identify their closest phylogenetic relatives, the sequence information was acquired by aligning the results with the sequences available in GenBank using the BLAST search program at the National Center for Biotechnology Information (NCBI) (i) and the Classifier search program at the Ribosomal Database Project (RDP) (ii).
qPCR analysis of Weissella during the whole CHP fermentation In order to determine the quantity of the Weissella, a qPCR approach with SYBR Green I was used. The primers of wei472f (5′- GAG TAA CTG TTC AGT GTG TGA CGG - 3′) and wei662r (5′ - TCA TCC AGT TTC CAA AGC CAT - 3′) (Zhao et al., 2014) were used to perform in a Light cycler Nano System (Roche, Switzerland). The amplification reactions were carried out in a total volume of 20 µL containing SYBR® Green PCR Master mix (Toyobo, Japan), 2 pmol each primer, DNA template and distilled water. The amplification program was as follows: initial denaturation at 95°C for 10 min, followed by 40 cycles of denaturation at 95°C for 15 s, annealing at 60°C for 30 s, and extension at 72°C for 15 s, with collection of fluorescence signal at the end of each cycle.
DNA melting curves, as an additional quality control step for the analysis of qPCR data to verify the specificity of amplified products, can distinguish false positive signals due to non-specific amplification or primer-dimers (Soares et al., 2013). The melting curve analysis was carried out after amplification by heating gradually from 60°C to 95°C at 0.1°C/s with continuous fluorescence monitoring. The standard curve was generated by a 10-fold serial dilution of plasmid, which were prepared from the 16S rRNA gene cloning library using Mini Plasmid Kit (Tiangen, Beijing, China). All samples and standards were performed in duplicate and the average values of the results were taken. Amplification efficiency (E') of the qPCR was estimated by the slope of the standard curve with the formula Eq. 1. The quality of the amplification was evaluated by the generation of melting curves of the PCR products.
 |
In China, fermented foods such as baijiu (Chinese liquor), vinegar, soy sauce, and fermented soybean paste are quite popular and have improved the quality of the Chinese diet and enriched dishes all over the world (Han et al., 2001). Paocai is also a traditional fermented food which drives by spontaneous fermentation microorganism. In order to understand the fermenting process of CHP, the combined PCR-DGGE and qPCR analysis was firstly undertaken to explore the dynamic change of microbial communities in this study.
Changes of pH and TTA during fermentation The pH and TTA were considered as fundamental variables determining the maturity of fermentation (Penas et al., 2010). The evolution of pH and TTA during spontaneous CHP fermentation was shown in Fig. 1. Throughout the fermentation, the mean pH value was 6.65 at first, decreased more rapidly to 3.03 during the initial 5 days of fermentation. After 5 days, the pH decreased slowly and remained steady after ninth day of fermentation. TTA value was 0 initially, increased to 0.58 until the 12th day and remained stable (Fig. 1).
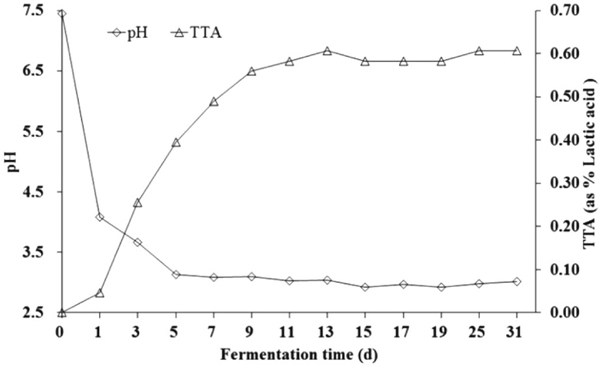
Changes in the pH and total titratable acidity (TTA) values in CHP during fermentation. The values of the pH and TTA were derived from duplicate CHP samples, and the average values were presented.
Microbial community diversity in whole fermentation Bacterial DGGE profile of the 16S rRNA gene was shown in Fig. 2 and a total of 15 bands were identified, and the R of DGGE bands at 13th and 15th day during CHP fermentation were more than that at other days (Table 1). The microbial groups shifted sequentially from less acid tolerant to more acid tolerant groups adapted to the acidic environmental condition (Fierer et al., 2006; Plengvidhya et al., 2007). Therefore, initially the rapid decrease of pH resulted in a rapid decrease of H from 2.23 at first to 1.37 at 5th day. After 5th day, the pH had little change and the microbial groups adapted to the acidic environmental condition. Then the H was increased to the maximum 2.28 at 15th day and subsequently remained steady (Table 1). But the R and H of 19d were lower than them of before and after period possibly because the relative amounts of some bands (such as band 4, 9) decreased to minimum or were low at 19d. This may be due to the accumulation of TTA and artifacts caused by PCR amplification (Kisand et al. 2003). The E of bacterial community was 0.90 at the first day which was the maximum (Table 1). The DGGE profile of fungal community in the fermentation process of CHP was shown in Fig. 3 and a total of 7 bands were identified. As shown in Table 1, the R of fungal community was obviously less than that of bacterial community. The H of fungal community was 1.31 initially, increased to 1.47 at 5th day and then decreased to a constant value 1.03 at 17th day.
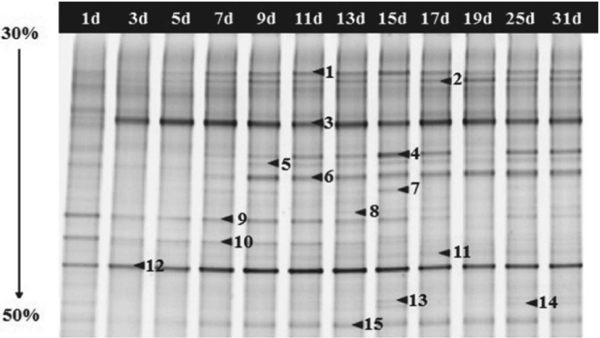
The bacterial PCR-DGGE profile of CHP samples. Lanes 1d-31d represented the CHP samples collected from the fermentation process respectively. The bands indicated by the arrows and numbers were excised and sequenced, and the alignment results were listed in Table 2.
| Fermentation time (d) | Bacterial diversity | Fungal diversity | Concentration of Weissella (Cells/mL) | ||||
|---|---|---|---|---|---|---|---|
| Richness (R) | Shannon-Wiener (H) | Pielou (E) | Richness (R) | Shannon-Wiener (H) | Pielou (E) | ||
| 1 | 12 | 2.23 | 0.90 | 4 | 1.31 | 0.95 | (7.93 ± 0.20)×107 |
| 3 | 8 | 1.55 | 0.74 | 5 | 1.43 | 0.89 | (8.91 ± 0.16)×108 |
| 5 | 8 | 1.37 | 0.66 | 6 | 1.47 | 0.82 | (8.96 ± 0.05)×107 |
| 7 | 13 | 1.82 | 0.71 | 5 | 1.23 | 0.76 | (3.52 ± 0.03)×107 |
| 9 | 13 | 1.99 | 0.77 | 5 | 1.12 | 0.70 | (1.83 ± 0.03)×107 |
| 11 | 14 | 2.07 | 0.79 | 5 | 1.18 | 0.73 | (1.79 ± 0.00)×107 |
| 13 | 15 | 2.02 | 0.75 | 4 | 1.10 | 0.79 | (2.08 ± 0.07)×107 |
| 15 | 15 | 2.28 | 0.84 | 4 | 1.09 | 0.78 | (1.38 ± 0.01)×107 |
| 17 | 13 | 2.03 | 0.79 | 4 | 1.03 | 0.75 | (1.20 ± 0.00)×107 |
| 19 | 11 | 1.78 | 0.74 | 4 | 1.02 | 0.74 | (5.72 ± 0.03)×107 |
| 25 | 14 | 2.20 | 0.83 | 3 | 0.92 | 0.83 | (1.47 ± 0.00)×107 |
| 31 | 14 | 2.11 | 0.80 | 3 | 0.88 | 0.80 | (3.02 ± 0.05)×107 |
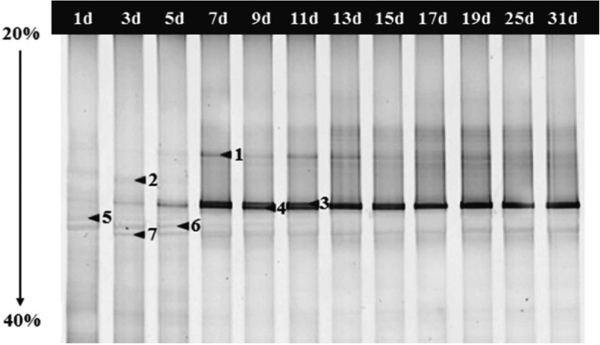
The fungal PCR-DGGE profile of CHP samples. Lanes 1d-31d represented the CHP samples collected from the fermentation process respectively. The bands indicated by the arrows and numbers were excised and sequenced, and the alignment results were listed in Table 2.
Dynamics of microbial community during the whole fermentation In order to identify the microbial community, the sequencing results of the major bands in the DGGE profiles (Fig. 2) were shown in Table 2. As shown in Fig. 2, a total of 15 bands were identified, which fell into two phyla including Firmicutes (10 bands) and Proteobacteria (5 bands). The similarity of all band sequences was nearly ≥ 99% comparing with those available in the GenBank database. Among Lactobacillales affiliated to Firmicutes, Lactobacillus (bands 1, 2, 5 and 11), Weissella (bands 3 and 12), Lactococcus (bands 8, 14 and 15) were detected in whole fermentation process. Lactobacillus is regarded as a kind of bacteria that produce plenty of lactic acid by fermenting carbohydrate and one of the dominant LABs in vegetable fermentations (Xiong et al., 2013; Endo et al., 2008). This bacterium is a beneficial microorganism that is widely used as a starter for various fermented products (Ryu et al., 2014). Weissella (W.), a separated LAB of Lactobacillus family, was dominant in kimchi fermentation and produces lactic acid, acetic acid, alcohol, dextran, and CO2, which account for the unique fresh taste and texture of kimchi (Lee et al., 2011). The species W. cibaria, W. confuse, and W. koreensis have been described to be associated with vegetable fermentations (Kot et al., 2014). In this study, Weissella was dominant in CHP fermentation. W. confuse and W. koreensis remained present throughout the fermentation process, indicating their importance in CHP. This was also found in kimchi fermentation (Lee et al., 2005; Bae et al., 2005). Kim et al. (2005) reported that W. koreensis is the predominant species in commercial kimchi by culture-independent methods. Lactococcus lactis is a LAB species growing in a variety of niches. It is frequently encountered on vegetable substrates as well as in the dairy environment (Bachmann et al., 2012; Kelly et al., 2010). Lactococcus lactis rapidly acidify milk and greatly contribute to the flavor of the fermentation end-products (van de Bunt et al. 2014). Potentially, it is also contribute to the flavor of the CHP. In addition, Bacillus (band 13) affiliated to Firmicutes were also detected. The genus Bacillus can produce various hydrolases such as protease, cellulose and amylases and thus contribute to the liquefaction and saccharification of carbohydrate (Ramos et al., 2011). Among proteobacteria, Citrobacter (band 9) and Pantoea (band 6) affiliated to Enterobacteriaceae were detected in earlier and later stage of fermentation. Pseudomomas (band 4 and 10) and unclassified Pseudomonadales (band 7) were also detected. Héctor et al. (2015) isolated Citrobacter sp. which shows significant cellulolytic activity and has potential biotechnological applications. Pantoea, a genera classified in the Enterobacteriaceae, is characterized by its ubiquity in nature and its frequent association with plant, vegetables, grains and fruits (Zhang et al., 2015; Nadarasah et al., 2014; Walterson et al., 2015). Pseudomonas is complex and highly versatile organisms, and can adapt to a wide range of habitats which accounts for their constant presence in various environment (Gomila et al., 2015). Previous studies declared that Pseudomonas strongly dominate the microbiota of fresh vegetables (Nübling et al., 2016). So the detection of Pseudomonas is reasonable in this study.
| Bandsa | Closest sequence/microorganism | Phylogenetic affiliation | Identity (%) | Alignment length (bp) | Accession No. |
|---|---|---|---|---|---|
| Bacteria | |||||
| 1,11 | Lactobacillus brevis strain IFM3 | Lactobacillus | 99,100 | 195 | KR350500.1 |
| 2 | Lactobacillus plantarum strain SP-5 | Lactobacillus | 99 | 196 | KT371518.1 |
| 3 | Weissella koreensis KACC 15510 | Weissella | 100 | 196 | NR_075058.1 |
| 4 | Pseudomonas plecoglossicida strain LT34 | Pseudomonas | 99 | 196 | KP691591.1 |
| 5 | Lactobacillus plantarum strain 122 | Lactobacillus | 99 | 196 | KR051152.1 |
| 6 | Enterobacteriaceae bacterium X1/SB37 | Pantoea | 100 | 195 | LC007922.1 |
| 7 | Uncultured Pseudomonadales clone B3 20 106 | Pseudomonadales | 99 | 196 | JN866274.1 |
| 8,14,15 | Lactococcus lactis subsp. lactis strain 191 | Lactococcus | 100 | 196,197 | KR051163.1 |
| 9 | Citrobacter sp. R56 | Citrobacter | 99 | 196 | KP067116.1 |
| 10 | Pseudomonas sp. TL14(2) | Pseudomonas | 100 | 196 | KF444360.1 |
| 12 | Weissella confusa strain PUFSTFMId055 | Weissella | 100 | 196 | AB831188.1 |
| 13 | Bacillus sp. strain P4 | Bacillus | 100 | 196 | LN850274.1 |
| Fungi | |||||
| 1, 3, 6 | Pichia kluyveri var. strain NRRLY-11519 | Pichia | 99 | 387 | EF550389.1 |
| 2, 7 | Geotrichum candidum clone AS F-1 | Geotrichum | 100 | 392 | KJ543497.1 |
| 4 | Pichia kluyveri var. strain NRRLY-11519 | Pichia | 100 | 386 | EF550389.1 |
| 5 | Geotrichum candidum clone AS F-1 | Geotrichum | 100 | 391 | KJ543497.1 |
For fungal PCR-DGGE (Fig. 3), a total of 7 bands were identified, and the sequencing results were shown in Table 2. Compared with the sequences in the GenBank, the similarity of the excised bands were ≥ 99%. All sequenced bands were affiliated with two genera, including Pichia (P.) (bands 1, 3, 4 and 6) and Geotrichum (bands 2, 5 and 7). Obviously, Pichia was dominant in the fermentation process of CHP. It has been isolated from kimchi at low pH that have been fermented over a long period of time (Oh et al., 2003). Regarding P. kluyveri, this species has never been reported as being the dominant yeast species. However it has previously been described in fermentations (Chang et al., 2008; Moreira et al., 2013). Crafack et al. (2013) found that starter culture containing P. kluyveri seemed to have a positive influence on the flavor profile of chocolate. Potentially, P. kluyveri has a positive influence on the flavor of CHP. Further, Labbani et al. (2015) found that a novel killer protein secreted by a P. kluyveri strain was active against yeasts. This possibly accounted for the decrease of the Geotrichum candidum in the fermentation process of CHP. Geotrichum candidum is naturally present in raw milk and one of the dominant yeasts on the surface of cheeses (Castellote et al., 2015). It could produce various enzymes such as amylase, lipase and hexanol dehydrogenase, generating several flavor compounds (Maldonado et al., 2015; Zhang et al., 2013).
It is well established that LAB are important microorganisms in the CHP fermentation process. Moreover, the LAB that has been reported in this study has also being described during production of other spontaneously fermented vegetables (Plengvidhya et al., 2007; Paramithiotis et al., 2010; Sánchez et al., 2000).
Multivariate analysis of DGGE profiles DGGE profiles were also analyzed statistically using PCA, taking into account the relative quantity and the absence or presence of the bands (Fig. 4A). Using the PCA plot for the microbial communities of CHP samples, the principal components PC1 and PC2 accounted for 58.20% and 37.30% of the variance (Fig. 4A). PCA plot analysis showed that the distribution and relationship between microbe and fermentation process. The PCA ordination of the genera and sample variables demonstrated that Citrobacter and Geotrichum were correlated with the earlier stage of fermentation. By contrast, five genera, including Pantoea, Bacillus, Lactococcus, Pichia and Unclassified Pseudomonadales were correlated with the later period of fermentation. Similarly, Weissella, Lactobacillus and Pseudomonas showed a strongly correlation with the whole period of fermentation. In Fig. 4B, the relative quantities of Citrobacter and Geotrichum were decreased while those of Pantoea, Bacillus, Lactococcus, and Pichia were increased during the fermentation process, which were in accordance with the PCA analysis.
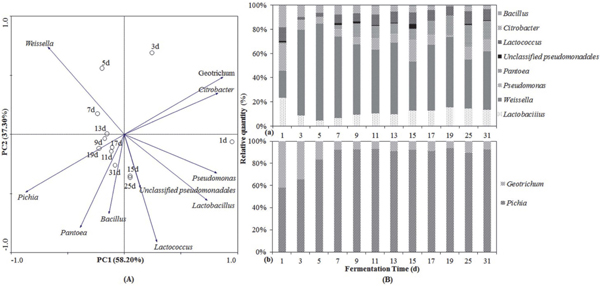
Principal component analysis (A) and relative abundance (B) of microorganisms during the CHP fermentation at a genus level. The directions of the arrows indicate the relative loading on the first and second principal components.
Quantitative analysis of Weissella using qPCR To analyze the bacterial diversity in CHP samples more exactly, the quantity of Weissella was monitored by qPCR. The amplification curves were of sigmoidal form and the melting curves only had one peak, indicating that the specificity of primers was good. No primer dimers or non-specific amplification products were visible for all samples. The standard curve was as Eq. 2.
 |
The R2 (0.993) and E’ (1.05) suggested a good correlation between Cq and the natural logarithm of template concentrations. According to the mean 16S rRNA gene copy number (Stoddard et al., 2015), the quantity of Weissella in the fermentation process of CHP was calculated and the results were shown in Table 1. The Weissella was shown to exist at 107 – 108 cells/mL in CHP samples. There were higher initial cell numbers ((7.93 ± 0.2) ×107 cells/mL) and it increased rapidly to the highest ((8.91 ± 1.57) ×108 cells/mL) at 3th day of fermentation. After 9th day of fermentation, the quantity of Weissella in the fermentation process of CHP was stable at 1 – 3 × 10⁷ cells/mL. The qPCR has been used to detect and quantify LAB at a genus or species level, such as Lactococcus, Lactobacillus, Enterococcus and Leuconostoc, in various food matrices (Achilleos et al., 2013; Kim et al., 2015; Lu et al., 2015). Despite the potential of this type of technique, little research was reported concerning the use of qPCR to identify the genus Weissella in food products. Gomez-Rojo et al. (2015) reported the development of a new qPCR procedure based on a recN gene sequence that can be used to detect and quantify W. viridescens in food matrices. Zhao et al. (2014) had developed a single qPCR method for the detection of Weissella spp and found that the predominating bacteria were Weissella spp. (similar to 107 – 108 cells/mL) during the 5 – 20 days of fermentation wax gourd. The factors that determine the results of spontaneous vegetable fermentation include the naturally occurring microbial populations in the raw materials as well as the environmental conditions such as pH, temperature and salt concentration.
In this study, combined PCR-DGGE and qPCR analysis was firstly used to elucidate the microbial community in the fermentation process of CHP. Results of bacterial DGGE analysis illustrated that two phyla (Firmicutes and Proteobacteria) including Weissella, Lactobacillus, Lactococcus, Bacillus, Citrobacter, Pantoea, Pseudomomas and unclassified Pseudomonadales were identified, and Weissella was the dominant bacteria in whole fermentation process. It is well established that Weissella, Lactobacillus and Lactococcus are dominant and main LAB in the CHP fermentation process. The number of Weissella was quantitated and the quantity of Weissella during the fermentation was shown to exist at 107 – 108 cells/mL. The results of fungal DGGE analysis demonstrated that a total of 7 bands identified, and only 2 genera, Pichia and Geotrichum, were detected and obviously Pichia was the main yeast during the fermentation process of CHP. The results presented in this study will contribute to the understanding of microbial population dynamics during the fermentation processes of CHP.
Acknowledgment The study was financially supported by grants from the National Science and Technology Project (NO. 2012BAD31B04) of the Ministry of Science and Technology of the People's Republic of China, and the Key Science and Technology Project (NO. 2013NZ0055) of the Sichuan Science and Technology Department.
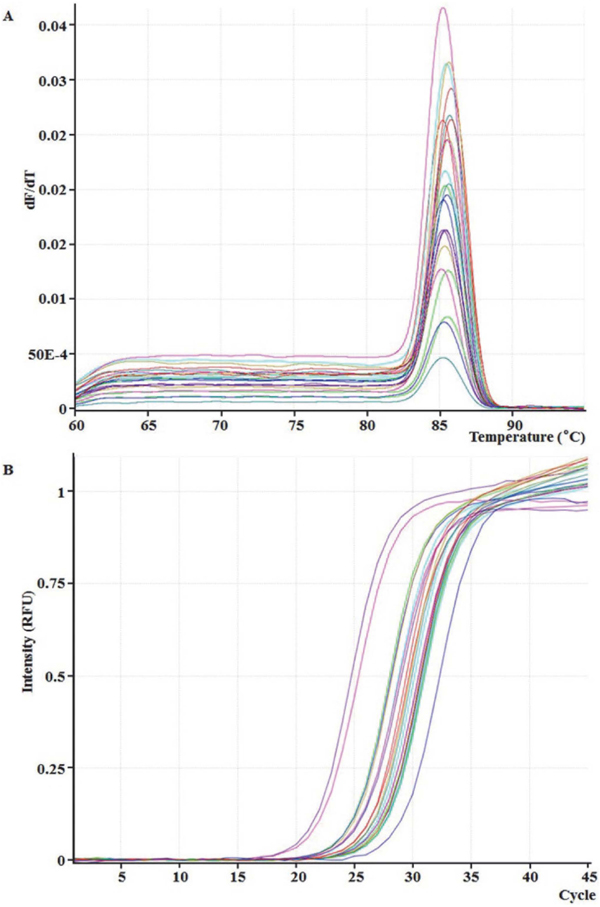
The melting curves (A) and amplification curve (B) for Weissella in CHP samples of the fermentation process.