Abstract
Molecular nutrition study is essential for assessing food quality. Pyropia haitanensis is nutritious and delicious health food in southern China. Consumers prefer the first harvested P. haitanensis for its tender taste. To understand the comprehensive alteration in the nutrition of P. haitanensis with different harvest time, we characterized the metabolomic variations induced by harvest time using NMR spectroscopy coupled with multivariate data analysis. We found that harvest time was an important factor influencing the nutrient composition of P. haitanensis. The levels of glutamine, alanine, aspartate, taurine, and isofloridoside contained in seaweeds were significantly increased over the harvest time. These findings enhanced our understanding of the nutritional features of P. haitanensis harvested at different times and provided useful information on the quality assessment of P. haitanensis.
Introduction
The main quality aspect of food derives from the nutritional value (Picone et al., 2011). Nowadays, molecular nutrition study has become an important approach in the field of food science and technology especially when more chemical details are needed for the food quality assessment. Different from the traditional food component analysis focusing on the broad food constituents such as proteins, fats and carbohydrates, the molecular nutrition study is based on hundreds or even thousands of distinct chemical identities being detected and/or identified in food (Wishart, 2008). NMR-based metabolomics concerns with the high-throughput and nondestructive identification and quantification of many of the metabolites present in a biological sample (Lin and Shapiro, 1997). It has been widely applied for the quality assessment of plants such as pistachios (Sciubba et al., 2014), green tea (Lee et al., 2015), and apples (Tomita et al., 2015) in different geographical origins. Such applications have also been extended for the discrimination of Hayward kiwifruits (Capitani et al., 2010), and cherry tomatoes (Masetti et al. 2014) cropped different seasons. In particular, we have reported the differences of metabolic phenotypes of seaweeds and crabs using NMR-based metabolomic studies (Ye et al., 2013; 2014).
Pyropia haitanensis is a kind of nutritious and delicious health food in southern China due to the abundant protein, polysaccharide, vitamins, minerals and amino acids (Zeng et al., 2003). The seaweeds are usually harvested for four times from the autumn to next summer. Consumers prefer the first harvested P. haitanensis due to its tenderness. The seaweed gets less tender with the harvest time. Consequently, the seaweed market is dominated by the first three harvested P. haitanensis. Traditionally, the quality of P. haitanensis at the different harvest times is evaluated according to the contents of protein, fat, ash and fiber (Ying et al., 2009). However, this kind of evaluation only considers the broad food constituents. The comprehensive metabolic profiles of seaweeds over the harvest time remain to be elucidated.
In this work, we systematically investigated the metabolomic changes in P. haitanensis harvested for the first three times using 1H NMR spectroscopy and multivariate data analysis. The objective is to define the molecular nutritional features of P. haitanensis associated with different harvest times, which is of potential importance for assessing the seaweed quality.
Materials and Methods
Chemicals and Reagents Methanol, K2HPO4·3H2O and NaH2PO4·2H2O (all in analytical grade) were purchased from Sinopharm chemical Co., Ltd. (Shanghai, China). Sodium 3-trimethylsilyl [2,2,3,3-2D4] propionate (TSP) and Deuterated water (D2O, 99.9% in D) were purchased from Cambridge Isotope Laboratories. (Miami, FL, USA). Phosphate buffer (K2HPO4/NaH2PO4, 0.1 M, pH 7.4) was prepared in H2O containing 90% D2O to provide an NMR field lock and 0.005% TSP (w/v) as an internal standard (Xiao et al., 2009).
Sample collection and extraction Fresh thalli of P. haitanensis Chang et Zheng were harvested from the farmed areas in Xiangshan Port, Ningbo, China for the first time on November 8th, 2014 (designated H1), for the second time on December 20th, 2014 (designated H2), and for the third time on January 28th, 2015 (designated H3), respectively. All samples were rinsed with the clean seawater to remove the sediment and then air-dried at ambient with good ventilation for overnight. Three groups of seaweed samples were respectively kept in sealed plastic bags and stored at −20°C for later analysis.
All seaweed samples were cut into pieces using scissors. In all cases, the same pool of raw materials from 3 individual thalli was divided into ten portions. Each portion (100 mg) was extracted with sequentially twice with 600 µL of ice-cold methanol/H2O (2:1 v/v) solution using a tissue lyser (Qiagen TissueLyser, Retsch GmBH, Germany) at 20 Hz for 90 s, partly according to Wu's method (Wu, Li, Li, & Tang, 2014). After 10 min centrifugation at 12,000 rpm and 4°C (Eppendorf centrifuge, International Equipment Company, Dunstable, U.K.), the methanol was removed in vacuo and the supernatants were lyophilized. Each sample extract was reconstituted into 600 µL of phosphate buffer. Following 10 min centrifugation at 12,000 rpm and 4°C, 550 µL of the supernatant from each extract was respectively transferred into a 5 mm NMR tube for NMR analysis.
NMR measurements All NMR analyses for seaweed extracts were conducted on a Bruker Avance III 600 MHz spectrometer with an inverse probe (Bruker Biospin, Germany). 1H NMR spectra were acquired at 298 K using a NOESYGPPR1D pulse sequence. The water signal was suppressed with weak continuous wave irradiation during a 2 s relaxation delay and a 100 ms mixing time. Meanwhile, a 90° pulse length was adjusted to approximately 10 µs. Sixty-four transients were collected into 32 k data points for each spectrum with a spectral width of 20 ppm. For metabolite signal assignment purpose, a catalog of two-dimensional NMR spectra were acquired for selected samples and processed with similar parameters described previously (Aue et al., 1976; Aue et al., 1976; Braunschweiler and Ernst, 1983). These NMR spectra included 1H J-resolved spectroscopy, 1H-1H correlation spectroscopy, 1H-1H total correlation spectroscopy, 1H-13C heteronuclear single quantum coherence, and 1H-13C heteronuclear multiple bond correlation spectra.
NMR data processing and multivariate data analysis 1H NMR spectra were multiplied by an exponential function with a line broadening factor of 0.5 Hz and zero-filled to 128 k prior to Fourier transformation using TOPSPIN software (Bruker Biospin, Germany). These spectra were manually phase- and baseline-corrected with chemical shift referenced to the TSP signal as δ 0.00.
For multivariate data analysis, the region δ 0.8 – 5.3 of each one dimensional 1H NMR spectrum was uniformly bucketed into bins with a 2.4 Hz width. The regions δ 4.6 – 4.9 and δ 3.3 – 3.4 were removed to eliminate water and methanol signals. These binned data were further normalized to the total sum of all integrals for each spectrum to compensate for the overall concentration differences. The multivariate data analyses of the normalized NMR data sets were carried out using the software package SIMCA-P+ (V12.0, Umetrics, Sweden). Principal component analysis (PCA) was initially performed on mean-centered NMR data to visualize the general structure of each dataset and to identify any abnormalities within the dataset. Subsequently, orthogonal projection to latent structure discriminant analysis (OPLS-DA) was conducted on the NMR data scaled to unit variance. For OPLS-DA, 7-fold cross validation was used with NMR data as the X-matrix and the group information as the Y-matrix. The quality of all OPLS-DA models were evaluated with R2X and Q2 values, respectively indicating the explained variations and model predictabilities, and further validated for their robustness with a cross validation-analysis of variance (CV-ANOVA) approach with p < 0.05 as significant level (Eriksson et al., 2008). The coefficient plots for OPLS-DA models were generated from the back-transformed data (Cloarec et al., 2005) with an in-house developed MATLAB script (MATLAB 7.1, Mathworks Inc., USA). A cutoff value of 0.602 was used in this study and the metabolites with absolute value of correlation coefficient (r) above 0.602 were considered to be statistically significant (p < 0.05). In order to illustrate variations caused by harvest time, the relative changes of typical metabolites were also calculated against the levels of the first harvested group in the form of (Cm-C0)/C0, where Cm was the respective metabolite concentration in the second or third harvested group and C0 was that in the first harvested group.
Results and Discussion
NMR spectra for P. haitanensis extract A detailed investigation of the metabolic profiles of aqueous extracts of P. haitanensis harvested at three different times was carried out by 1H NMR spectroscopy. The assignments of 30 metabolites were achieved based on our previously reported findings (Ye et al., 2013) and further confirmed with a series of 2D NMR spectra. The representative 1H NMR spectra of aqueous extracts of P. haitanensis harvested at three different times are displayed in Fig. 1 with the corresponding 1H and 13C NMR chemical shifts and signal multiplicities listed in supplementary Table S1. The dominant metabolites in the seaweed extracts included a range of amino acids, carboxylic acids, sugars, betaine-related substances, and laminitol. In fact, these metabolites have been observed in three strains of P. haitanensis collected from Xiapu city, Fujian province, China (Ye et al., 2013). The metabolite composition of seaweeds in this study was only quantitatively different from that derived from Xiapu city. Such a quantitative not qualitative difference has also been observed in other plants such as chamomile (Wang et al., 2004), Salvia miltiorrhiza Bunge (Dai et al., 2010), pistachios (Sciubba et al., 2014) and green coffee bean (Kwon et al., 2015).
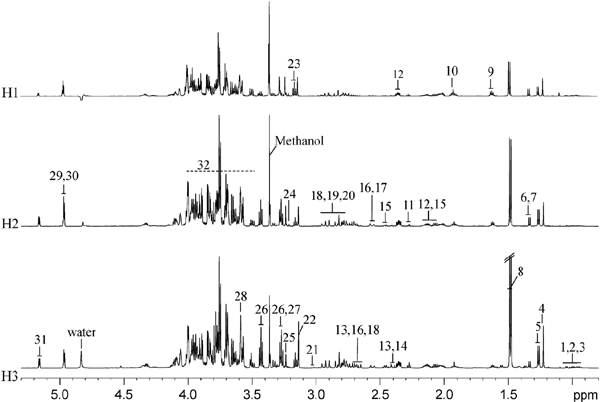
Table S1.
1H and
13C NMR data for metabolites in
P. haitanensis extracts
| No |
Metabolites |
Assignment |
δ1 H (multiplicity)a |
δ13 C |
| 1 |
Isoleucine |
βCH, γCH, γCH', γ'CH3, δCH3 |
1.98(#), 1.28(#), 1.48(#), 0.94(t), 1.01(d) |
38.4, 27.5 |
| 2 |
Leucine |
βCH2, βCH3, δ'CH3 |
1.72(#), 0.97(d), 0.96(d) |
42.8, 27.0, 23.9 |
| 3 |
Valine |
βCH, γCH3, δ'CH3 |
2.28(m), 0.99(d), 1.04(d) |
32.0, 20.9, 19.1 |
| 4 |
Laminitol |
CH3, 1-C, 2-CH, 3-CH, 4-CH |
1.23(s), 3.33(d), 3.58(#), 4.09(#) |
18.4, 79.5,74.5, 74.3, 76.1 |
| 5 |
6-Deoxy-ascobate |
6-CH3, 5-CHO, 4-CHO, CO, COOH |
1.26(d), 4.32(dd), 4.08(#) |
22.2, 71.0, 67.1, 161.5, 178.2 |
| 6 |
Lactate |
αCH, βCH3, COOH |
4.11(#), 1.33(#) |
183.1 |
| 7 |
Threonine |
αCH, βCH, γCH3 |
3.59(#), 4.26(#), 1.33(d) |
63.4, 69.3, 22.3 |
| 8 |
Alanine |
αCH, βCH3, COOH |
3.79(q), 1.49(d) |
53.4, 19.1, 178.8 |
| 9 |
2-hydroxy-5-aminovalerate |
αCH, βCH, βCH', γCH2, δCH2, COOH |
4(m), 1.93(m), 2.02(m), 1.62(m), 3.99(m) |
71.9, 59.3, 28.3, 22.3, 176.7 |
| 10 |
Acetate |
CH3, COOH |
1.93(s) |
26.8, 184.3 |
| 11 |
2-Oxo-5-aminovalerate |
αCH2, βCH2, γCH2, COOH |
2.27(t), 2.03(m), 3.32(d) |
36.2, 22.3, 68.8, 183.5 |
| 12 |
Glutamate |
αCH, βCH2, γCH2, δCO, COOH |
3.77(m), 2.06(m), 2.13(m), 2.36(dt) |
57.6, 29.8, 36.4, 184.3, 177.5 |
| 13 |
Malate |
αCH, βCH2 |
2.4(dd), 2.67(dd) |
70.9, 45.9 |
| 14 |
Succinate |
CH2 |
2.41(s) |
37.5 |
| 15 |
Glutamine |
αCH, βCH2, γCH2, CONH2, COOH |
3.77(t), 2.14(m), 2.45(m) |
57.2, 29.2, 33.8, 180.3, 176.8 |
| 16 |
Citrate |
αCH2, βCOH, γCOOH, δCH2, COOH |
2.54(d), 2.67(d) |
48.6, 78.2, 182.1, 48.6, 184.7 |
| 17 |
β-alanine |
αCH2, βCH2NH, COOH |
3.18(#), 2.56(t) |
39.6, 35.9, 181.2 |
| 18 |
Aspartate |
αCH, βCH2, γCOOH |
3.91(dd), 2.68(dd), 2.82(dd) |
55.2, 39.4, 180.3 |
| 19 |
Dimethylsulphoniopropionate |
αCH2, βCH2, S-CH3, COOH |
2.75(t), 3.46(t), 2.93(s) |
33.9, 43.3, 27.8, 179.9 |
| 20 |
Asparagine |
αCH, βCH2, γCONH2, COOH |
4.00(dd), 2.87(dd), 2.96(dd) |
54.2, 36.2, 180.3, 177.2 |
| 21 |
γ-amino-n-butyric acid |
αCH2, βCH2, γCH2NH2 |
2.3(t), 1.91(m), 3.01(t) |
55.7, 42.0 |
| 22 |
Choline-O-sulfate |
αCH2, βCH2, N-CH3 |
4.33(#), 3.69(#), 3.14(s) |
69.0, 55.8 |
| 23 |
Isethionate |
CH2, OCH2 |
3.16(t), 3.96(t) |
55.7, 59.8 |
| 24 |
Choline |
CH2OH, N-CH2, N-CH3 |
4.07(#), 3.53(#), 3.21(s) |
58.4, 70.2, 56.7 |
| 25 |
Betaine |
CH2, N-CH3 |
3.92(s), 3.23(s) |
68.7, 56.8 |
| 26 |
Taurine |
N-CH2, S-CH2 |
3.27(t), 3.42(t) |
50.5, 38.2 |
| 27 |
Betaine aldehyde |
N-CH3, CH2 |
3.27(s), 3.43(d) |
55.0, 79.9 |
| 28 |
Glycine |
αCH2, COOH |
3.58(s) |
175.8 |
| 29 |
L-isofloridoside |
C1H, C2H, C3H, C4H, C5H, C6H, C1'H, C2'H, C3'H |
4.96(d), 3.85(#), 3.89(#), 4.00(#), 3.91(#), 3.75(d), 3.82(#),3.50(dd) |
101.4, 71.4, 72.1, 72.2, 73.8, 63.9, 71.2, 71.6, 65.4 |
| 30 |
D-isofloridoside |
C1H |
4.97(d) |
# |
| 31 |
Floridoside |
C1H, C2H, C3H, C4H, C5H, C6H, C1'H, C2'H |
5.17(d), 3.85(#), 3.90(#), 4.01(#), 4.10(#), 3.75(d), 3.83(#) |
100.8, 71.2, 72.1, 72.2, 73.8, 63.9, 64.1, 81.4 |
| 32 |
Sugar and amino acids α-CH resonance |
αCH resonances |
3.46–4.03 |
# |
a Multiplicity: s, singlet; d, doublet; dd, doublet of doublets; t, triplet; q, quartet; m, multiplet; #: signals or multiplicities were not determined.
In this study, the harvest time resulted in an obvious difference in the concentrations of a number of metabolites of P. haitanensis among three groups (Figure 1). For instance, the levels of laminitol, alanine, and taurine were much higher in H3 group than other two groups. The isofloridoside level was highly altered over the harvest time. To mine more details of the metabolite differences and determine the statistical significance of metabolite in the group discrimination, multivariate data analysis were consequently carried out on the 1H NMR data.
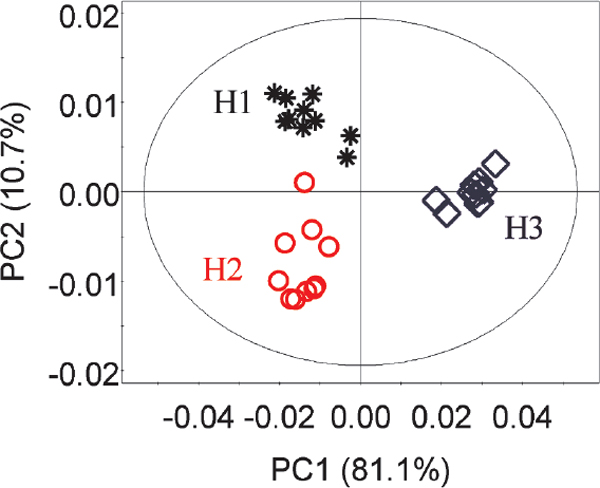
Metabolomic changes of P. haitanensis over the harvest time To overview the alteration of metabolic profiles of P. haitanensis harvested at three different times, the PCA scores plot was constructed based on the first two principle components (PC1 and PC2) (Figure 2). PC1 and PC2 explained 81.1% and 10.7% of the total variance, respectively. A clear differentiation was observed between seaweeds harvested in 2014 and those in 2015 by PC1. Furthermore, the PCA scores plot displays a clear separation between two groups harvested in 2014 by PC2.
The harvest time-related metabolite alterations were obtained by pairwise comparative OPLS-DA performed on the 1H NMR data from three P. haitanensis groups. To illustrative purpose, cross validated scores plots and corresponding coefficient plots are displayed in Figure 3. These three constructed OPLS-DA models were proved to be valid according to the high Q2 values indicating the model quality and low p values obtained from CV-ANOVA (Figure 3). The metabolites significantly contributed to the intergroup differentiation are illustrated in the coefficient plots (Figure 3, D–F) and the values of their corresponding correlation coefficients are listed in Table 1.

Table 1.
The correlation coefficients of significantly altered metabolites in the
P. yezoensis extracts for the first, second, and third harvest time, respectively
| Compounds |
Correlation coefficients (ra) |
| H1/H2 |
H1/H3 |
H2/H3 |
| Leucine |
−0.77 |
− |
− |
| Alanine |
− |
+0.99 |
+0.98 |
| Glutamine |
− |
+0.95 |
+0.94 |
| Aspartate |
+0.89 |
+0.83 |
+0.92 |
| Taurine |
+0.87 |
+0.89 |
+0.93 |
| 6-Deoxy-ascobate |
− |
+0.95 |
+0.92 |
| Lactate |
− |
−0.76 |
−0.78 |
| 2-Hydroxy-5-aminovalerate |
−0.85 |
−0.71 |
−0.94 |
| Isethionate |
−0.90 |
− |
− |
| Laminitol |
−0.76 |
− |
− |
| Betaine |
−0.86 |
− |
− |
| Choline-O-sulfate |
−0.80 |
− |
− |
| Isofloridoside |
+0.91 |
−0.99 |
−0.99 |
| Floridoside |
+0.90 |
− |
− |
a Correlation coefficients, positive and negative signs indicate positive and negative correlation in the concentrations, respectively. p = 0.05, df (degree of freedom) = 9, r = 0.602 was used as the corresponding cutoff value of correlation coefficient for the statistical significance based on the discrimination significance. “−” means the correlation coefficient |r| is less than cutoff value.
The third harvested P. haitanensis presented the obviously different metabolite profiles relative to the first two harvested seaweeds. It contained higher levels of 6-deoxy-ascobate, alanine, glutamine, aspartate, and taurine whereas lower levels of lactate, 2-hydroxy-5-aminovalerate, and isofloridoside compared to the first harvested seaweeds (Figure 3, E). It is interesting to note that the same metabolite alterations occurred between the third harvested seaweeds and the second harvested ones (Figure 3, F). However, this observation does not mean that the first two harvested seaweeds had the completely same metabolite profiles. In fact, the second harvested seaweeds had more aspartate, taurine, isofloridoside, and floridoside, but less lower concentrations of leucine, laminitol, choline-O-sulfate, 2-hydroxy-5-aminovalerate, isethionate, and betaine compared with the first harvested seaweeds (Figure 3, D).
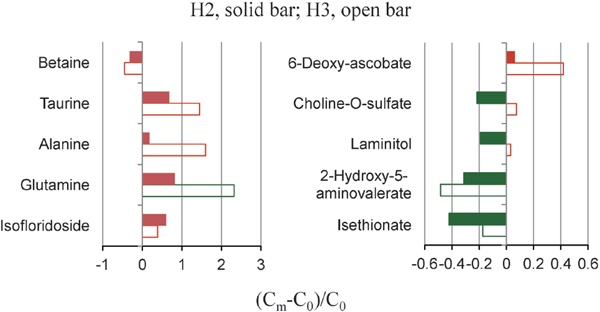
Furthermore, the dynamic changes of some metabolites over the harvest time by calculating the concentration ratios from H2 or H3 groups compared with those from H1 group (as control) are shown in Figure 4. Overall, the levels of glutamine, alanine, taurine, and 6-deoxy-ascobate were continuously elevated over the harvest time, with an increase of respective 2.3-fold, 1.6-fold, 1.4-fold, and 0.4-fold of control level. On the contrary, the levels of betaine and 2-hydroxy-5-aminovalerate had a negative correlation with the harvest time, both almost reduced to half of control level in the third harvested P. haitanensis. Moreover, the levels of two heterosides including floridoside and isofloridoside presented an opposite change over the harvest time. In addition, we also noted that choline-O-sulfate, laminitol, and isethionate sharply depleted firstly and then recovered thereafter.
Glutamine was highly accumulated in the third harvested P. haitanensis, indicating the increased taste and quality of seaweed. This is because glutamine can elicit a sweet sensation at low concentration whereas an umami taste at high concentration (Schiffman et al., 1981; Kawai et al., 2012). More importantly, this amino acid not only is an important nutrient for intestinal cell proliferation and growth (Dilsiz et al., 2003), but also exerts multiple biological activities in gut such as antioxidant, anti-apoptosis, and anti-inflammation (Wang et al., 2009). A marked elevation in the levels of alanine and aspartate over the harvest time further suggests an improved taste of the third harvested P. haitanensis relative to the earlier harvested seaweeds. The reason is that alanine, together with glutamate, is regarded as an important free amino acid contributing to the delicious taste of dried nori (Noda et al., 2003). Moreover, aspartate has been identified as one of the main substances for umami (Phat et al., 2016). Except for these three amino acids, taurine was also significantly accumulated in the third harvested P. haitanensis. Taurine is a well-known bioactive organic acid involved in numerous physiological processes such as membrane stabilization, detoxification, and antioxidation in organisms (Stapleton et al., 1997). A significant elevation of taurine level over the harvest time undoubtedly contributes to the improvement of seaweed quality.
On the other hand, the galactosylglycerol isofloridoside including two stereoisomers of D-, and L-forms was obviously reduced in the third harvested P. haitanensis, indicating a negative effect on the seaweed quality. This is because isofloridoside has been proved a bioactive compound and possesses significant antioxidant capacity (Li et al., 2010). Its isomeric form floridoside is also a bioactive compound involved in the suppression of pro-inflammatory responses in microglia (Kim et al., 2013), although no significant change of floridoside level was been observed in the third harvested seaweed relative to the first two harvested seaweeds. However, the second harvested P. haitanensis contained much more floridoside than the first harvested seaweeds. In addition, aspartate, taurine, and isofloridoside were all significantly increased in it. Collectively, the second harvested P. haitanensis therefore has improved taste and quality than the first harvested seaweeds.
Our results indicated that P. haitanensis has higher taste and quality with the harvest time. Although consumers prefer to the first harvested seaweeds according to the tenderness (Chen et al., 2011), the third harvested P. haitanensis would be recommended in terms of the nutrition and health. The holistic metabolome for the quality assessment of seaweed remains to be fully understood. Nevertheless, understanding the dominant primary and secondly metabolite composition of P. haitanensis will be helpful to comprehensively evaluate the seaweed quality.
Conclusion
The metabolomic profiles of P. haitanensis over the harvest time were investigated to reveal molecular nutritional differences of seaweeds induced by harvest time. We found that harvest time was an important factor influencing the nutrient composition of P. haitanensis and mainly related to a significant increase in the levels of glutamine, alanine, aspartate, taurine, and isofloridoside. These findings enhanced our understanding of the nutritional features of P. haitanensis harvested at different times and provided useful information on the quality assessment of P. haitanensis.
Acknowledgements This work was supported by the Ningbo Agricultural Technologies R&D Project (2012C10027), the Ningbo Science Project (2014C10044), the Academic Discipline Project of Ningbo University, China (No. XKl15D236) and the K.C. Wong Magna Fund in Ningbo University.
References
- Aue, W. P., Bartholdi, E., and Ernst, R. R. (1976). Two-dimensional spectroscopy. Application to nuclear magnetic-resonance. J.Chem. Phys., 64, 2229-2246.
- Aue, W.P., Karhan, J., and Ernst, R. R. (1976). Homonuclear broad-band decoupling and two-dimensional J-resolved NMR-spectroscopy. J. Chem. Phys., 64, 4226-4227.
- Braunschweiler, L., and Ernst, R. R. (1983). Coherence transfer by isotropic mixing, application to proton correlation spectroscopy. J. Magn. Reson., 53, 521-528.
- Capitani, D., Mannina, L., Proietti, N., Sobolev, A. P., Tomassini, A., Miccheli, A., Di-Cocco, M. E., Capuani, G., De-Salvador, F. R., and Delfini, M. (2010). Monitoring of metabolic profiling and water status of Hayward kiwifruits by nuclear magnetic resonance. Talanta, 82, 1826-1838.
- Chen, M., Xu, J., Pan, Q., and Gao, X. (2011). Analysis of nutritional composition and polysaccharide composition in low-value Porphyra haitanensis. Food Sci., 32, 230-234.
- Cloarec, O., Dumas, M. E., Trygg, J., Craig, A., Barton, R. H., Lindon, J. C., Nicholson, J. K., and Holmes E. (2005). Evaluation of the orthogonal projection on latent structure model limitations caused by chemical shift variability and improved visualization of biomarker changes in 1H NMR spectroscopic metabonomic studies. Anal. Chem., 77, 517-526.
- Dai, H., Xiao, C., Liu, H., Hao, F., and Tang, H. (2010). Combined NMR and LC-DAD-MS analysis reveals comprehensive metabonomic variations for three phenotypic cultivars of Salvia miltiorrhiza Bunge. J. Proteome Res., 9, 1565-1578.
- Dilsiz, A., Ciftçi, I., Aktan, T. M., Gürbilek, M., and Karagözoğlu, E. (2003). Enteral glutamine supplementation and dexamethasone attenuate the local intestinal damage in rats with experimental necrotizing enterocolitis. Pediatr. Surg. Int., 19, 578-582.
- Eriksson, L., Trygg, J., and Wold, S. (2008). CV-ANOVA for significance testing of PLS and OPLS (R) models. J. Chemom., 22, 594-600.
- Kawai, M., Sekine-Hayakawa, Y., Okiyama, A., and Ninomiya, Y. (2012). Gustatory sensation of (L)- and (D)-amino acids in humans. Amino acids, 43, 2349-2358.
- Kim, M. J., Li, Y.-X., Dewapriya, P., Ryu, B. M., and Kim, S.-K. (2013). Floridoside suppresses pro-inflammatory responses by blocking MAPK signaling in activated microglia. BMB Rep., 46, 398-403.
- Kwon, D. -J., Jeong, H. -J., Moon, H., Kim, H. -N., Cho, J. -H., Lee, J. -E., Hong, K. S., and Hong, Y-S. (2015). Assessment of green coffee bean metabolites dependent on coffee quality using a 1H NMR-based metabolomics approach. Food Res. Int., 67, 175-182.
- Lee, J. E., Lee, B. J., Chung, J. O., Kim, H. N., Kim, E. H., Jung, S., Lee, H., Lee, S. J., and Hong, Y. S. (2015). Metabolomic unveiling of a diverse range of green tea (Camellia sinensis) metabolites dependent on geography. Food Chem., 174, 452-459.
- Lin, M. and Shapiro, M. J. (1997). Mixture analysis by NMR Spectroscopy. Anal. Chem., 69, 4731-4733.
- Li, Y. X., Li, Y., Lee, S. H., Qian, Z. J., and Kim, S. K. (2010). Inhibitors of oxidation and matrix metalloproteinases, floridoside, and D-isofloridoside from marine red alga Laurencia undulata. J. Agric. Food Chem., 58, 578-586.
- Marc Rhoads, J. and Wu, G. (2009). Glutamine, arginine, and leucine signaling in the intestine. Amino Acids, 37, 111-122.
- Masetti, O., Ciampa, A., Nisini, L., Valentini, M., Sequi, P., and Dell'Abate, M. T. (2014). Cherry tomatoes metabolic profile determined by 1H-high resolution-NMR spectroscopy as influenced by growing season. Food Chem., 162, 215-222.
- Niwa, K., Furuita, H., and Aruga, Y. (2003). Free amino acid contents of the gametophytic albdes from the green mutant conchocelis and the heterozygous conchocelis in Porphyra yezoensis Ueda (Bangiales, Rhodophyta). J. Appl. Phycol., 15, 407-413.
- Noda, H., Horiguti, Y., and Araki, S. (1975). Studies on the flavor substances of ‘Nori’, the dried laver Porphyra spp. – II. Free amino acids and 5′-nucleotides. Nippon Suisan Gakkaishi, 41, 1299-1303.
- Phat, C., Moon, B., and Lee, C. (2016). Evaluation of umami taste in mushroom extracts by chemical analysis, sensory evaluation, and an electronic tongue system. Food Chem., 192, 1068-1077.
- Picone, G., Engelsen, S. B., Savorani, F., Testi, S., Badiani, A., and Capozzi, F. (2011). Metabolomics as a powerful tool for molecular quality assessment of the fish Sparus aurata. Nutrients, 3, 212-227.
- Schiffman, S. S., Sennewald, K., and Gagnon, J. (1981). Comparison of taste qualities and thresholds of D- and L-amino acids. Physiol. Behav., 27, 51-59.
- Sciubba, F., Capuani, G., Di Cocco, M. E., Avanzato, D., and Delfini, M. (2014). Nuclear magnetic resonance analysis of water soluble metabolitesallows the geographic discrimination of pistachios (Pistacia vera). Food Res. Int., 62, 66-73.
- Stapleton, P. P., Charles, R. P., Redmond, H. P., and Bouchier-Hayes, D. J. (1997). Taurine and human nutrition, Clin. Nutr., 16, 103-108.
- Tomita, S., Nemoto, T., Matsuo, Y., Shoji, T., Tanaka, F., Nakagawa, H., Kikuchi, J., Ohnishi-Kameyama, M., and Sekiyama, Y. (2015). A NMR-based, non-targeted multistep metabolic profiling revealed L-rhamnitol as a metabolite that characterised apples from different geographic origins. Food Chem., 174, 163-172.
- Wang, J., Chen, L., and Li, P. (2008). Gene expression is altered in piglet small intestine by weaning and dietary glutamine supplementation. J. Nutr., 138, 1025-1032.
- Wang, Y. L., Tang, H. R., Nicholson, J. K., Hylands, P. J., Sampson, J., Whitcombe, I., Stewart, C. G., Caiger, S., Oru, I., and Holmes, E. (2004). Metabolomic strategy for the classification and quality control of phytomedicine: A case study of chamomile flower (Matricaria recutita L.). Planta Med. 70, 250-255.
- Wishart, D. S. (2008). Metabolomics: applications to food science and nutrition research. Trends in Food Science & Technology, 19, 482-493.
- Wu, X., Li, N., Li, H., and Tang, H. (2014). An optimized method for NMR-based plant seed metabolic analysis with maximized polar metabolite extraction efficiency, signal-to-noise ratio, and chemical shift consistency. Analyst, 139, 1769-1778.
- Xiao, C., Hao, F., Qin, X., Wang, Y., and Tang, H. (2009). An optimized buffer system for NMR-based urinary metabonomics with effective pH control, chemical shift consistency and dilution minimization. Analyst, 134, 916-925.
- Ye, Y., Zhang, L., Yang, R., Lou, Q., Chen, H., Yan, X., and Tang, H. (2013). Metabolic phenotypes associated with high-temperature tolerance of Porphyra haitanensis strains. J. Agric. Food Chem., 61, 8356-8363.
- Ye, Y. F., An, Y. P., Li, R. H, Mu, C. K., and Wang, C. L. (2014). Strategy of metabolic phenotype modulation in Portunus trituberculatus exposed to low salinity. J. Agric. Food Chem., 62, 3496-3503.
- Ying, M., Shi, W., and Pan, F. (2009). Nutrient compositions of Porphyra haitanensis in different harvest times. ACTA Agriculturae Zhejiangensis, 6, 1227-1228 (in Chinese).
- Zeng, F., Jiang, J., Xu, X., Zhang, W., and Lin, Y. (1991). Amino acid compositions and nutritive value of Porphyra yezoensis and Porphyra haitanensis from China. Oceanologia et Limnologia Sinica, 22, 590-593 (in Chinese).
- Zhang, Q. B., Li, N., Zhou, G. F., Lu, X. L., Xu, Z. H., and Li, Z. E. (2003). In vivo antioxidant activity of polysaccharide fraction from Porphyra haitanensis (Rhodephyta) in aging mice. Pharmacol. Res., 48, 151-155.