Abstract
The effect of milk fat (MF) and milk solids–nonfat (MSNF) on the release of retronasal-aroma (RA) compounds from coffee with milk was investigated by correlating with the lipophilicity (log kw) of the compounds. RA compounds of a coffee flavor-added (FA) sample with MF (0 – 3%) and/or MSNF (0 – 8%) were collected by exposing a solid-phase microextraction fiber to RA simulator effluent gas and analyzed by gas chromatography-mass spectrometry (GC-MS). GC-MS analysis of volatiles released from the FA sample revealed that the relative release ratios of compounds with log kw values >2 decreased significantly as the MF and/or MSNF content increased. Changes in relative release ratios with different MSNF contents were smaller than those with different MF contents, indicating that MF is the predominant factor affecting RA compound release. In FA samples with 0.5 – 3% MF, relationships between the relative release ratios and log kw values could be approximated by sigmoid functions, and exponential regression models for the relative release ratios at different MF contents were obtained for compounds with log kw >2. The resulting model for FA samples is applicable to coffee-added samples for the prediction of relative release ratios.
Introduction
Coffee is consumed in a variety of ways, such as black or with milk and/or sugar, according to the consumer's palate. However, differences in the type, quantity, and composition of milk used for coffee affect its flavor. In the development of ready-to-drink (RTD) coffee beverages, coffee flavors are used in many cases to enhance coffee characteristics and suppress changes in the aroma and taste while maintaining quality during storage. Flavor release may change due to the composition of milk added to flavor the coffee beverages. Therefore, sensory trials and subsequent readjustments of flavor composition are needed whenever a flavor is added to an RTD milk-coffee base. If the influence of milk composition on flavor release of an RTD milk-coffee beverage could be predicted, the preparation of tailor-made flavors and more efficient beverage development would be possible.
The blending amount or composition of milk (i.e., milk components) in a milk-coffee beverage reportedly influences both the quantity and quality of coffee flavor compounds released (Bücking and Steinhart, 2002; Denker et al., 2006; Parat-Wilhelms et al., 2005; Akiyama et al., 2009). In addition, the content of milk fat (MF) and the lipophilicity (i.e., hydrophobicity) of flavor compounds reportedly affect flavor release (Roberts et al., 2003a, 2003b; Miettinen et al., 2004; Relkin et al., 2004; Frank et al., 2012). Roberts and Pollien (2000) investigated the relative headspace concentrations of various compounds released from coffee using milk samples of differing composition and determined the relationship between compound lipophilicity (log kw value) and relative headspace concentration.
The detection of retronasal aromas (RAs), which are caused by flavor compounds traveling from the mouth to the nasal cavity via the nasopharynx and the lungs, is important for flavor perception of RTD beverages such as Tetra-Brik, usually consumed using a straw. An RA simulator (RAS) developed by Roberts and Acree (1995) as one of various mouth models (van Ruth et al., 1994; Roberts and Acree, 1995; Elmore and Langley, 1996) has been used to analyze coffee aromas (Michishita et al., 2010; Watanabe et al., 2012; Akiyama et al., 2014) and how the amount of milk added affects the aroma of coffee beverages (Akiyama et al., 2009).
However, how various milk components (e.g., MF and milk solids–nonfat [MSNF]) affect the release of coffee RA compounds and the relationship between compound lipophilicity (log kw value) and relative RAS-compound concentration remain poorly understood. In addition, these relationships have not been evaluated in dairy coffee beverages prepared using coffee extracts containing a number of coffee volatiles.
The purpose of this study, therefore, was to investigate the effect of milk components (MF and MSNF) on RA-compound release using gas chromatography–mass spectrometry (GC-MS) analyses of RAS-captured compounds released from coffee flavor-added (FA) samples and coffee-added (CA) samples with various concentrations of milk components. The correlation between RAS-compound release and compound lipophilicity (log kw value) was determined. The results of the present study suggest that analysis of RAS compounds in FA samples is useful in creating new flavors of CA beverages.
Materials and Methods
Coffee beans and milk components Guatemala SHB coffee (Coffea arabica) beans were supplied by Unicafe Inc. (Tokyo, Japan) and were dark roasted (L value, 18) using a Probat G-12 roaster (Emmerich, Germany). The degree of roasting was represented as the L value, which was determined using roasted ground coffee (particle size <500 µm) and a ZE-2000 color meter (Nippon Denshoku Industries Co., Ltd., Tokyo, Japan). The roasted coffees were divided into 1-kg portions and stored at −20°C until use. All roasted coffee beans were held at room temperature for 2 h before grinding to allow for temperature equalization. Commercial, ultra-high-temperature pasteurized (135°C, 2 s) nonfat, reconstituted milk (fat, 0.3%; nonfat solids, 11.0%) and cream (fat, 45.6%; nonfat solids, 5.7%) (Morinaga Milk Industry Co., Ltd., Tokyo, Japan) were used in the milk addition experiments.
Brewing espresso A Saeco Royal Professional coffee machine (Nihon Saeco K. K, Kawasaki, Japan) was used to grind roasted coffee (about 7.5 g) and brew espresso using ion exchange-treated hot water (pressure, 15 atm). A fully automatic espresso machine was used for brewing in order to standardize the preparation and brewing conditions, requiring approximately 30 s from grinding to brewing. The espresso was collected in a 100-mL beaker, which was then covered with aluminum foil. The espresso was characterized as follows: volume, ≈ 65 g; Brix, ≈ 2.5°; espresso temperature, ≈ 70°C; temperature of headspace air, ≈ 55°C. Immediately after brewing, the espresso was cooled to 10°C and then used for preparation of CA samples.
Sample preparation FA samples (20 – 25°C) covering a wide range of milk-coffee component concentrations (MF, 0 – 3%; MSNF, 0 – 8%) were prepared from milk products (cream, nonfat reconstituted milk), pH buffer solution, ion exchange–treated water, and a coffee chemical flavor composed of 10 typical coffee volatiles (Table 1). The 10 typical coffee compounds were chosen for preparing the chemical flavor as they covered a wide range of lipophilicity (log kw) and different odors. The chemical flavor was prepared as shown in Table 2. The concentrations of flavor compounds added to FA samples were adjusted to higher than the real coffee extract included in CA samples in order to obtain stable GC-MS results. CA samples (20 – 25°C) were prepared using espresso extracted from 5% coffee beans (in terms of green coffee) instead of chemical flavor (Table 3).
Table 1.
Preparation of flavor-added (FA) samples using coffee chemical flavor for GC-MS analysis of volatile
| Sample code |
MFa |
MSNFb |
Chemical flavor |
Creamc |
Nonfat reconstituted milkd |
Ion exchange water |
Buffer solutione |
Total |
| Blank (MF 0% + MSNF 0%) |
0.00 |
0.00 |
0.1 |
0.0 |
0 |
79.9 |
20.0 |
100.0 |
| MF 0.5% |
0.50 |
0.06 |
0.1 |
1.1 |
0 |
78.8 |
20.0 |
100.0 |
| MF 1% |
1.00 |
0.13 |
0.1 |
2.2 |
0 |
77.7 |
20.0 |
100.0 |
| MF 1.5% |
1.50 |
0.19 |
0.1 |
3.3 |
0 |
76.6 |
20.0 |
100.0 |
| MF 2% |
2.01 |
0.25 |
0.1 |
4.4 |
0 |
75.5 |
20.0 |
100.0 |
| MF 3% |
3.06 |
0.38 |
0.1 |
6.7 |
0 |
73.2 |
20.0 |
100.0 |
| MSNF 2% |
0.05 |
2.02 |
0.1 |
0.0 |
18.2 |
61.7 |
20.0 |
100.0 |
| MSNF 4% |
0.11 |
4.04 |
0.1 |
0.0 |
36.4 |
43.5 |
20.0 |
100.0 |
| MSNF 8% |
0.22 |
8.07 |
0.1 |
0.0 |
72.7 |
7.2 |
20.0 |
100.0 |
| MSNF 4% + MF 0.5% |
0.61 |
4.10 |
0.1 |
1.1 |
36.4 |
42.4 |
20.0 |
100.0 |
| MSNF 8% + MF 0.5% |
0.72 |
8.13 |
0.1 |
1.1 |
72.7 |
6.1 |
20.0 |
100.0 |
b MSNF: milk solids–nonfat
c Cream: MSNF 5.7%, MF 45.6%
d Nonfat reconstituted milk: MSNF 11.1%, MF 0.3%
Table 2.
Volatile components of the coffee chemical flavor in flavor-added (FA) samples.
| No. |
Compound |
Odor |
Log kw |
Concentration in coffee chemical flavor (mg/mL) or in FA sample (µg/mL) |
| 1 |
2, 3-Butanedion |
Buttery-oily |
0.14 |
1 |
| 2 |
3-Methylsulfanylpropanal |
Soy sauce |
0.88 |
10 |
| 3 |
4-Hydroxy-2,5-dimethyl-3(2H)-furanone |
Sweet-caramel |
0.92 |
100 |
| 4 |
2-Methoxyphenol |
Phenolic |
1.53 |
1 |
| 5 |
2-Ethyl-3,5(6)-dimethylpyrazine |
Nutty-roast |
1.61 |
1 |
|
(2-Ethyl-3,5-dimethylpyrazine) |
|
|
(0.54) |
| 6 |
2-(Methylsulfanylmethyl)furan |
Smoke-roast |
2.17 |
1 |
| 7 |
2-Methoxy-3-(1-methylethyl)pyrazine |
Green-earthy |
2.46 |
1 |
| 8 |
2-Methoxy-3-(2-methylpropyl)pyrazine |
Green-earthy |
2.67 |
1 |
| 9 |
3,7-Dimethylocta-1,6-dien-3-ol |
Sweet-fruity |
3.47 |
1 |
| 10 |
(E)-1-(2,2,6-trimethyl-1-cyclohexa-1,3-dienyl)but-2-en-1-one |
Sweet-fruity |
3.81 |
1 |
Table 3.
Preparation of coffee-added (CA) samples using coffee extract for GC-MS analysis of volatile compounds.
| Sample code |
MFa |
MSNFb |
Coffee extractc |
Creamd |
Nonfat reconstituted milke |
Ion exchange water |
Buffer solutionf |
Total |
| Blank (MF 0% + MSNF 0%) |
0.00 |
0.00 |
33.3 |
0.0 |
0 |
61.7 |
5.0 |
100.0 |
| MF 1.5% |
1.50 |
0.19 |
33.3 |
3.3 |
0 |
58.4 |
5.0 |
100.0 |
| MF 3% |
3.06 |
0.38 |
33.3 |
6.7 |
0 |
55.0 |
5.0 |
100.0 |
| MSNF 2% |
0.05 |
2.02 |
33.3 |
0.0 |
18.2 |
43.5 |
5.0 |
100.0 |
| MSNF 4% |
0.11 |
4.04 |
33.3 |
0.0 |
36.4 |
25.3 |
5.0 |
100.0 |
| MSNF 6% |
0.16 |
6.06 |
33.3 |
0.0 |
54.6 |
7.1 |
5.0 |
100.0 |
| MSNF 4% + MF 0.5% |
0.61 |
4.10 |
33.3 |
1.1 |
36.4 |
24.2 |
5.0 |
100.0 |
| MSNF 4% + MF 1% |
1.11 |
4.17 |
33.3 |
2.2 |
36.4 |
23.1 |
5.0 |
100.0 |
| MSNF 4% + MF 2% |
2.12 |
4.29 |
33.3 |
4.4 |
36.4 |
20.9 |
5.0 |
100.0 |
| Unit: % |
b MSNF: milk solids–nonfat
c 5% coffee beans (in terms of green coffee)
d Cream: MSNF 5.7%, MF 45.6%
e Nonfat reconstituted milk: MSNF 11.1%, MF 0.3%
Blank samples The blank samples were samples without the addition of MF and MSNF (Table 1). These samples were selected from each set of experiments to control for variations of peak areas arising from differences in GC columns or solid-phase microextraction (SPME) fibers. The experiments of FA samples consisted of 3 sets, and the experiments of CA samples consisted of 1 set. The peak areas of the blank samples between the experimental sets showed some variations, but the peak areas of the same set showed good repeatability, with the RSD less than 10%.
Definition of relative release ratio (RRR) The relative release ratio (RRR) in this study is the ratio (%) of the peak areas of the volatiles in the RAS exhaust released from samples to those released from blank samples in the same set.
SPME device For sampling RAS volatile compounds of coffee beverages, a Supelco divinylbenzene/Carboxen™/polydimethylsiloxane SPME fiber (50/30 µm thickness) was selected from 6 types of SPME fibers for use with the SPME device (Sigma-Aldrich Co., St. Louis, MO, USA), as described in a previous study of freshly brewed drip-coffee aroma (Akiyama et al., 2007). Before RAS sampling, the SPME fiber was reconditioned in fiber conditioner (GL Sciences Inc., Tokyo, Japan) according to the manufacturer's instructions (data sheet T7941231; Sigma-Aldrich Co.).
RAS parameters and SPME sampling of RAS-captured volatile compounds An RAS method (Roberts and Acree, 1995) was used to sample RA. The RAS consisted of a 1-L stainless-steel blending container with a water jacket for controlling the temperature (37°C), a voltage controller and high torque-speed motor to precisely control the rotational speed of the shear blade (300 rpm), serving as a model mouth, a controlled nitrogen gas supply (1,000 mL/min) as a carrier gas to sweep over the stored FA samples (120 g) or CA samples (195 g), and artificial saliva (40 mL) consisting of 20.0 mmol/L NaHCO3, 2.75 mmol/L K2HPO4, 12.2 mmol/L KH2PO4, and 15.0 mmol/L NaCl. RA compounds from an FA sample (120 g) or a CA sample (195 g) were collected using the RAS coupled to an SPME fiber (length, 2 cm). After sampling by exposing the SPME fiber to the effluent gas for 6 min for FA samples or 4 min for CA samples, the SPME fiber was injected into the GC-MS inlet port, and analytes were thermally desorbed for 10 min at 250°C (Akiyama et al., 2009). Each SPME sampling was conducted in triplicate.
GC-MS analysis GC-MS analysis was performed using a 7890A gas chromatograph equipped with a 5975C inert XL mass spectrometer (Agilent Technologies, Santa Clara, CA, USA). A DB-WAX (60 m × 0.25 mm i.d., 0.25-µm film thickness, Agilent Technologies) capillary column was used, and the flow rate of the helium carrier gas was 1.6 mL/min at 50°C. The initial oven temperature was programmed to 50°C for 2 min, increased to 220°C at 3°C/min, and then held at 220°C for 75 min. The injection port was maintained at 250°C. The inlet was operated in the split mode (split rate, 10:1). GC-MS analyses were carried out in triplicate with selected ion monitoring. Analytes were detected within time windows and identified on the basis of retention indices and fragment ions by comparison with standard compounds. Where quantitative comparisons of data were necessary, GC-MS analyses were conducted under identical conditions.
Identification of volatile compounds The standard compounds of 4-hydroxy-2,5-dimethyl-3(2H)-furanone, 2-methylpropanal, 2-methylbutanal, 3-methylbutanal, 4-ethyl-2-methoxyphenol, 2-(methylsulfanylmethyl)furan, 2,3-diethyl-5-methylpyrazine, 2-methoxy-3-(2-methylpropyl)pyrazine, and 3,7-dimethylocta-1,6-dien-3-ol (linalool) were obtained from Tokyo Chemical Industry Co., Ltd. (Tokyo, Japan). The standard compounds of 2,3-butanedione, 2-methylpyrazine, furan-2-ylmethanol, 2,5-dimethylpyrazine, 2,3-pentanedione, pyridine, 3-methylsulfanylpropanal, 2,3,5-trimethylpyrazine, 2-methoxyphenol, furan-2-ylmethyl acetate, 2-ethyl-3,5-dimethylpyrazine, 2-methylfuran, 2-methoxy-3-(1-methylethyl)pyrazine, and (E)-1-(2,6,6-trimethyl-1-cyclohexa-1,3-dienyl)but-2-en-1-one ((E)-beta-damascenone) were obtained from Sigma-Aldrich Co. 6-Methyl-2,3-dihydrothieno[2,3-c]furan (Kahweofuran) was synthesized following the procedure described by Buechi et al. (1971). Volatile compounds were identified by comparing their mass spectra and Kovats indices to those of standard compounds.
Measurement of aroma compound lipophilicity The lipophilicity (log kw) of aroma compounds was determined based on the retention time on a reversed-phase high-performance liquid chromatography (HPLC) column (El Tayar et al., 1985). To enable direct comparison of data, the chromatographic conditions were the same as those used previously to analyze 96 different compounds (Piraprez et al., 1998). A JASCO LC-2000 PLUS series HPLC instrument equipped with an MD-2010 PLUS diode array multi-wavelength detector (Tokyo, Japan) was used for the analyses. The column (250 mm × 4.6 mm) was packed with Nucleosil 50-5 C18 (particle size, 5 µm; Macherey-Nagel, Oensinger, Switzerland). The mobile phase was prepared volumetrically using various combinations (30 – 70%) of methanol and a solution containing 3-morpholinopropane sulphonic acid buffer (0.01 M) plus n-decylamine (0.2% v/v). The pH of the aqueous solution was adjusted beforehand to 7.4 (pH 4.5 for aldehydes and ketones) by the addition of HCl. Retention time (tr) was measured at room temperature at a flow rate of 1.0 mL/min. The column dead time (t0) was determined with uracil. The capacity factor was defined as k = (tr – t0)/t0. Log k for 100% water (low kw) was linearly extrapolated from results obtained for different mobile phase compositions.
Statistical analysis One-way analysis of variance, Tukey-Kramer HSD multiple comparison tests, nonlinear regression analyses, and root mean squared error (RMSE) determinations were conducted using the JMP10 software package (SAS Institute Inc., Cary, NC, USA).
Results and Discussion
GC-MS analysis of FA samples
Repeatability of volatile release from blank samples
Table 4 shows the peak areas of the volatiles in the RAS exhaust released from blank samples. Some variations were seen among the blank samples in the collected peak areas arising from the differences in GC columns or SPME fibers, but the results showed sufficient repeatability within the same set of experiments except for 4-hydroxy-2,5-dimethyl-3(2H)-furanone. The compound showed poor repeatability in RSD, because the ratio of the concentration of odorant released to the concentration added to samples was lower than that of other odorants, despite the higher concentration contained in the samples.
Table 4.
The volatiles in the RAS exhaust released from flavor-added (FA) blank samples.
|
|
|
|
|
Blank 1 |
Blank 2 |
Blank 3 |
| No. |
KI |
Compound |
Odor |
Log kw |
(MF 0% + MSNF 0%) |
(MF 0% + MSNF 0%) |
(MF 0% + MSNF 0%) |
| Peak areaa |
RSD (%)b |
Peak area |
RSD (%) |
Peak area |
RSD (%) |
| 1 |
966 |
2,3-Butanedione |
Buttery-oily |
0.14 |
1.07 × 10⁶ |
8.9 |
1.77 × 10⁶ |
7.0 |
1.62 × 10⁶ |
6.3 |
| 2 |
1449 |
3-Methylsulfanylpropanal |
Soy sauce |
0.88 |
3.54 × 10⁶ |
3.4 |
4.70 × 10⁶ |
3.2 |
3.22 × 10⁶ |
3.0 |
| 3 |
2031 |
4-Hydroxy-2,5-dimethyl-3(2H)-furanone |
Sweet-caramel |
0.92 |
1.01 × 10⁶ |
9.1 |
4.11 × 10⁵ |
32.7 |
1.63 × 10⁵ |
36.9 |
| 4 |
1855 |
2-Methoxyphenol |
Phenolic |
1.53 |
2.90 × 10⁶ |
4.2 |
2.93 × 10⁶ |
4.3 |
2.78 × 10⁶ |
2.5 |
| 5 |
1462 |
2-Ethyl-3,5-dimethylpyrazine |
Nutty-roast |
1.61 |
3.23 × 10⁶ |
3.9 |
4.07 × 10⁶ |
2.6 |
4.74 × 10⁶ |
0.7 |
| 6 |
1483 |
2-(Methylsulfanylmethyl)furan |
Smoke-roast |
2.17 |
1.38 × 10⁸ |
6.2 |
1.42 × 10⁸ |
2.3 |
1.68 × 10⁸ |
2.1 |
| 7 |
1432 |
2-Methoxy-3-(1-methylethyl)pyrazine |
Green-earthy |
2.46 |
1.18 × 10⁸ |
4.3 |
1.22 × 10⁸ |
2.8 |
1.49 × 10⁸ |
3.0 |
| 8 |
1525 |
2-Methoxy-3-(2-methylpropyl)pyrazine |
Green-earthy |
2.67 |
1.15 × 10⁸ |
4.4 |
1.19 × 10⁸ |
2.1 |
1.56 × 10⁸ |
3.6 |
| 9 |
1543 |
3,7-Dimethylocta-1,6-dien-3-ol |
Sweet-fruity |
3.47 |
7.07 × 10⁷ |
3.6 |
7.54 × 10⁷ |
3.3 |
9.41 × 10⁷ |
3.4 |
| 10 |
1823 |
(E)-1-(2,2,6-trimethyl-1-cyclohexa-1,3-dienyl)but-2-en-1-one |
Sweet-fruity |
3.81 |
7.42 × 10⁷ |
4.5 |
9.47 × 10⁷ |
2.4 |
1.33 × 10⁸ |
4.1 |
b Relative standard deviation (RSD)
Table 5 shows the RRRs of the FA samples with the addition of MF only. Among the 10 flavor compounds in the FA samples, the compounds showed smaller RRRs with the increase of log kw values. The RRRs of certain compounds showed smaller values with the increase of the MF concentration. The RRRs of the 8 flavor compounds were significantly influenced by the addition of 0.5% MF except for 2,3-butanedion and 4-hydroxy-2,5-dimethyl-3(2H)-furanone. The differences in RRRs were more obvious for the flavor compounds with larger log kw values at higher concentrations of MF, such as 2% or 3%.
Table 5.
Effect of milk components (milk fat, MF; milk solids–nonfat, MSNF) on the release of volatiles in the RAS exhaust from flavor-added (FA) samples.
| No. |
KI |
Compound |
Odor |
Log kw |
ANOVAa (p value) |
MF 0% + MSNF 0% |
MF 0.5% |
MF 1% |
MF 1.5% |
MF 2% |
MF 3% |
| RRR (%) |
Teste |
RRR (%)c |
RSD (%)d |
Test |
RRR (%)c |
RSD (%) |
Test |
RRR (%)b |
RSD (%) |
Test |
RRR (%)c |
RSD (%) |
Test |
RRR (%)b |
RSD (%) |
Test |
| 1 |
966 |
2,3-Butanedione |
Buttery-oily |
0.14 |
p < 0.05 |
100 |
AB |
74 |
6.3 |
B |
80 |
0.8 |
B |
112 |
5.5 |
A |
93 |
0.8 |
AB |
110 |
2.7 |
A |
| 2 |
1449 |
3-(Methylthio)propanal |
Soy sauce |
0.88 |
p < 0.05 |
100 |
AB |
77 |
1.4 |
C |
82 |
1.9 |
C |
87 |
9.9 |
BC |
106 |
1.9 |
A |
84 |
7.8 |
BC |
| 3 |
2031 |
4-Hydroxy-2,5-dimethyl-3(2H)-furanone |
Sweet-caramel |
0.92 |
p < 0.05 |
100 |
A |
195 |
38.6 |
AB |
169 |
29.8 |
AB |
121 |
18.7 |
A |
278 |
29.8 |
B |
105 |
16.1 |
A |
| 4 |
1855 |
2-Methoxyphenol |
Phenolic |
1.53 |
p < 0.05 |
100 |
A |
76 |
3.9 |
B |
80 |
2.8 |
B |
86 |
9.7 |
AB |
88 |
2.8 |
AB |
75 |
8.9 |
B |
| 5 |
1462 |
2-Ethyl-3,5-dimethylpyrazine |
Nutty-roast |
1.61 |
p < 0.05 |
100 |
A |
71 |
2.7 |
B |
75 |
5.3 |
BC |
89 |
8.5 |
D |
85 |
5.3 |
D |
83 |
7.3 |
CD |
| 6 |
1483 |
2-(Methylsulfanylmethyl) furan |
Smoke-roast |
2.17 |
p < 0.05 |
100 |
A |
43 |
5.5 |
B |
36 |
4.9 |
C |
33 |
6.4 |
CD |
28 |
4.9 |
DE |
24 |
2.1 |
E |
| 7 |
1432 |
2-Methoxy-3-(1-methylethyl)pyrazine |
Green-earthy |
2.46 |
p < 0.05 |
100 |
A |
39 |
5.7 |
B |
30 |
6.6 |
C |
29 |
5.8 |
C |
23 |
6.6 |
D |
20 |
1.4 |
D |
| 8 |
1525 |
2-Methoxy-3-(2-methylpropyl)pyrazine |
Green-earthy |
2.67 |
p < 0.05 |
100 |
A |
26 |
5.2 |
B |
18 |
6.0 |
C |
16 |
5.1 |
C |
13 |
6.0 |
D |
11 |
0.9 |
D |
| 9 |
1543 |
3,7-Dimethylocta-1,6-dien-3-ol |
Sweet-fruity |
3.47 |
p < 0.05 |
100 |
A |
33 |
4.3 |
B |
24 |
6.4 |
C |
23 |
3.8 |
CD |
19 |
6.4 |
DE |
15 |
1.8 |
E |
| 10 |
1823 |
(E)-1-(2,2,6-trimethyl-1-cyclohexa-1,3-dienyl)but-2-en-1-one |
Sweet-fruity |
3.81 |
p < 0.05 |
100 |
A |
8 |
3.3 |
B |
5 |
5.3 |
C |
4 |
4.5 |
D |
3 |
5.3 |
E |
2 |
3.2 |
F |
a One-way analysis of variance
b Mean relative release ratio (RRR) to the peak area of blank 1 (100%) (
n = 3)
d Relative standard deviation (RSD)
e Tukey-Kramer HSD multiple comparison test
There are significant differences between samples with different letters (A–F) (p < 0.05).
Table 6 shows the influence of the addition of MSNF on RRRs. The RRRs of the 5 compounds from No.6 to 10 in the Table were significantly influenced by the addition of MSNF at 2, 4, and 8%. These influenced compounds have larger log kw values than 2.0.
Table 6.
Effect of milk components (milk fat, MF; milk solids–nonfat, MSNF) on the release of volatiles in the RAS exhaust from flavor-added (FA) samples.
| No. |
KI |
Compound |
Odor |
Log kw |
ANOVAa (p value) |
MF 0% + MSNF 0% |
MSNF 2% |
MSNF 4% |
MSNF 8% |
| RRR (%) |
Testd |
RRR (%)b |
RSD (%)c |
Test |
RRR (%)b |
RSD(%) |
Test |
RRR (%)b |
RSD(%) |
Test |
| 1 |
966 |
2,3-Butanedione |
Buttery-oily |
0.14 |
p < 0.05 |
100 |
A |
91 |
5.8 |
A |
88 |
3.4 |
A |
94 |
2.8 |
A |
| 2 |
1449 |
3-(Methylthio)propanal |
Soy sauce |
0.88 |
p < 0.05 |
100 |
A |
81 |
7.4 |
B |
95 |
3.9 |
AB |
99 |
3.1 |
A |
| 3 |
2031 |
4-Hydroxy-2,5-dimethyl-3(2H)-furanone |
Sweet-caramel |
0.92 |
p < 0.05 |
100 |
A |
100 |
7.4 |
A |
102 |
25.4 |
A |
101 |
26.2 |
A |
| 4 |
1855 |
2-Methoxyphenol |
Phenolic |
1.53 |
p < 0.05 |
100 |
A |
89 |
5.3 |
A |
99 |
4.3 |
A |
89 |
9.9 |
A |
| 5 |
1462 |
2-Ethyl-3,5-dimethylpyrazine |
Nutty-roast |
1.61 |
p < 0.05 |
100 |
A |
95 |
7.4 |
A |
105 |
2.0 |
A |
103 |
7.5 |
A |
| 6 |
1483 |
2-(Methylsulfanylmethyl) furan |
Smoke-roast |
2.17 |
p < 0.05 |
100 |
A |
81 |
6.0 |
B |
82 |
3.2 |
B |
62 |
4.6 |
C |
| 7 |
1432 |
2-Methoxy-3-(1-methylethyl)pyrazine |
Green-earthy |
2.46 |
p < 0.05 |
100 |
A |
86 |
6.7 |
B |
81 |
3.0 |
B |
61 |
4.9 |
C |
| 8 |
1525 |
2-Methoxy-3-(2-methylpropyl)pyrazine |
Green-earthy |
2.67 |
p < 0.05 |
100 |
A |
76 |
6.8 |
B |
68 |
2.9 |
B |
47 |
6.1 |
C |
| 9 |
1543 |
3,7-Dimethylocta-1,6-dien-3-ol |
Sweet-fruity |
3.47 |
p < 0.05 |
100 |
A |
75 |
7.2 |
B |
71 |
2.7 |
B |
53 |
6.8 |
C |
| 10 |
1823 |
(E)-1-(2,2,6-trimethyl-1-cyclohexa-1,3-dienyl)but-2-en-1-one |
Sweet-fruity |
3.81 |
p < 0.05 |
100 |
A |
40 |
6.6 |
B |
29 |
5.7 |
C |
17 |
8.8 |
D |
a One-way analysis of variance
b Mean relative release ratio (RRR) to the peak area of blank 1 (100%) (
n = 3)
c Relative standard deviation (RSD)
d Tukey-Kramer HSD multiple comparison test
There are significant differences between samples with different letters (A–D) (p < 0.05).
Table 7 shows the influence of the concomitant addition of MF and MSNF. The changes in RRRs of the samples with MF and MSNF compared to the samples with the same concentration of MF were not significant, even for the flavor compounds with large log kw values. Of the 5 compounds with log kw values larger than 2.0, which decreased significantly with the addition of only MSNF (Table 6), only (E)-1-(2,6,6-trimethyl-1-cyclohexa-1,3-dienyl)but-2-en-1-one exhibited a significant difference compared with the 0.5% MF sample. Because the RRR of (E)-1-(2,6,6-trimethyl-1-cyclohexa-1,3-dienyl)but-2-en-1-one decreased by 8% with the addition of MF at 0.5% (Table 7), the influence of MSNF could not be determined. These results indicated that MF addition had a greater influence on flavor release than MSNF addition.
Table 7.
Effect of milk components (milk fat, MF; milk solids-nonfat, MSNF) on the release of volatiles in the RAS exhaust from flavor-added (FA) samples.
| No. |
KI |
Compound |
Odor |
Log kw |
ANOVAa (p value) |
MF 0.5% |
MF 0.5% + MSNF 4% |
MF 0.5% + MSNF 8% |
| RRR (%)b |
RSD (%)d |
Teste |
RRR (%)c |
RSD (%) |
Test |
RRR (%)c |
RSD (%) |
Test |
| 1 |
966 |
2,3-Butanedione |
Buttery-oily |
0.14 |
p < 0.05 |
74 |
6.3 |
A |
90 |
7.6 |
A |
79 |
5.2 |
A |
| 2 |
1449 |
3-Methylsulfanylpropanal |
Soy sauce |
0.88 |
p < 0.05 |
77 |
1.4 |
B |
92 |
5.0 |
AB |
100 |
4.3 |
A |
| 3 |
2031 |
4-Hydroxy-2,5-dimethyl-3(2H)-furanone |
Sweet-caramel |
0.92 |
p < 0.05 |
195 |
38.6 |
A |
170 |
28.0 |
A |
112 |
45.5 |
A |
| 4 |
1855 |
2-Methoxyphenol |
Phenolic |
1.53 |
p < 0.05 |
76 |
3.9 |
A |
67 |
1.4 |
A |
78 |
8.1 |
A |
| 5 |
1462 |
2-Ethyl-3,5-dimethylpyrazine |
Nutty-roast |
1.61 |
p < 0.05 |
71 |
2.7 |
B |
80 |
1.9 |
A |
81 |
5.9 |
A |
| 6 |
1483 |
2-(Methylsulfanylmethyl)furan |
Smoke-roast |
2.17 |
p < 0.05 |
43 |
5.5 |
A |
47 |
8.9 |
A |
45 |
4.5 |
A |
| 7 |
1432 |
2-Methoxy-3-(1-methylethyl)pyrazine |
Green-earthy |
2.46 |
p < 0.05 |
39 |
5.7 |
A |
41 |
8.4 |
A |
39 |
2.3 |
A |
| 8 |
1525 |
2-Methoxy-3-(2-methylpropyl)pyrazine |
Green-earthy |
2.67 |
p < 0.05 |
26 |
5.2 |
A |
26 |
8.5 |
A |
24 |
3.4 |
A |
| 9 |
1543 |
3,7-Dimethylocta-1,6-dien-3-ol |
Sweet-fruity |
3.47 |
p < 0.05 |
33 |
4.3 |
A |
32 |
6.7 |
A |
31 |
5.1 |
A |
| 10 |
1823 |
(E)-1-(2,2,6-trimethyl-1-cyclohexa-1,3-dienyl)but-2-en-1-one |
Sweet-fruity |
3.81 |
p < 0.05 |
8 |
3.3 |
A |
6 |
9.5 |
B |
5 |
9.4 |
B |
a One-way analysis of variance
b Mean relative release ratio (RRR) to the peak area of blank 2 (100%) (
n = 3)
d Relative standard deviation (RSD)
e Tukey-Kramer HSD multiple comparison test
There are significant differences between samples with different letters (A, B) (p < 0.05).
The relationship between the RRRs and log kw values was examined from the results of the FA samples with various milk compositions (MF, 0 – 3%; MSNF, 0 – 8%). The relationship between the RRRs and log kw values of the compounds in the FA samples was approximated by nonlinear sigmoid curves. The fitted curves for the compounds in the FA samples with 1.5 or 3% MF showed high coefficients of determination (R2 = 0.95, 0.96) (Figure 1). These curves indicated that the influence of MF on flavor release changed depending on the lipophilicities (log kw values) of the compounds. The release of the compounds with log kw values smaller than 2.0 were not greatly influenced by MF addition, and the compounds with log kw values from 2.0 to 3.0 showed sharp decreases in RRRs. The regression model formulas had high coefficients of determination (R2 > 0.94) for all of the FA samples with 0.5 – 3% MF (+ 0% MSNF), whereas high R2 values were not obtained in the regression sigmoid models for the compounds in FA samples with 2 – 8% MSNF only (data not shown).

Figure 2 shows the relationship between RRR and MF content for the compounds with log kw values larger than 2.0 in the FA samples. The plots for each compound were fitted with exponential curves and exhibited high coefficients of determination (R2 > 0.93). The slope of the fitted curve was steep for the samples with lower MF content, indicating that flavor release was largely suppressed even with the small content of MF. The slopes of the curves showed the decreasing tendency with the increase of the log kw values, except for the case of 2-methoxy-3-(2-methylpropyl) pyrazine (No.8) with a log kw value of 2.67, which showed a sharper slope than 3,7-dimethylocta-1,6-dien-3-ol (No.9) with a log kw value of 3.47. Among the compounds in this study, 3,7-dimethylocta-1,6-dien-3-ol is the only compound that belongs to the aliphatic alcohols, and compounds with an alcohol moiety might show slight differences in character with respect to the relationship between RRR and MF content. The comparison of the influence of MF addition on flavor release among various types of compounds is ongoing.
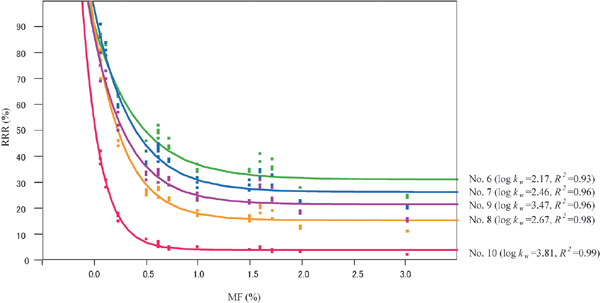
Table 8 lists the compounds released from CA samples as determined by GC-MS analysis. A total of 20 compounds were detected by GC-MS; however, 4 compounds of 3-methylsulfanylpropanal, 4-hydroxy-2,5-dimethyl-3(2H)-furanone, 2-methoxy-3-(1-methylethyl) pyrazine, and (E)-1-(2,6,6-trimethyl-1-cyclohexa-1,3-dienyl)but-2-en-1-one contained in the FA samples were not detected in the RAS exhaust of the CA samples.
Table 8.
Effect of milk components (milk fat, MF; milk solids–nonfat, MSNF) on the release of volatiles in the RAS exhaust from coffee-added (CA) samples.
| No. |
KI |
Compound |
Odor |
Log kw |
SIM monitor ions |
Blank(MF 0% + MSNF 0%) |
MF 1.5% |
MF 3% |
MSNF 2% |
MSNF 4% |
MSNF 6% |
| Peak area |
RRR (%)a |
RSD (%)b |
RRR (%)a |
RSD (%)b |
RRR (%)a |
RSD (%)b |
RRR (%)a |
RSD (%)b |
RRR (%)a |
RSD (%)b |
RRR (%)a |
RSD (%)b |
| 1 |
966 |
2,3-Butanedione |
Buttery-oily |
0.14 |
43, 86 |
1.55 × 10⁶ |
100 |
0.5 |
93 |
8.2 |
92 |
5.1 |
99 |
4.0 |
88 |
1.2 |
104 |
6.1 |
| 2 |
1263 |
2-Methylpyrazine |
Nutty-roast |
0.21 |
53, 67, 94 |
3.18 × 10⁶ |
100 |
1.2 |
94 |
3.1 |
89 |
7.1 |
90 |
5.1 |
91 |
3.4 |
87 |
2.5 |
| 3 |
1653 |
Furan-2-ylmethanol |
Sweet-caramel |
0.45 |
81, 98 |
4.25 × 10⁶ |
100 |
1.7 |
96 |
10.0 |
90 |
7.2 |
84 |
4.6 |
91 |
2.5 |
75 |
10.0 |
| 4 |
1321 |
2,5-Dimethylpyazine |
Nutty-roast |
0.61 |
42, 81, 108 |
1.11 × 10⁶ |
100 |
4.9 |
94 |
4.9 |
84 |
8.4 |
83 |
6.9 |
90 |
6.6 |
77 |
2.8 |
| 5 |
1049 |
2,3-Pentanedione |
Buttery-oily |
0.64 |
43, 57, 100 |
3.20 × 10⁶ |
100 |
2.1 |
74 |
13.1 |
79 |
6.4 |
86 |
8.3 |
85 |
1.5 |
95 |
8.3 |
| 6 |
1181 |
Pyridine |
Green-earthy |
0.72 |
51, 52, 79 |
1.86 × 10⁷ |
100 |
4.9 |
95 |
2.7 |
88 |
6.8 |
102 |
3.6 |
100 |
5.9 |
95 |
2.9 |
| 7 |
1449 |
3-Methylsulfanylpropanal |
Soy sauce |
0.88 |
104 |
- |
- |
- |
- |
- |
- |
- |
- |
- |
- |
- |
- |
- |
| 8 |
2030 |
4-Hydroxy-2,5-dimethyl-3(2H)-furanone |
Sweet-caramel |
0.92 |
85, 128 |
- |
- |
- |
- |
- |
- |
- |
- |
- |
- |
- |
- |
- |
| 9 |
1404 |
2,3,5-Trimethylpyrazine |
Nutty-roast |
1.05 |
42, 81, 122 |
3.60 × 10⁵ |
100 |
4.3 |
89 |
7.0 |
76 |
6.9 |
78 |
8.2 |
85 |
4.9 |
70 |
1.0 |
| 10 |
806 |
2-Methylpropanal (m/z 41)* |
Buttery-oily |
1.44 |
41, 43, 72 |
8.97 × 10⁵ |
100 |
6.1 |
92 |
4.4 |
81 |
7.1 |
98 |
2.5 |
90 |
5.9 |
91 |
1.6 |
| 11 |
1854 |
2-Methoxyphenol |
Phenolic |
1.53 |
81, 109, 124 |
5.52 × 10⁵ |
100 |
3.6 |
78 |
9.1 |
64 |
8.3 |
74 |
8.5 |
80 |
6.1 |
59 |
5.8 |
| 12 |
1529 |
Furan-2-ylmethyl acetate |
Sweet-fruity |
1.61 |
140 |
2.68 × 10⁶ |
100 |
4.2 |
66 |
4.9 |
48 |
7.6 |
91 |
9.5 |
95 |
7.9 |
75 |
4.5 |
| 13 |
1462 |
2-Ethyl-3,5-dimethylpyrazine |
Nutty-roast |
1.61 |
135, 136 |
7.09 × 10⁴ |
100 |
6.2 |
80 |
7.3 |
66 |
8.3 |
77 |
9.8 |
87 |
5.4 |
68 |
3.6 |
| 14 |
910 |
2-Methylbutanal |
Buttery-oily |
1.84 |
41, 57, 58 |
7.98 × 10⁶ |
100 |
4.5 |
83 |
1.5 |
66 |
5.9 |
97 |
5.2 |
82 |
7.0 |
82 |
1.1 |
| 15 |
860 |
2-Methylfuran |
Others |
1.91 |
53, 81, 82 |
3.31 × 10⁶ |
100 |
6.5 |
63 |
8.0 |
46 |
7.7 |
92 |
8.0 |
82 |
3.5 |
84 |
6.4 |
| 16 |
913 |
3-Methylbutanal |
Buttery-oily |
1.96 |
41, 57, 58 |
4.36 × 10⁶ |
100 |
8.2 |
88 |
3.5 |
73 |
6.8 |
93 |
4.6 |
82 |
5.4 |
88 |
3.0 |
| 17 |
2026 |
4-Ethyl-2-methoxyphenol |
Phenolic |
2.06 |
137, 152 |
1.19 × 10⁵ |
100 |
6.9 |
45 |
7.5 |
29 |
9.0 |
67 |
8.8 |
68 |
4.0 |
47 |
9.8 |
| 18 |
1482 |
2-(Methylsulfanylmethyl) furan |
Smoke-roast |
2.17 |
81, 128 |
2.19 × 10⁶ |
100 |
6.4 |
28 |
9.9 |
17 |
7.5 |
85 |
10.0 |
84 |
7.4 |
65 |
1.7 |
| 19 |
1431 |
2-Methoxy-3-(1-methylethyl)pyrazine |
Green-earthy |
2.46 |
137, 152 |
- |
- |
- |
- |
- |
- |
- |
- |
- |
- |
- |
- |
- |
| 20 |
1493 |
2,3-Diethyl-5-methylpyrazine |
Nutty-roast |
2.48 |
149, 150 |
3.38 × 10⁴ |
100 |
7.3 |
53 |
5.3 |
35 |
8.5 |
72 |
8.9 |
77 |
9.1 |
61 |
4.4 |
| 21 |
1524 |
2-Methoxy-3-(2-methylpropyl)pyrazine (m/z 124)* |
Green-earthy |
2.67 |
94, 124, 151 |
8.51 × 10³ |
100 |
4.5 |
16 |
5.5 |
8 |
6.2 |
70 |
6.2 |
64 |
8.5 |
43 |
8.3 |
| 22 |
1736 |
6-Methyl-2,3-dihydrothieno[2,3-c]furan |
Smoke-roast |
2.82 |
97, 111, 140 |
2.93 × 10⁵ |
100 |
9.5 |
12 |
8.5 |
7 |
6.2 |
66 |
10.2 |
58 |
5.2 |
41 |
1.7 |
| 23 |
1543 |
3,7-Dimethylocta-1,6-dien-3-ol |
Sweet-fruity |
3.47 |
43, 71, 93 |
2.24 × 10⁴ |
100 |
5.8 |
35 |
4.2 |
21 |
8.9 |
78 |
8.6 |
78 |
8.7 |
56 |
2.9 |
| 24 |
1827 |
(E)-1-(2,6,6-Trimethyl-1-cyclohexa-1,3-dienyl)but-2-en-1-one |
Sweet-fruity |
3.81 |
69, 105, 121 |
- |
- |
- |
- |
- |
- |
- |
- |
- |
- |
- |
- |
- |
Ten volatile compounds used for coffee chemical flavor
* The monitoring ion shown in parentheses was used to measure the area of peaks overlapping with another peak.
a Relative release ratio (RRR) to blank (100%)
b Relative standard deviation (RSD)
The RRRs of the compounds in the CA samples showed similar tendencies to the FA samples as for the influence of MF or MSNF addition on flavor release. The RRRs of the compounds with log kw values smaller than 2.0 from No.1 to No.16 in Table 8 were not greatly influenced by MF addition, while the compounds with log kw values larger than 2.0 from No.17 to No.24 showed decreases with the increase of log kw values. The RRRs were not influenced obviously by the addition of MSNF. A similar trend of decreasing RRR was observed for compounds in the CA samples with MSNF, but the change in RRR as MSNF content increased from 2 to 6% was smaller than that for compounds in samples with different MF content (Table 8). These results indicated that the effects of MF or MSNF addition on flavor release from CA milk-coffee drinks are similar to those of MF or MSNF addition to model FA drinks, although the concentrations of coffee compounds in the CA samples were much lower than those in the FA samples.
Our previous study (Akiyama et al., 2009) revealed that milk addition to espresso has a marked effect on smoke-roast odors in the RAS aroma and that smoke-roast odor in the RAS aroma was less apparent in the café latte (milk 60%) than in espresso. As shown in Table 8, both the volatile compounds with smoke-roast odor had large log kw values (2.17 for 2-(methylsulfanylmethyl) furan and 2.82 for 6-methyl-2,3-dihydrothieno[2,3-c]furan) and both showed much smaller RRR values (e.g., 26% and 16% at MF 2% + MSNF 4%, respectively) than the volatiles with log kw values smaller than 2.0. In other words, this suggested that aroma release was generally suppressed in RAS aroma, and smoke-roast odor decreases greatly in sensory evaluation by adding milk components to coffee.
Regression analysis of the relationship between RRR and log kw
The relationships between RRRs and log kw values for the compounds in CA samples with MF (1.5 and 3%) were approximated by nonlinear sigmoid functions as shown in Figure 3. The coefficients of determination for the CA samples (MF 1.5%, R2 = 0.79; MF 3%, R2 = 0.85) were not as high as those of the FA samples (R2 > 0.94), but the curves showed similar tendencies. The compounds with log kw values smaller than 2.0 showed only minimal changes in RRRs, while the RRRs showed large decreases for the compounds with log kw values from 2.0 to 3.0. In contrast, high coefficients of determination were not obtained for compounds in CA samples with MSNF (2, 4, and 6%; R2 = 0.31, 0.55, and 0.57, respectively).
Relationship between the measured data from CA samples and the data predicted by regression models for FA samples
The relationship between RRR and MF content in FA samples for compounds with a log kw larger than 2 was expressed by an exponential curve (Figure 2). Table 9 shows the results of comparisons of the experimentally determined RRRs for the CA samples with the predicted RRRs by the regression models from the results of the FA samples. The compounds in the Table were detected in both CA and FA samples, whose log kw values were larger than 2.0. The RMSEs, which showed how accurately the regression models for the FA sample data predicted the measured data for CA samples, were less than 8.0. The prediction accuracy was considered acceptable for the development of the aroma and taste of a milk coffee beverage following preparation of a coffee flavor, because the RMSE values were about the same as the RSDs of released volatiles by GC-MS analyses. This shows that the RRRs of compounds with a log kw larger than 2 in CA samples can be predicted by regression analysis of results obtained using FA samples.
Table 9.
Relationship between relative release ratios (RRRs) experimentally determined from analysis of coffee-added (CA) samples and RRRs predicted based on the regression model for flavor-added (FA) samples.
| No. |
Compound |
Log kw |
|
MF (%) |
|
| 0.05 |
0.11 |
0.16 |
0.61 |
1.11 |
1.50 |
2.12 |
3.06 |
RMSE |
|
|
|
M |
85.1 |
83.7 |
64.9 |
57.9 |
45.7 |
28.3 |
26.3 |
16.9 |
|
| 6 (18) |
2-(Methylsulfanylmethyl)furan |
2.17 |
P |
83.5 |
77.6 |
67.7 |
49.0 |
36.6 |
32.9 |
31.8 |
31.3 |
|
|
|
M-P |
1.7 |
6.2 |
−2.8 |
8.9 |
9.0 |
−4.6 |
−5.5 |
−14.5 |
7.7 |
|
|
|
M |
77.2 |
67.5 |
52.5 |
28.8 |
17.8 |
15.8 |
15.5 |
15.4 |
|
| 8 (21) |
2-Methoxy-3-(2-methylpropyl)pyrazine |
2.67 |
P |
70.2 |
63.7 |
43.2 |
31.3 |
23.4 |
16.0 |
11.7 |
7.9 |
|
|
|
|
M-P |
6.9 |
3.8 |
9.3 |
−2.5 |
−5.5 |
−0.2 |
3.8 |
7.5 |
5.7 |
|
|
|
M |
78.1 |
78.4 |
56.0 |
45.2 |
33.5 |
34.9 |
18.4 |
21.2 |
|
| 9 (23) |
3,7-Dimethylocta-1,6-dien-3-ol |
3.47 |
P |
76.6 |
69.0 |
56.7 |
35.9 |
24.9 |
22.4 |
21.9 |
21.7 |
|
|
|
|
M-P |
1.5 |
9.4 |
−0.7 |
9.3 |
8.6 |
12.5 |
−3.4 |
−0.5 |
7.2 |
No.: corresponding to No.in Tables 2, and 4–7
No.in parentheses: corresponding to No.in Table 8
M: measured RRR (%)
P: predicted RRR (%)
MF: milk fat
RMSE: root mean squared error
Roberts and Pollien (2000) showed that when fat was present in a flavor-compound added system, the level of MSNF did not further influence the compound release, and proposed that compound absorption by fat is the primary retaining mechanism in complex liquid milk systems. This study confirmed that the level of MSNF did not further influence the RAS-compound release in CA samples containing coffee extract and MF, such as milk coffee beverages, and indicates that the proposed mechanism is highly probable.
Conclusion
GC-MS analyses of the RAS volatiles released from drink samples with different concentrations of MF and/or MSNF revealed that the flavor release was influenced by the MF addition, and that the degree of the influence changed depending on the lipophilicities of the compounds (shown as log kw values). The protocol for predicting the RRRs of the compounds in a certain coffee-milk drink from the log kw values of the compounds and MF content added to a drink was shown. The relationship among the lipophilicity of the compounds, MF content and RRRs did not change greatly between the model samples with higher concentrations and limited components and the real coffee-milk drinks with lower concentrations and numerous components including hydrophobic compounds like caffeine. These results indicate the possible applicability of the proposed protocol in this study to real drink systems.
References
- Akiyama, M., Murakami, K., Ikeda, M., Iwatsuki, K., Wada, A., Tokuno, K., Onishi, M., and Iwabuchi, H. (2007). Analysis of the headspace volatiles of freshly brewed arabica coffee using solid-phase microextraction. J. Food Sci., 72, C388-C396.
- Akiyama, M., Murakami, K., Ikeda, M., Iwatsuki, K., Wada, A., Tokuno, K., Onishi, M., Iwabuchi, H., and Sagara, Y. (2009). Analysis of freshly brewed espresso using a retronasal aroma simulator and influence of milk addition. Food Sci. Technol. Res., 15, 233-244.
- Akiyama, M., Watanabe, R., Ohata, M., Miyai, T., Imayoshi, Y., Onishi, M., Ikeda, M., Ichihashi, N., and Iwabuchi, H. (2014). Changes in volatile compounds of an aseptically packaged cup coffee beverage during early storage at 10°C. Food Sci. Technol. Res., 20, 647-654.
- Buechi, G., Degen, P., Gautschi, F., and Willhalm, B. (1971). Structure and synthesis of kahweofuran, a constituent of coffee aroma. J. Org. Chem., 36, 199-200.
- Bücking, M. and Steinhart, H. (2002). Headspace GC and sensory analysis characterization of the influence of different milk additives on the flavor release of coffee beverages. J. Agric. Food Chem., 50, 1529-1534.
- Denker, M., Parat-Wilhelms, M., Drichelt, G., Paucke, J., Luger, A., Borcherding, K., Hoffmann, W., and Steinhart, H. (2006). Investigation of the retronasal flavour release during the consumption of coffee with additions of milk constituents by ‘Oral Breath Sampling’. Food Chem., 98, 201-208.
- Elmore, J.S. and Langley, K.R. (1996). Novel vessel for the measurement of dynamic flavor release in real time from liquid foods. J. Agric. Food Chem., 44, 3560-3563.
- El Tayar, N., Van de Waterbeemd, H., and Testa, B. (1985). Lipophilicity measurements of protonated basic compounds by reversed-phase high-performance liquid chromatography: II. Procedure for the determination of a lipophilic index measured by reversed-phase high-performance liquid chromatography. J. Chromatogr., 320, 305-312.
- Frank, D., Appelqvist, I., Piyasiri, U., and Delahunty, C. (2012). In vitro measurement of volatile release in model lipid emulsions using proton transfer reaction mass spectrometry. J. Agric. Food Chem., 60, 2264-2273.
- Michishita, T., Akiyama, M., Hirano, Y., Ikeda, M., Sagara, Y., and Araki, T. (2010). Gas chromatography/olfactometry and electronic nose analyses of retronasal aroma of espresso and correlation with sensory evaluation by an artificial neural network. J. Food Sci., 75, S477-S489.
- Miettinen, S.-M., Hyvönen, L., Linforth, R.S.T., Taylor A.J., and Tuorila H. (2004). Temporal aroma delivery from milk systems containing 0–5% added fat, observed by free choice profiling, time intensity, and atmospheric pressure chemical ionization–mass spectrometry techniques. J. Agric. Food Chem., 52, 8111-8118.
- Parat-Wilhelms, M., Denker, M., Borcherding, K., Hoffmann, W., Luger, A., and Steinhart, H. (2005). Influence of defined milk products on the flavour of white coffee beverages using static headspace gas chromatography-mass spectrometry/olfactometry and sensory analysis. Eur. Food Res. Technol., 221, 265-273.
- Piraprez, G., Herent, M.-F., and Collin, S. (1998). Determination of the lipophilicity of aroma compounds by RPHPLC. Flavor Fragr. J., 13, 400-408.
- Relkin, P., Fabre, M., and Guichard, E. (2004). Effect of fat nature and aroma compound hydrophobicity on flavor release from complex food emulsions. J. Agric. Food Chem., 52, 6257-6263.
- Roberts, D.D., and Acree, T.E. (1995). Simulation of retronasal aroma using a modified headspace technique: investigating the effects of saliva, temperature, shearing, and oil on flavor release. J. Agric. Food Chem., 43, 2179-2186.
- Roberts, D.D. and Pollien, P. (2000). Relative influence of milk components on flavor compound volatility. In “Flavor Release,” ed. by Roberts, D.D. and Taylor, A.J. American Chemical Society Symposium Series, Washington DC, vol. 763, pp. 321-332.
- Roberts, D.D., Pollien, P., and Watzke, B. (2003a). Experimental and modeling studies showing the effect of lipid type and level on flavor release from milk-based liquid emulsions. J. Agric. Food Chem., 51, 189-195.
- Roberts, D.D., Pollien, P., Antille, N., Lindinger, C., and Yeretzian, C. (2003b). Comparison of nosespace, headspace, and sensory intensity ratings for the evaluation of flavor absorption by fat. J. Agric. Food Chem., 51, 3636-3642.
- van Ruth, S.M., Roozen, J.P., and Cozijnsen, J.L. (1994). Comparison of dynamic headspace mouth model systems for flavour release from rehydrated bell pepper cuttings. In “Trends in Flavour Research,” ed. by Maarse, H., and van der Heij, D.G. Elsevier Science, Amsterdam, pp. 59-64.
- Watanabe, R., Akiyama, M., Miyai, T., Ohata, M., Imayoshi, Y., Ikeda, M., Ichihashi, N., and Iwabuchi, H. (2012). Changes in flavor characteristics of a chilled-cup coffee beverage during storage. In “Proceedings of the 24th ASIC Colloquium,” San Jose, Costa Rica, pp. 316-321.
