Abstract
The aim of the present study was to investigate the effects of Lepidium meyenii (maca) on hypoxia tolerance and fatigue relief, and to determine its active constituents. The results showed that, in the mouse model, maca powder could significantly prolong hypoxia time (HT) and forced swim time (FST) and optimize blood sugar ratio (BSR), liver glycogen (LG), muscle glycogen (MG), blood lactic acid, and lactic dehydrogenase. Based on these results, aqueous extracts and maca water-soluble polysaccharide (MWP) were isolated. The total sugar content of MWP is 90.41 ± 2.55%, and the main monosaccharide component is glucose (79.88%). In the mouse model, HT (40.76 ± 7.97 min), FST (48.32 ± 10.76 min), BSR (4.49 ± 4.04%), LG (11.27 ± 0.61 mg/g), and MG (1.45 ± 0.17 mg/g) were all significantly enhanced in groups given maca powder compared to the control group (p < 0.05). In summary, maca is effective in improving hypoxia tolerance and relieving fatigue, and MWP is the active substance.
Introduction
Maca (Lepidium meyenii) is a plant that belongs to the Brassica family, Lepidium genus (Gustavo, 2012), which is native to areas in the Andes in South America with elevations over 4000 m. It is mainly cultivated in Peru (Gonzales, Gonzales. and Gonzales, 2009). In dried form, maca has abundant carbohydrates (59.0%), proteins (10.2%) and lipids (2.2%) (Dini, Migliuolo, Rastrelli, Saturnino and Schettino, 1993), and contains amino acids, minerals (Gustavo, 2012), and secondary metabolites (Zheng, He, Kim, Hyung, Rogers, Shao, Huang, Lu, Qien and Zheng, 2000).
Maca has been utilized for almost 2000 years (Ganzera, Zhao and Khan), with people mainly consuming its tubers for extra nutrition and treating diseases (Gonzales-Castañeda, Rivera, Chirinos, Evelson and Gonzales, 2011). Modern technology and methods have been employed to confirm or explore the different kinds of bioactive effects of maca. Rubio et al. established an animal model via ovariectomy, and found that black maca could improve experimental memory impairment induced by ovariectomy (Rubio, Qiong, Liu, Jiang, Dang, Chen and Gonzales, 2011). Zheng et al. found that lipid extracts of maca could enhance the sexual function of mice and rats (Zheng, He, Kim, Hyung, Rogers, Shao, Huang, Lu, Qien and Zheng, 2000). Ai et al. established a mouse model of chronic unpredictable mild stress (CUMS), and demonstrated the antidepressant-like effect of the petroleum ether extract of maca (Ai, Cheng, Yu, Yu and Jin, 2014). Furthermore, anti-oxidant effects (Večeřa, Orolin, Škottová, Kazdová, Oliyarnik, Ulrichová and Simanek, 2007), and decreases in serum IL-6 levels (Gonzales, Gasco and Lozada, 2013) produced by maca have been reported.
Muscles experience a progressive decline in performance when used intensively, but normally recover after a period of rest. This reversible phenomenon is denoted muscle fatigue (Westerblad, et al. 2003). Fatigue may decrease work efficiency and reduce quality of life. Available therapies in modern medicine for relieving or preventing fatigue are limited; hence, more and more people are turning to traditional medicine (Zhang, Ren, Huang, Ding, Zhou and Liu, 2010). Methods of evaluating fatigue relief are various. For example, the forced swim test is directly related to the capacity to relieve fatigue in mice (Wang, Yan and Cai, 2014). A previous study speculated that depletion of energy storage and accumulation of metabolic products in the body may lead to fatigue (Zhang, Liu, Zhou, Wang and Sun, 2014). Blood sugar is the most preferred energy source that is mobilized during exercise. Extensive exercise often leads to a decrease in blood sugar level, and weakens exercise performance of the body (Kumar, Anand, Singsit, Khanum and Anilakumar, 2013). During extensive exercise, the body cannot get enough energy via aerobic respiration only, so glycolysis becomes an important energy source. In the glycolysis pathway, lactate dehydrogenase (LDH) is the key enzyme. An increase in LDH would accelerate the glycolysis process, producing more energy as well as blood lactic acid (BLA). Lactic acid may cause fatigue according to Hill and Kupalov's research (Hill, et al., 1929), so it is also often detected as an indicator in anti-fatigue tests (Hao, Cao, Hao and Zhang, 2013; Xu, Lv, Lo, Cui, Hu and Fan, 2012). Glycogen, including liver glycogen (LG) and muscle glycogen (MG), is an important energy source stored in the body. Glycogen could be used to complement the consumption of blood sugar (Ren, Zhao, Wang, Cui and You, 2011; Shao, Wang and Zheng, 2013). Because of its importance as an energy source, glycogen is often selected as an index for evaluating relief of fatigue (Lin, Liu, Fang, Yu, Xiong and Ke, 2014). Proteins and amino acids are other sources of energy, and blood urea nitrogen (BUN) reflects the production of proteins and amino acid metabolism (Wang, Shieh, Kuo, Lee and Pan, 2006). It has been reported that BUN is significantly positively correlated with exercise and endurance time (You, Zhao, Regenstein and Ren, 2011).
If the hypoxia tolerance and fatigue-relieving activities of maca could be established, then its active substances could be determined. Therefore, the aim of the present study was to establish a BALB/c mouse model in which hypoxia time could be tested to evaluate hypoxia tolerance induced by maca, and forced swim time (FST) could be used as the exercise index with the biochemical parameters blood sugar ratio (BSR), LG, MG, LDH, BLA, and BUN measured to investigate the fatigue-relieving activity of maca. Furthermore, the active components could be isolated by extraction and purification, to provide theoretical support for the use of maca as a functional food.
Materials and Methods
Maca Maca powder used in this study was cultivated in Lijiang city, Yunnan province, China, and was provided by Xiamen Everbright Biotechnology Ltd, Fujian, China
Chemicals and reagents Ethyl alcohol, anthrone, sulfuric acid, soda lime, arabinose, galactose, xylose, and glucose were purchased from Sinopharm Chemical Reagent Co., Ltd. (Shanghai, China). NaOH was purchased from Guanghua Sci-tech Co., Ltd. (Shantou, Guangdong, China). Vaseline was purchased from Shanghai Reagent Factory (Shanghai, China). Trifluoroacetic acid, trichloroacetic acid, BaCl2, and K2SO4 were purchased from Xilong Chemical Co., Ltd. (Shantou, Guangdong, China). Gelatin was purchased from Genebase Gene-tech Co., Ltd. (Shanghai, China); nitrogen gas was purchased from Linder Gas (Xiamen, Fujian, China). Cellulase was purchased from Novozymes (Tianjin, China).
Animals Female BALB/c mice were purchased from Slaccas Lab Animal Ltd. (Shanghai, China) at 6 – 8 weeks old. Mice were housed in a specific pathogen-free (SPF) barrier room (room temperature 23 ± 2°C, relative humidity 50% – 70%, 12/12 h light/dark cycle), and food and water were available ad libitum. All experiments were carried out following the institutional and national guidelines, SCXK 2012–0005, and all animals were used for academic research.
Use of the BALB/c mouse model to determine hypoxia tolerance and fatigue-relieving activities of maca powder
Mouse model design. After 1 week of adaption, 48 selected mice were randomly divided into four groups (12 mice in each group): a high-dose group, a medium-dose group, and a low-dose group, which were treated with maca powder at doses of 1, 0.5, or 0.1 g/kg body weight, respectively; a control group, which was treated with distilled water. Maca samples were dispersed in distilled water and given by oral administration continuously for 30 days. Body weight was measured using an electronic balance (Yingpai, Shanghai, China).
Hypoxia tolerance test. Hypoxia tolerance was measured 30 minutes after the latest treatment, following the method of Luo (Luo, Cai and Hu, 2014), with modifications. In brief, three mice from each group were placed individually into a 250 mL sealable glass bottle containing 15 g of soda lime, and vaseline was smeared around the cap to enhance the seal. Each mouse remained in the bottle until it succumbed to oxygen deficiency and died. The survival time was recorded as the hypoxia time (HT). Because the mice in HT test were expected to die after the experiment, considering the welfare of mice, fewer mice were used in HT test than that in forced swim test.
Forced swim test. This was carried out following the method of Bo (Bo, et al., 2014), with modifications. In brief, 30 minutes after the latest treatment, the blood glucose level was detected in the tail vein using a glucometer (Roche, Mannheim, Germany). After a 5-minute rest, six mice from each group were dropped individually into a water tank (water depth 40 cm, water temperature 30 ± 3°C) with a load (4% of body weight) attached to the tail. Exhaustion was determined by observing when the mice sank below the surface of the water without being able to return to the surface within 10 s. The forced swim time (FST) was defined as the time span from when the mouse was dropped into water until exhaustion.
Detection of plasma biochemical parameters. Mice were removed from the water tank and dried by filter paper. Blood was collected immediately from the eye socket of the mice, by removing the eyeball, and EDTA·K2 was used as a blood anticoagulant. Blood glucose was detected again after the forced swim test. BSR was calculated from the equation:
In the equation, C1 is blood sugar content before the forced swim test and C2 is blood sugar content after the forced swim test. Plasma was separated by centrifugation (Eppendorf, Hamburg, Germany. 4°C, 3500×g, 7 min) to determine BLA, BUN, and LDH by using an automatic biochemistry analyzer (Beckman Coulter, California, USA).
Detection of tissue glycogen. Liver and gastrocnemius muscle were taken from 3 executed mice from each group that had not undergone the forced swim test, 30 min after the latest treatment. Liver glycogen (LG) and muscle glycogen (MG) were determined following the methods of Jung (Jung, Han, Lee and Kim, 2007), with modifications. In brief, liver and gastrocnemius muscles were hydrolyzed with 2 M NaOH at 100°C for 30 min. The hydrolysate was centrifuged (Beckman Coulter, California, USA. 8000×g, 10 min) and extracted four times with anhydrous ethanol, and the supernatants were discarded. The sediment was dissolved in distilled water and diluted to 1 mL, then 4 mL of 0.2% anthrone-sulfuric acid were added. Tubes were placed into a 100. water bath for 20 min. Absorbance was measured at 630 nm using a UV-visible spectrophotometer.
Preparation of maca aqueous extracts Maca powder was immersed in ten-fold distilled water, and cellulase was added to disrupt the cell membranes at 40°C for 1 h, then extracted with 80°C water bath (Memmert, Frankfurt, Germany) for another 1 h. The mixture was centrifuged (Beckman Coulter) 8000×g, 30 min, and the supernatant was collected as maca aqueous extracts (MAE) and freeze-dried (Boyikang, Beijing, China).
Extraction and purification of maca water-soluble polysaccharide A certain amount of MAE was dissolved with distilled water, and ethyl alcohol was added to a final concentration of 80%, with stirring for 6 h. The mixture was centrifuged (Beckman Coulter. 8000×g, 30 min), and the sediment was collected and dissolved with distilled water. This alcohol precipitation step was repeated five times. Finally, the sediment was collected as maca water-soluble polysaccharide (MWP) and freeze-dried (Boyikang).
Analysis of the total sugar content and the monosaccharide composition The total sugar contents of MAE and MWP were determined by the anthrone-sulfuric acid method (Morris, 1948). MAE and MWP powders were dissolved with distilled water, ensuring the sample concentrations were 0.5 mg/mL. Anthrone 0.2 g was diluted with sulfuric acid to 100 mL, and 5 mL of anthrone-sulfuric acid were added to 20 mL of sample (maca extract or glucose standard), and boiled for 10 min. After cooling, the absorbance was measured at 630 nm, using a UV-visible spectrophotometer (PerkinElmer, Massachusetts, USA). Glucose was used as the standard.
The monosaccharide composition of MWP was analyzed by ion chromatography (IC. Dionex, California, USA). In brief, 9 mg of sample were put into an Ann cutting bottle, then 3 mL of 4 mol/L trifluoroacetic acid were added. After filling with nitrogen gas, the Ann cutting bottle was put into a 100°C water bath (Memmert) to digest the sample for 3 h. The sample was then dried by vacuum evaporation (Thermo, Massachusetts, USA) and 300 mL of distilled water were added. Arabinose, galactose, glucose, and xylose were used as standards. IC parameters were as follows: Dionex CarboPac PA-10 chromatographic column (4 × 250 mm); pulse ampere detector; gold electrode; mobile phase, 0.02 M NaOH; flow rate, 0.6 mL/min; column temperature, 30°C; and injection volume, 25 µL.
The SO42– content was analyzed following the method of Kawai (Kawai, Seno and Anno, 1969).
Hypoxia tolerance and fatigue-relieving activities of MAE and MWP
Mouse model design. After one week of adaption, 84 selected mice were randomly divided into seven groups (12 mice each group): MAE high-dose group, MAE medium-dose group, and MAE low-dose group, which were treated with MAE at doses of 1, 0.5, and 0.1 g/kg body weight, respectively; MWP high-dose group, MWP medium-dose group, and MWP low-dose group, which were treated with MWP at doses of 1, 0.5, and 0.1 g/kg body weight, respectively; control group, which was treated with distilled water.
Dose administration, hypoxia tolerance test, forced swim test, and the detection of plasma biochemical parameters and tissue glycogen were the same as described in the Section “Use of the BALB/c mouse model to determine hypoxia tolerance and fatigue-relieving activities of maca powder”.
Statistical analysis Data were expressed as means ± standard deviation (SD), and were analyzed using SPSS version 17.0 (IBM Corp., New York, USA). The differences between groups were assessed by analysis of variance (ANOVA); p < 0.05 was considered statistically significant, and p < 0.01 was considered statistically very significant.
Results
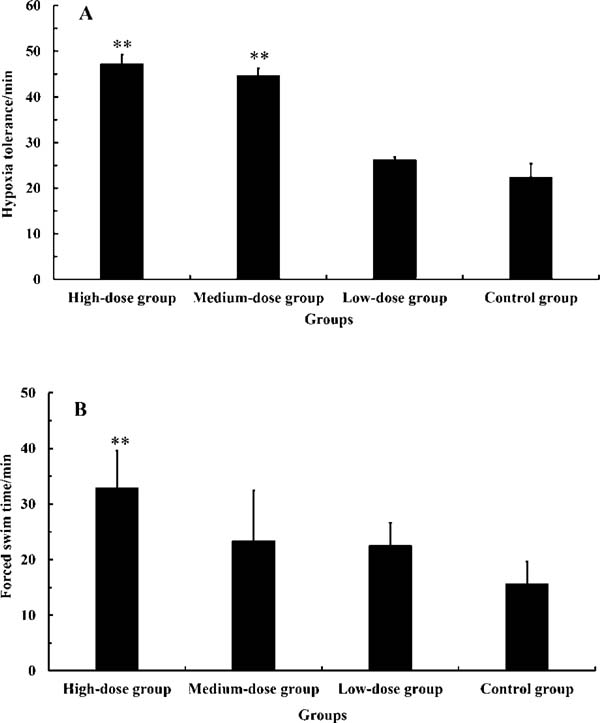
Effect of maca powder on hypoxia tolerance Results for HTs of mice in the present study are shown in Figure 1-A. HT of the high- and medium-dose groups were 47.19 ± 2.03 and 44.65 ± 1.63 min, respectively. When compared with the control group (22.41 ± 2.96 min), the ANOVA p values were 2.4 × 10⁻⁴ and 3.6 × 10⁻⁴, respectively, indicating that HT of the high- and medium-dose groups were very significantly longer than that of the control group. This indicates that maca significantly prolongs the hypoxia time of mice. Furthermore, dose dependence of the hypoxia tolerance was observed, as the ANOVA p value of the high-dose group compared to the low-dose group was 4.6 × 10⁻⁴ (<0.01).
Effect of maca powder in relieving fatigue
Forced swim test. FST results for mice administered maca powder are shown in Figure 1-B. FSTs of the three treated groups were all longer than that of the control group. Furthermore, FST of the high-dose group (32.84 ± 6.73 min) was very significantly longer than that of the control group (14.06 ± 3.10 min), as the ANOVA p value was 0.002 (<0.01) and the increased proportion was 110.24%. This indicates that maca can significantly enhance the exercise tolerance of mice. Furthermore, significant differences in FSTs between the high-dose group and the medium- and low-dose groups were observed, as the ANOVA p values were 0.04 and 0.002, respectively, meaning that the effect of maca in prolonging FST was dose-dependent.
Biochemical parameters. Results for BSR, LDH, BLA, BUN, LG, and MG of groups administered maca powder are shown in Table 1. BSR values of the treated groups were all lower than that of the control group, and the p value comparing the high-dose and control groups was 0.024 (<0.05), indicating that the difference between them was significant. Maca powder significantly stabilized the blood sugar level of mice during the forced swim test.
Table 1.
Effects of maca powder, MAE and MWP on biochemical parameters
|
Maca Powder |
MAE |
MWP |
Control group |
|
High-dose group |
Medium-dose group |
Low-dose group |
High-dose group |
Medium-dose group |
Low-dose group |
High-dose group |
Medium-dose group |
Low-dose group |
| BSR (%) |
8.71 ± 4.89* |
16.10 ± 16.04 |
21.97 ± 6.21 |
18.86 ± 11.09 |
15.00 ± 4.29 |
6.29 ± 4.13* |
20.22 ± 12.33 |
11.32 ± 3.14* |
4.49 ± 4.04** |
34.18 ± 10.73 |
| LDH (IU/L) |
1388 ± 149** |
714 ± 870 |
650 ± .12 |
1008 ± 802 |
454 ± 46 |
652 ± 106 |
845 ± 681 |
1156 ± 1091 |
554 ± 43 |
445 ± 63 |
| BLA (mmol/L) |
8.20 ± 1.27 |
7.5 ± 1.27** |
5.60 ± 0.25** |
15.27 ± 0.58 |
12.70 ± 1.55 |
8.90 ± 3.20 |
11.67 ± 1.79 |
10.5 ± 2.76 |
9.2 ± 1.65 |
9.8 ± 0.56 |
| BUN (mmol/L) |
5.77 ± 0.63** |
4.95 ± 0.03** |
5.42 ± 0.23** |
6.12 ± 0.09* |
7.61 ± 0.56 |
5.99 ± 0.36** |
10.98 ± 1.81 |
9.56 ± 1.05 |
10.48 ± 1.62 |
8.17 ± 0.55 |
| LG (mg/g) |
10.64 ± 0.12** |
11.39 ± 0.31** |
8.04 ± 0.24** |
9.02 ± 1.23** |
9.40 ± 0.89** |
12.06 ± 0.01** |
9.55 ± 1.36** |
11.27 ± 0.61** |
11.09 ± 1.11** |
4.84 ± 0.07 |
| MG (mg/g) |
1.52 ± 0.01** |
1.74 ± 0.01** |
1.67 ± 0.05** |
1.18 ± 0.13 |
1.43 ± 0.15* |
1.26 ± 0.01** |
1.45 ± 0.17* |
1.25 ± 0.02 |
1.23 ± 0.16 |
1.08 ± 0.03 |
Values are expressed as mean ± S.D. n=6 in each group. BSR=blood sugar ratios, BLA=blood lactic acid, LDH=lactic dehydrogenase, BUN= blood urea nitrogen, LG= liver glycogen, MG= muscle glycogen.
* denotes p < 0.05 compared with the control group;
** denotes p < 0.01 compared with the control group.
LDH values of the three treated groups were all higher than that of the control group. Furthermore, the difference between the high-dose group and the control group was very significant, as the p value between them was 1.75 × 10⁻⁵ (<0.01).
BLA values of the three treated groups were all lower than that of the control group as well. And the ANOVA results revealed that the p values comparing the medium-, low-dose, and control groups were 0.024 and 0.001 (<0.05), indicating that the differences between them were all significant and maca powder could dramatically inhibit the production of BLA.
BUN of maca powder treated mice were all lower than that of the control group. And the their p values of three treated groups compare to the control group were 3.14 × 10⁻⁴, 2.12 × 10⁻⁵, 2.60 × 10⁻⁴ respectively, all lower than 0.01, mean that after the consuming of maca, the body gain the ability to fulfill the requirement of energy in vigorous exercise so that there is no need to use energy sources such as protein and aminol acid.
These results indicate that maca powder can very significantly promote the accumulation of LG (the p values between the high-, medium-, low-dose, and control groups were 5.27 × 10⁻¹⁰, 2.02 × 10⁻¹⁰, and 5.91 × 10⁻¹⁰ (<0.01) and MG (the p values between the high-, medium-, low-dose, and control groups were 4.64 × 10⁻⁸, 1.72 × 10⁻⁹, and 4.35 × 10⁻⁹ (<0.01).
Total sugar content and monosaccharide composition of MAE and MWP MAE and MWP in this study were extracted by boiling-water bath, indicating that they are heat resistant. The total sugar contents of MAE and MWP are shown in Figure 2-A. The total sugar content of MAE was 69.32 ± 0.23%. After several purifications by alcohol precipitation, the total sugar contents were very significantly increased to 76.19 ± 0.12% (after the first precipitation, ANOVA p with MAE was 1.03 × 10⁻⁸), 83.31 ± 0.37% (after the third, ANOVA p compared to the first was 2.41 × 10⁻⁸), and 90.41 ± 2.6% (after the fifth, ANOVA p compared to the third was 0.01).

The monosaccharide composition of MWP is shown by comparing Figures 2-B and 2-C. Figure 2-B is the chromatogram of four standard monosaccharides, in which peak 1 is arabinose, peak 2 is galactose, peak 3 is glucose, and peak 4 is xylose. Figure 2-C is the chromatogram of MWP, in which only one peak near 17 min was observed, which is close to the glucose peak in Figure 2-B, indicating that the main monosaccharide composition of MWP is glucose, and the content is 79.88%. SO42– content in MAE was found to be 14.36 ± 3.82%, but null in MWP.
Effect of MAE on hypoxia tolerance HT results for mice in the MAE groups are shown in Figure 3-A. HT of the high-, medium-, and low-dose groups and the control group were 51.91 ± 2.11, 68.58 ± 16.33, 44.30 ± 3.97, and 14.06 ± 3.10 min, respectively. The ANOVA p values of the high- and medium-dose groups compared to the control group were 0.026 and 0.006, respectively, meaning that HT values of the high- and medium-dose groups were significantly longer than that of the control group. This indicates that MAE can significantly prolong the HT of mice.

Effect of MAE on relief of fatigue Forced swim test. FST results for mice administered MAE are shown in Figure 3-B, in which values for the high-, medium-, and low-dose mice were 47.50 ± 30.04, 35.25 ± 14.06, and 30.78 ± 4.64 min, respectively, all longer than that of the control group (14.06 ± 3.10 min). The difference between the medium-dose group and the control group was significant, as the ANOVA p value was 0.025 (<0.05). That indicated MAE could significantly enhance the exercise tolerance of mice. But as the p value for the high-dose group was high, the result for this group was considered to be not significant, although its mean value was the highest among the three groups.
Biochemical parameters. For mice administered MAE, the results for biochemical parameters are shown in Table 1. According to the ANOVA analysis, significantly better results were observed for BSR (the p value comparing the low-dose and control groups was 0.023 [<0.05]), BUN (the p values comparing the high-, low-dose, and control groups were 0.012 and 0.008 [<0.05]), LG (the p values comparing the high-, medium-, low-dose, and control groups were 0.004, 0.003, and 0.001 [<0.01]), and MG (the p values comparing the medium-, low-dose, and control groups were 0.004 and 0.003 [<0.01]).
Effect of MWP on hypoxia tolerance Figure 4-A shows the HT results for the groups administered MWP. HT values of the high-, medium-, and low-dose groups and the control group were 40.76 ± 7.97, 36.92 ± 2.26, 46.87 ± 15.13, and 14.06 ± 3.10 min, respectively. And the ANOVA p values of the high-, medium-, and low-dose groups compared to the control group were 0.103, 0.171, and 0.048, respectively, which means that HT of the low-dose group was significantly longer than that of the control group. This indicates that MWP can prolong the HT of mice.
Effect of MWP on relief of fatigue
Forced swim test. Figure 4-B shows the results of FSTs for the groups administered MWP, in which the values for high-, medium-, and low-dose groups were 40.76 ± 7.97, 36.92 ± 2.26, and 46.87 ± 15.13 min, respectively, all longer than that of the control group (14.06 ± 3.10 min). Furthermore, the ANOVA p value of the low-dose group compared to the control group was 0.048 [<0.05]. This indicates that MWP can significantly enhance the exercise ability of mice.
Biochemical parameters. Results for biochemical parameters of the groups administered MWP are shown in Table 1. Three of the six biochemical parameters were detected to be significantly better than that of the control group: BSR (p values comparing the medium-, low-dose, and control groups were 0.011 and 0.002 [<0.05]), LG (p values comparing the high-, medium-, low-dose, and control groups were 0.005, 0.002, and 0.002 [<0.01]) and MG (p value comparing the high-dose and control groups was 0.031 [<0.05]). And other three parameters: LDH, BLA and BUN were not optimized significantly.
Discussion
In the pilot study, the HT and fatigue-relieving activities of maca powder, MAE, maca alcohol extracts, and maca chloroform extracts were investigated, and the results showed that only maca powder and MAE could significantly prolong HT and enhance the athletic ability of mice. Therefore, maca powder and MAE were selected for further research. Furthermore, previous studies found that the carbohydrate content of maca is approximately 59.0% (Dini, Migliuolo, Rastrelli, Saturnino and Schettino, 1993), and the total sugar content of MAE in this study was found to be 69.32 ± 0.23%. Various studies have shown that polysaccharides demonstrate biological activities (Jin, Huang, Ke and Peng, 2013; You, Yin, Zhang and Jiang, 2014), which makes polysaccharides increasingly attractive as therapeutic agents. Hence we focused on the water-soluble polysaccharide components in tracking down the active substances in maca, which is effective in improving HT and relieving fatigue in mice.
In order to investigate its biological activities, highly purified MWP was essential. However, the existing methods for extracting and purifying polysaccharides are complicated, and generally microwave, ultrasonic, and chromatographic methods are needed. Hence we developed a simple method to extract and purify MWP, which only requires five steps of alcohol precipitation, and the final purity of MWP was up to 90.41%. This simple method equates to a relatively low cost process that is appropriate for industrial applications.
With respect to hypoxia tolerance, previous studies showed that a lack of oxygen would lead to low oxygen pressure in mitochondria, which may cause a shortage of energy that then affects the activity of cellular ion pumps, disturbs the gradients that control homeostasis, and kills the cell (Zhang et al., 2011). And studies have demonstrated that polysaccharides extracted from Sipunculus nudus L (Zhang et al., 2011), Brassica rapa L (Yue, Jiang, Su, Pi, Chao and Ping, 2010), and Schisandra chinensis (Zhang, et al., 2011) could significantly prolong hypoxia time. In the present study, each mouse was put into a sealed bottle, which contained a certain volume of air that was not replenished, to simulate a low-oxygen environment to investigate the hypoxia tolerance of mice. The longest HT values of the maca powder, MAE, and MWP groups were 47.19 ± 2.03, 68.58 ± 16.33, and 46.87 ± 15.13 min, respectively. MAE performed better than maca powder and MWP, the performances of maca powder and MWP were about the same, and they all performed significantly better than the control group. Considering the progressive relationship between the sources of these three samples, we may speculate that maca improves hypoxia tolerance, and MWP is one of the active substances, but not the only one. Some other active constituents such as benzylglucosinolate (Ikeuchi, Koyama, Takei, Kino and Yazawa, 2009) may be eliminated during the alcohol precipitation steps, as they may be soluble in 80% alcohol solution.
The forced swim test was carried out as an exercise model to evaluate fatigue-relieving activity. FST values of the maca powder, MAE, and MWP groups were 32.84 ± 6.73, 35.25 ± 14.06, and 48.32 ± 10.77 min, respectively, so that a trend of increasingly good performance was observed with successive extraction steps. Hence it seems that MWP is at least one of the active substances that gives maca powder and MAE the ability to improve FST results of mice. Previous studies have demonstrated that polysaccharides extracted from other species are effective in enhancing FST results of mice, such as Panax ginseng C. A. Meyer (Wang, Li, Fan, Chen, Liu, Cheng, Gao and Zhou, 2010), Hippophae rhamnoides L., Lycium barbarum L., Lycium ruthenicum Murr, and Nitraria tangutorum Bobr (Ni, Gao, Wang, Du, Li, Li, Wei and Bi, 2013).
Furthermore, of the six measured biochemical parameters (BSR, LDH, BLA, BUN, LG, and MG) mice in the maca powder group tested positive, which may indicate the mechanism by which maca powder relieves fatigue is to enhance energy storage within the body, including LG and MG, and then to provide a long-term, continuous energy supply. Meanwhile, the increase in LDH may accelerate the glycolysis process to produce more ATP, and to digest BLA more quickly after exercise, allowing the body to recover normal conditions and prepare for the next exercise. At the meantime, maca has the potential to inhibit the production of lactic acid and protect cells from low pH conditions. And could significantly reduce the consumption of protein and amino acid, thus less BUN were produced and no harm would be introduced by BUN.
MWP may be the active substance in maca because of its ability to significantly optimize plasma biochemical parameters and enhance energy storage. In brief, MAE could stabilize BSR, increase LDH, reduce BUN, and increase LG and MG, but it did not inhibit the production of BLA. And BSR, LG, and MG values of the MWP group were positive.
As described above, besides its high purity and simple extraction method, another characteristic of MWP is that it is heat-resistant, as it still has biological activity after 1 h in an 80°C water bath during the extraction process. More research could be carried out on MWP in the future, such as determining the structure-function relationship between MWP and fatigue-relieving activity.
Based on the results above, two kinds of new relevant products were developed and patented. One was named “the essence of maca and seaweed” (patent number CN104397707A), in which maca powder and MWP were the main constituents, and kelp, collagen peptide, and Long-Yan were also added. The other was named “yogurt with maca” (patent number CN104304454A), in which MWP was added to fresh milk that then underwent a fermentation process to produce a delicious and nutritious yogurt. These two products were investigated and found to be effective in relieving fatigue.
In conclusion, we can confirm that maca is effective in enhancing hypoxia tolerance and relieving fatigue and may speculate that MWP is at least one of the active substances. Furthermore, the role of MWP is to maintain the energy supply of the body, including blood sugar and glycogen (LG and MG). However, it is probably not the only active substance. Some other substances that give maca powder the ability to enhance LDH and inhibit the production of BLA may be insoluble in water.
Ackenowledgrments This work was supported by the Grant from the National Natural Scientific Foundation of China (31171660, U1405214), the Foundation for Innovative Research Team of Jimei University (2010A005).
Abbreviations
BLA
blood lactic acid
BSR
blood sugar ratio
FST
forced swim time
HT
hypoxia time
LDH
lactic dehydrogenase
LG
liver glycogen
MAE
maca aqueous extracts
MG
muscle glycogen
MWP
maca water-soluble polysaccharide
References
- Ai Z., Cheng A. F., Yu Y. T., Yu L. J., and Jin W. W. (2014). Antidepressant-like behavioral, anatomical, and biochemical effects of petroleum ether extract from maca (lepidium meyenii) in mice exposed to chronic unpredictable mild stress. J Med Food, 17, 535-542.
- Bo Q. and Hui H. (2014). Anti-Fatigue effects of polysaccharides from Gynostemma pentaphyllum makino by forced swimming test. Adv. Mater. Res., 881–883, 426-429.
- Dini A., Migliuolo G., Rastrelli L., Saturnino P., and Schettino O. (1993). Chemical composition of Lepidium meyenii. Food Chem., 49, 347-349.
- Ganzera M., Zhao J. I., and Khan I. A. (2002). Chemical profiling and standardization of Lepidium meyenii (Maca) by reversed phase high performance liquid chromatography. Chem Pharm Bull, 50, 988-991.
- Gonzales G. F., Gasco M., and Lozada R. I. (2013). Role of Maca (Lepidium meyenii) consumption on serum interleukin-6 levels and health status in populations living in the Peruvian Central Andes over 4000 m of altitude. Plant Food Humnutr, 68, 347-351.
- Gonzales G. F., Gonzales C., and Gonzales C. C. (2009). Lepidium meyenii (Maca): A Plant from the Highlands of Peru—from Tradition to Science. Forschende Komplementärmedizin, 16, 373-380.
- Gonzales-Castañeda C., Rivera V., Chirinos A. L., Evelson P., and Gonzales G. F. (2011). Photoprotection against the UVB-induced oxidative stress and epidermal damage in mice using leaves of three different varieties of Lepidium meyenii (maca). Int J Dermatol, 50, 928-938.
- Gustavo G. F. (2012). Ethnobiology and ethnopharmacology of Lepidium meyenii (Maca), a plant from the Peruvian highlands. Evid-Based Compl Alt., 2012, 193496-193496.
- Hao G., Cao W., Hao J., and Zhang C. (2013). In Vitro Antioxidant Activity and In Vivo Anti-fatigue Effects of Oyster (Ostrea plicatula Gmelin) Peptides Prepared Using Neutral Proteinase. Food Sci Technol Res, 19, 623-631.
- Hill A. V. and Kupalov P. (1929). Anaerobic and aerobic activity in isolated muscle. P Roy Soc B-Biol Sci, 105, 313-322.
- Ikeuchi M., Koyama T., Takei S., Kino T., and Yazawa T. (2009). Effects of benzylglucosinolate on endurance capacity in mice. J Health Sci, 55, 178-182.
- Jin M., Huang Q., Ke Z., and Peng S. (2013). Biological activities and potential health benefit effects of polysaccharides isolated from Lycium barbarum L. Int J Biol Macromol, 54, 16-23.
- Jung K., Han D. E., Lee C., and Kim Y. (2007). Antifatigue effect of Rubus coreanus miquel extract in mice. J Med Food, 10: 689-693.
- Kawai Y., Seno N., and Anno K. (1969). A modified method for chondrosulfatase assay. Analytical Biochemistry. Anal Biochem, 32, 314-321.
- Kumar G. P., Anand T., Singsit D., Khanum F., and Anilakumar K. R. (2013). Evaluation of antioxidant and anti-fatigue properties of Trigonella foenum-graecum L. in rats subjected to weight loaded forced swim test. Pharmacogn. J., 5, 66-71.
- Lin Y., Liu H. L., Fang J., Yu C. H., Xiong Y. K., and Ke Y. (2014). Anti-fatigue and vasoprotective effects of quercetin-3-O-gentiobiose on oxidative stress and vascular endothelial dysfunction induced by endurance swimming in rats. Food Chem Toxicol, 68, 290-296.
- Luo L., Cai L. M., and Hu X. J. (2014). Evaluation of the anti-hypoxia and anti-fatigue effects of ganoderma lucidum polysaccharides. J Appl Biomater Biom, 522-524, 303-306.
- Morris D. L. (1948). Quantitative determination of carbohydrates with dreywood's anthrone reagent. Science, 107, 254-255.
- Ni W., Gao T., Wang H., Du Y., Li J., Li C., Wei L., and Bi H. (2013). Anti-fatigue activity of polysaccharides from the fruits of four Tibetan plateau indigenous medicinal plants. J Ethnopharmacol., 150, 529-535.
- Ren J., Zhao M., Wang H., Cui C., and You L. (2011). Effects of supplementation with grass carp protein versus peptide on swimming endurance in mice. Nutrition, 27, 789-795.
- Rubio J., Qiong W., Liu X., Jiang Z., Dang H., Chen S. L., and Gonzales G. F. (2011). Aqueous extract of black Maca (Lepidium meyenii) on memory impairment induced by ovariectomy in mice. Evid-Based Compl Alt., 2011, 253958.
- Shao J. T., Wang M. Y., and Zheng L. B. (2013). Antifatigue effect of Gracilaria eucheumoides in mice. Exp Ther Med., 6, 1512-1516.
- Večeřa, R., Orolin, J., Škottová, N., Kazdová, L., Oliyarnik, O., Ulrichová, J., and Simanek V. (2007). The influence of maca (Lepidium meyenii) on antioxidant status, lipid and glucose metabolism in rat. Plant Food Humnutr., 62, 59-63.
- Wang B., Yan F., and Cai L. (2014). Anti-fatigue properties of icariin from Epimedium brevicornum. Biomed Res-India., 25, 297-302.
- Wang J. J., Shieh M. J., Kuo S. L., Lee C. L., and Pan T. M. (2006). Effect of red mold rice on antifatigue and exercise-related changes in lipid peroxidation in endurance exercise. Appl Microbiol Biot., 70, 247-253.
- Wang J., Li S., Fan Y., Chen Y., Liu D., Cheng H., Gao X., and Zhou Y. (2010). Antifatigue activity of the water-soluble polysaccharides isolated from Panax ginseng C. A. Meyer. J Ethnopharmacol., 130, 421-423.
- Westerblad, H. and Allen, D. G. (2003). Cellular mechanisms of skeletal muscle fatigue. Adv. Exp. Med. Biol., 538, 563-571.
- Xu C., Lv J., Lo M., Cui S. W., Hu X., and Fan M. (2012). Effects of oat β-glucan on endurance exercise and its anti-fatigue properties in trained rats. Carbohyd. Polym., 92, 1159-1165.
- You L., Zhao M., Regenstein J. M., and Ren J. (2011). In vitro antioxidant activity and in vivo anti-fatigue effect of loach (Misgurnus anguillicaudatus) peptides prepared by papain digestion. Food Chem., 124, 188-194.
- You Q., Yin X., Zhang S., and Jiang Z. (2014). Extraction, purification, and antioxidant activities of polysaccharides from Tricholoma mongolicum Imai. Carbohyd Polym., 99, 1-10.
- Yue X., Jiang S., Su D., Pi N., Chao M., and Ping G. (2010). Composition analysis and anti-hypoxia activity of polysaccharide from Brassica rapa L. Int J Biol Macromol., 47, 528-533.
- Zhang C. and Dai Z. (2011). Anti-hypoxia activity of a polysaccharide extracted from the Sipunculus nudus L. Int J Biol Macromol., 49, 523-526.
- Zhang H., Liu Y., Zhou J., Wang J., and Sun B. (2014). Amylopectin is the anti-fatigue ingredient in glutinous rice. Int J Biol Macromo., 63, 240-243.
- Zhang X. L., Ren F., Huang W., Ding R. T., Zhou Q. S., and Liu X. W. (2010). Anti-fatigue activity of extracts of stem bark from acanthopanax senticosus. Molecules, 16, 28-37.
- Zhang Z. and Xu S. (2011). Effects of schisandra chinensis polysaccharides on anti-fatigue and anti-hypoxia in mice. J. For. Res., 39, 98-104.
- Zheng B., He K., Kim C., Hyung C., Rogers L., Shao Y., Huang Z., Lu Y., Qien L., and Zheng Q. (2000). Effect of a lipidic extract from lepidium meyenii on sexual behavior in mice and rats. Urology, 55, 598-602.