Abstract
This study investigated the influence of mixing and fermentation times on the chemical and physical properties of white pan bread, a typical bread consumed in Japan. Sixteen bread samples were made by combining four dough mixing stages and four dough fermentation times, and were analyzed for compression force, acids, sugars, amino acids, volatile chemicals, and overall preference in a sensory evaluation. Acids, sugars, and amino acids were analyzed using HPLC, while volatile flavor compounds were analyzed with GC/MS. The effects of mixing and fermentation times on these parameters were analyzed using analysis of variance (ANOVA). Fermentation time was positively correlated with the majority of volatile chemicals and acids, and negatively correlated with amino acids. Compression force and sugars, such as galactose and maltose, were affected by both mixing and fermentation times. Overall preference was highest in the breads mixed to the over-mixing stage and fermented for 60 min. The results of this paper are expected to be of importance in controlling the flavor, taste, and texture of white pan bread.
Introduction
Bread was introduced to Japan in the middle of the 19th century, but became important as a staple food after World War II. As of 2011, the consumption of bread has surpassed that of rice in terms of monetary amounts i). More than one-half of the bread produced in Japan is white pan bread (Shoku-pan), which is made from flour with very high protein and low ash contents, and is baked into a Pullman loaf shape. Due to the flour characteristics and manufacturing methods that employ a relatively high mixing energy, white pan bread has a typical soft texture and fine pore structure.
In the manufacturing of bread, the mixing and fermentation processes have a large influence on the end product. The mixing process has three objectives (Seabourn, et al. 2008): to homogenize all of the ingredients, to develop a three-dimensional protein network with the capacity to hold gas, and to incorporate air cells into the dough. The degree of mixing affects the aeration and rheology of the dough (Chin and Campbell 2005), which ultimately affects the structure and texture of the baked bread. In this context, the relationship between mixing conditions and bread texture has been studied intensively (Ktenioudaki, et al. 2010, Paredeslopez and Bushuk 1983). However, there are few reports relating mixing conditions to the chemical composition of the bread as well as its flavor and taste.
Fermentation affects both the physical and chemical properties of the dough. The carbon dioxide produced by the yeast not only enables dough volume expansion but also decreases the dough pH value (Yang 2006). The starch and protein is hydrolyzed by enzymes naturally existing in the flour, softening the dough and producing taste compounds. Furthermore, the metabolism of yeast and oxidization of flour lipids result in many aroma compounds (Frasse, et al. 1992, Maeda, et al. 2009).
Ultimately, with optimal mixing and fermentation conditions, the dough obtains desirable viscoelastic properties after the final proofing stage, enabling it to expand in the oven (oven spring) and resulting in a bread with desirable volume, gas cell structure, and flavor. This study focuses on the manufacturing processes of white pan bread with the following objectives: to quantify the influence of mixing and fermentation times on the chemical and physical properties of the bread, and to determine the optimum processing parameters that produce bread exhibiting high preference in sensory tests.
Materials and Methods
Sample preparation White bread samples were prepared using the no-punch straight dough method, as described by Maeda, et al. (2009). Table 1 shows the sample ingredients. Mixing times were set at four levels, as shown in Table 2, and primary fermentation times were set at 15, 60, 120, and 300 min. All combinations of mixing and fermentation times were used to make 16 types of samples. In the standard manufacturing process, the dough is mixed to the final mixing stage (level 3) and the primary fermentation time is 120 min.
Table 1.
Ingredients of the samples
| Ingredients |
(%) |
| Wheat flour (Camellia: Nisshin Flour Milling Inc. |
100.0 |
| Yeast (Regular: Oriental Yeast, Ltd.) |
2.0 |
| Yeastfood (Oriental Yeast, Ltd.) |
0.1 |
| Sugar |
6.0 |
| Salt |
2.0 |
| Defatted powder milk |
2.0 |
| Shortning |
5.0 |
| Water |
70.0 |
Table 2.
Mixing times and speeds
| Mixing stage |
Mixing time and speed |
| Pick-up |
100 rpm for 3 min |
| Clean-up |
100 rpm for 3 min + 200 rpm for 8 min |
| Final |
100 rpm for 3 min + 200 rpm for 10 min + 285 rpm for 3 min |
| Over-mixing |
100 rpm for 3 min + 200 rpm for 10 min + 285 rpm for 8 min |
All samples were mixed by a mixer (DTM-50; SK Mixer Co., Ltd., Saitama, Japan) and primary fermentation was performed in a fermenting vessel (Took Final Proofer; Tokura Shoji Co., Ltd., Shiga, Japan) at 27°C and 75% relative humidity. The samples were divided evenly into doughs weighing 460 g, rolled, and allowed to rest for 20 min at room temperature before molding with a molder (Wide Find; Oshikiri Co., Ltd., Kanagawa, Japan). Final proofing was performed at 38°C and 85% relative humidity in a rectangular mold until the top of the dough was 2.5 cm below the top of the mold. The molds were sealed with a lid, and the doughs were baked into a Pullman shaped loaf in an oven (Took Oven; Tokura Shoji Co., Ltd.). The baking temperature was 210°C and the baking time was 38 min. All loaves reached the top of the mold after baking and their specific volumes were 4.0 cm3/g. The sample preparation processes were performed by well-trained professionals in the field of bread making.
All 16 bread samples were cooled to room temperature for one night and sliced to 18-mm thickness. The two slices at each end were discarded and the four slices in the middle were used for the following measurements.
Compression test The compression test was performed according to the AACC method (AACC 1999), with some modifications. The measuring device (EZ Test-20N; Shimadzu Co., Kyoto, Japan) was corrected with a 10 N standard test weight before measurement.
The crust was cut off from each slice and the inner crumb was used for measurement. A circular plunger with a diameter of 60 mm was used to compress the sample to 75% of its original height (18 mm × 75% = 13.5 mm), and the maximum compression force was recorded. The diameter of the plunger and the distortion rate was decided based on pre-experiment results. The compression speed was 30 mm/min. The test was performed with three slices for all 16 types of bread.
HPLC analysis of sugars, organic acids, and amino acids Organic acids, sugars, and amino acids were analyzed with HPLC. The crust was cut off from the bread slices and the crumb was frozen at −50°C in a quick freezer (FR-6C3D-S; Hoshizaki Electric Co., Ltd., Aichi, Japan) for one night. The samples were transferred to a vacuum freeze-dryer, which was cooled to −50°C, and were kept at −50°C for 30 min before vacuum suctioning. Cooling was turned off after the pressure reached 5 mTorr and the samples were left in vacuum for 24 h. The freeze-dried (FD) samples were kept in airtight polyethylene bags. Two replicates for all 16 samples were measured for organic acids and sugars, while one replicate was measured for amino acids.
For the analysis of organic acids, the FD samples were crushed with a hammer and milled in a coffee mill (Millser IFM-100; Iwatani Co., Tokyo, Japan) for 1 min (2 sets of 30 s) at 4°C. The milled samples were weighed to 1.0 g, and mixed with 10 mL of ultrapure water in a 15 mL falcon tube using a vortex mixer. The mixture was sonicated (Sonocleaner 100Z; Kaijo Co., Tokyo, Japan) for 3 min, kept at 4°C in a shaking apparatus for 30 min, and centrifuged (Hitachi HIMAC Centrifuge CR5B2; Hitachi Koki Co., Ltd., Tokyo, Japan) at 4°C and 4000 rpm for 20 min. The supernatant was transferred to three 1.5 mL tubes (1.0 mL of the mixture in each tube) and centrifuged (Hitachi HIMAC CR15; Hitachi Koki Co., Ltd.) at 12000 rpm for 15 min. The supernatant was passed through a 0.22 mm filter unit (Amicon Millipore; ultra-free r-MC, Lot No. R3BN92451, Merck Millipore, Darmstadt, Germany) and centrifuged again at 12000 rpm for 5 min.
HPLC analyses were performed with a Hitachi HPLC LaChrom Elite acid analysis system (Hitachi High Technologies, Inc., Tokyo, Japan), equipped with an auto sampler (AS-2000), column oven (L-5020), intelligent pump (L-6200), reaction unit (L-5050) and UV-VIS detector (L-4250). Two columns (Shodex KC-811, 8.0 mm × 300 mm) were used. Analysis was performed for the organic acids listed in Table 3. Reference solutions of all the acids were made at 100 ppm, 50 ppm, and 25 ppm, and measured twice to create calibration curves. A solution of 0.1% phosphoric acid was used as eluent and 0.1 mM bromothymol blue (BTB) solution was used for detection. The column temperature was 40°C, sample quantity was 10 µL, and analysis time was 90 min. Detection was performed at 430 nm.
Table 3.
Analyzed acids, sugars and free amino acids
| Acids |
Citric acid |
L-Malic acid |
Succinic acid |
| L-Lactic acid |
Ascorbic acid |
Acetic acid |
| Sugars |
Xylose |
Arabinose |
Fructose |
| Mannose |
Glucose |
Galactose |
| Sucrose |
Maltose |
Lactose |
| Free amino acids |
Alanine (Ala) |
Arginine (Arg) |
Asparagine (Asn) |
| Aspartic acid (Asp) |
Cysteine (Cys) |
Glutamic acid (Glu) |
| Glutamine (Gln) |
Glycine (Gly) |
Histidine (His) |
| Isoleucine (lle) |
Leucine (Leu) |
Lysine (Lys) |
| Methionine (Met) |
Phenylalanine (Phe) |
Proline (Pro) |
| Serine (Ser) |
Threonine (Thr) |
Tryptophan (Trp) |
| Tyrosine (Tyr) |
Valine (Val) |
a-aminobutyric acid (AABA) |
| Monoethanolamine (MEA) |
Ammonia (NH3) |
Citrulline (Cit) |
| Cystathionine (Cysta) |
g-aminobutyric acid (GABA) |
Ornithine (Om) |
| Phosphatidylserine (PSer) |
Taurine (Tau) |
Urea |
Sample preparation for analysis of sugars was the same as that of acids, and followed the method employed by the Japan Food Research Laboratories ii). HPLC was performed with a Hitachi HPLC LaChrom Elite sugar analysis system (Hitachi High Technologies, Inc.), equipped with an auto sampler (L-2200), column oven (L-2300), intelligent pump (L-2130), reaction unit (L-5050) and FL Detector (L-2480). An Asahipak NH2P-50 column (4.6 mm x 250 mm, Showa Denko K.K., Tokyo, Japan) was used. Analysis was performed for the sugars listed in Table 3. Calibration curves were made with 1000 ppm, 100 ppm, and 10 ppm solutions. Three types of eluent were made by mixing 0.5% phosphoric acid and acetonitrile / water solution mixed at volume ratios of 90/10, 75/25, and 60/40. Detection solution was made by mixing phosphoric acid, acetic acid, and phenylhydrazine at a volume ratio of 220/180/6. The column temperature was 40°C, sample quantity was 10 µL, and analysis time was 75 min. Detection was performed with an excitation wavelength of 330 nm and an emission wavelength of 470 nm.
Sample preparation for amino acid analysis was the same as that of acids and sugars, except that extraction was performed with citric acid buffer solution (pH 3.15) instead of water. An automatic amino acid analyzer (JLC-500/V; JEOL Ltd., Tokyo, Japan) was used with a LCR-6 column (4 mm x 120 mm; JEOL Ltd.). Amino acids listed in Table 3 were analyzed. The sample quantity was 50 µL and detection was performed with the ninhydrin method using 440 nm for hydroxyproline and proline, and 570 nm for the other amino acids.
Identification of flavor compounds by GC/MS Flavor compounds were measured according to Maeda, et al. (2009). A static headspace autosampler (7000 Headspace Autosampler; Teledyne Tekmar Inc., USA) was used with a gas chromatograph (GC) (Model 6890; Agilent Technologies Inc., California, USA) and a mass spectrometer (MS) (Automass SUN-200S; JEOL Ltd.). A DB-5 column (30 m length, 0.25 mm diameter. and 1.0 µm membrane thickness; Agilent Technologies Inc.) was used for the GC.
The center part of each slice was sampled and 3 g of the crumb was used for measurement. The analytical conditions of the headspace sampler were as follows: sample temperature 80°C, injection temperature 160°C, injection time 0.6 min, needle temperature 80°C, and transfer temperature 160°C. High-purity helium gas (1.2 mL/min) was used for GC, and the column temperature was programmed to be held at 50°C for 3 min, elevated 4°C/min until 260°C, and held at 260°C for 15 min. The conditions for MS were as follows: interface temperature 250°C, transfer temperature 160°C, ion source temperature 230°C, ionization energy 70 eV, and scan cycle time 0.5 ms (30 – 300 m/z). A mass spectral search program (Version 2.0; National Institute of Standards & Technology) was used for library search and identification, and quantification software (EZChrom Elite; GL Sciences Inc., Tokyo, Japan) was used to calculate the total ion peak areas.
Sensory evaluation Sensory evaluation was performed by 23 expert sensory assessors at Nisshin Seihun, Co., Inc. on the 16 bread samples to test for “overall preference”. The sensory assessors are experts who have engaged in bread and baking research for at least five years. After baking, test samples of white bread were cooled for 120 min until they reached room temperature and were then sliced into 18 mm thickness. The slices were individually sealed in polyethylene plastic zipper bags and were evaluated on the day after baking. A 9-point category scale was used at 0.5 point intervals (1: dislike, 5: like), and the bread sample mixed to the final mixing stage and fermented for 120 min was used as a standard (rated as 3).
Statistical analysis Statistical analysis was performed using MATLAB R2015b (8.6.0) (The MathWorks, Inc., Massachusetts, USA). To analyze the effects of both mixing and fermentation times on the chemical, physical, and sensory characteristics of bread, all values were rearranged in a two-dimensional (2D) matrix as shown in Fig. 1A, with mixing stages on the x-axis and fermentation times on the y-axis. The objective of this analysis was to classify the chemical characteristics (sugars, organic acids, amino acids, and flavor compounds) and physical characteristics (maximum compression force) into (i) those that are affected mainly by mixing time, (ii) those that are affected mainly by fermentation time, and (iii) those that are affected both by mixing and fermentation times. Figure 1B shows one example of a parameter that is mostly affected by fermentation time. Values are shown in colors from black (low) to white (high). The 2D patterns of the chemical and physical values were compared to typical patterns shown in Fig. 1C. Patterns (1) to (3) and patterns (4) to (6) correspond to values where mixing time and fermentation time play a major effect, respectively, and patterns (7) to (22) correspond to values where one combination of mixing and fermentation time gives a high value (16 variations for the 16 combinations of mixing and fermentation times). More patterns can be made (for example, one having multiple peaks), but those used here were kept simple to facilitate interpretation. The 2D correlation coefficient (corr) defined by the following equation was used to compare the pattern of each parameter and the 22 typical patterns:

where X is the 2D pattern of a chemical or physical value and A is one of the typical 22 patterns, and X and A are the mean values. The matrices representing the 22 typical patterns (A) consist of integers 1 to 4. For example, pattern (1) is expressed as
The 2D correlation coefficient was calculated between each parameter and all of the 22 typical patterns, and each parameter was classified depending on the pattern with the highest correlation (positive or negative). A high negative correlation with pattern (1), for example, would mean that values were affected mainly by mixing time, and that values were highest when mixing times were shortest.
Analysis of variance (ANOVA) was used to test if there was a significant difference in each chemical or physical value between different mixing stages and different fermentation times. Two-way ANOVA was performed to evaluate the effects of both mixing and fermentation times. Additionally, one-way ANOVA was performed to assess the significance of correlation between the pattern of each parameter and the typical pattern that it showed the highest correlation to.
Results and Discussion
Compression test results For the 48 samples measured, the average load was 0.33 kgf, maximum load was 0.71 kgf (mixing time level 1, fermentation time 15 min), and minimum load was 0.17 kgf (mixing time level 4, fermentation time 120 min).
Analyses of taste compounds by HPLC Table 4 shows the quantities of acids, sugars, and amino acids measured with HPLC. The average values of the 16 types of bread are shown with the standard deviations. The quantitative changes of these components through mixing and fermentation will be discussed in later sections.
Table 4.
Average amounts of organic acids, sugars and amino acids in the dough
| Acids [mg/100g sample] |
Citric acid |
L-Malic acid |
Succinic acid |
L-Lactic acid |
Ascorbic acid |
Acetic acid |
| 91.7±6.3 |
78.6±4.2 |
69.1±25.8 |
40.7±7.9 |
22.6±6.8 |
22.6±6.6 |
| Sugars [mg/100g sample] |
Xylose |
Arabinose |
Fructose |
Mannose |
Glucose |
Galactose |
| 44.2±0.2 |
23.7±0.0 |
1214±751 |
51.6±6.8 |
529.1±411.2 |
62.0±9.0 |
| Sucrose |
Maltose |
Lactose |
|
|
|
| 87.2±43.3 |
2831±370 |
719±57 |
|
|
|
| Amino acids [mg/100g sample] |
Ala |
Arg |
Asn |
Asp |
Cys |
Glu |
| 3.47±1.09 |
3.96±1.81 |
0.263±0.082 |
4.50±4.14 |
0.328±0.057 |
17.0±2.3 |
| Gin |
Gly |
His |
Ile |
Leu |
Lys |
| 2.20±1.34 |
2.89±1.25 |
0.084±0.079 |
0.285±0.032 |
0.676±0.107 |
1.72±0.51 |
| Met |
Phe |
Pro |
Ser |
Thr |
Trp |
| 0.039±0.035 |
0.314±0.091 |
2.65±1.76 |
0.630±0.225 |
0.998±0.323 |
1.49±1.68 |
| Tyr |
Val |
AABA |
MEA |
NH3 |
Cit |
| 0.552±0.427 |
0.737±0.197 |
0.022±0.005 |
0.326±0.072 |
4.42±1.95 |
2.67±0.77 |
| Cysta |
GABA |
Orn |
PSer |
Tau |
Urea |
| 0.352±0.085 |
1.46±1.21 |
1.03±0.44 |
2.25±0.41 |
1.01±0.34 |
1.52±0.27 |
The ratios of the six organic acids were well balanced, with citric, malic and succinic acids adding up to more than 70% of total acids. Although organic acids are important in the taste of sourdough fermentation, where lactic acid bacteria are added to the dough, their quantity and contribution to taste were much lower in the yeast-fermented dough. However, they are known to affect the viscoelastic properties of the dough through their effect on pH.
Approximately one-half of total sugars comprised maltose, followed by fructose, lactose, and glucose, with only traces of xylose, arabinose, mannose, galactose and sucrose. There are three sources of sugar in the dough: sugars naturally present in the flour (1 – 2% of total carbohydrates), sugar added as an ingredient, and maltose produced by the amylolytic breakdown of starch (Bell, et al. 2001). During fermentation, glucose and fructose are the first sugars to be used through yeast activity, while sucrose is rapidly broken down to glucose and fructose by yeast enzymes. On the other hand, maltose is not consumed until glucose is almost exhausted, due to yeast regulatory mechanisms (Maloney and Foy 2003). This is thought to be the reason for the high ratio of maltose in the crumb.
Amino acids not only contribute directly to the flavor and taste of bread, but also react with reducing sugars during the baking process to produce Maillard reaction products, which affect the color, flavor, and taste of the bread. Glutamic acid and ammonia account for a large proportion of the amino acids in flour (Chen and Bushuk 1970, Tkachuk 1965) and this seemed to be reflected in the amino acid composition of the doughs. Glutamic and aspartic acids are known for their “umami” flavor (Fuke and Konosu 1991), and glycine, alanine, and aminobutyric acid exhibit a sweet taste that is about one-half the degree of sucrose (Ishibashi, et al. 1988). Arginine, histidine, and leucine are known to produce a characteristic bread flavor (Benedito de Barber, et al. 1989), while proline was reported to lead to a cracker flavor (Wiseblatt and Zoumut 1963). Amino acids are also consumed by yeast during fermentation, which can be observed from the results presented in later sections.
Analyses of flavor compounds by GC/MS Detailed description of the volatile flavor compounds in the 16 types of bread are presented by Maeda, et al. (2009). Ethanol, which is the main flavor produced by yeast, contributed to over 80% of the total quantity of flavors. Excluding ethanol, alcohols (62.8%), aldehydes (11.8%), carboxylic acids (6.8%), ketones (5.1%), diketones (2.4%), and esters (1.2%) were the main flavor groups in the bread (percentages shown are the values for bread mixed to stage 3 and fermented for 120 min).
Effects of mixing and fermentation times on chemical and physical properties The effects of mixing and fermentation times on each chemical component and physical measurement were analyzed by comparing the 2D mixing-fermentation pattern with the typical 22 patterns, some of which are shown in Fig. 1C. Table 5 shows the chemical components and physical measurements with the patterns that they show the highest correlation to. Only the patterns that showed a significant difference (p < 0.01) by ANOVA (p: pmixing for patterns 1 to 3, pfermentation for patterns 4 to 6, ppattern for patterns 7 to 22) and had a correlation of over 0.70 with one of the typical patterns are shown. The results of two-way ANOVA are shown as pmixing and pfermentation, and those of one-way ANOVA are shown as ppattern. The patterns of representative components are shown in Fig. 2.
Table 5.
The effects of mixing and fermentation times on chemical / physical properties of bread. The chemical / physical properties are shown with the pattern they show highest correlation with.
| Chemical / Physical values |
pattern |
correlation |
ppattern |
pmixing |
pfermentation |
| Heptanal |
1 |
0.876 |
2.55E-05 |
1.08E-05 |
0.0359 |
|
| Chemical / Physical values |
pattern |
correlation |
ppattern |
pmixing |
pfermentation |
| 2-Methyl-propanoic acid |
4 |
0.883 |
3.10E-08 |
0.0045 |
6.31E-09 |
| Octanoic acid, ethyl ester |
4 |
0.859 |
1.14E-13 |
0.0084 |
8.61E-13 |
| Phenylethyl alcohol |
4 |
0.851 |
1.76E-06 |
3.26E-05 |
1.12E-09 |
| Hexanoic acid, ethyl ester |
4 |
0.814 |
3.88E-08 |
0.0056 |
9.29E-09 |
| 2-Methyl-l-Propanol + Propan |
4 |
0.949 |
6.73E-10 |
0.1236 |
1.03E-08 |
| 2,3-Pentanedione |
4 |
0.940 |
5.34E-06 |
0.2730 |
2.40E-05 |
| 3-Methyl-2-Butanone |
4 |
0.914 |
2.65E-06 |
0.5408 |
2.98E-05 |
| Succinic acid |
4 |
0.909 |
1.76E-11 |
0.2095 |
1.18E-09 |
| 3-Methyl-1-Butanol |
4 |
0.900 |
2.44E-09 |
0.0261 |
5.34E-09 |
| Ethanol |
4 |
0.900 |
1.41E-05 |
0.0554 |
1.02E-05 |
| TIC |
4 |
0.894 |
2.76E-05 |
0.1294 |
4.10E-05 |
| 2-Methyl-1-Butanol |
4 |
0.890 |
2.80E-07 |
0.0419 |
3.41E-07 |
| Lactic acid |
4 |
0.862 |
4.53E-07 |
0.2815 |
3.68E-06 |
| Ethyl Acetate |
4 |
0.858 |
2.31E-07 |
0.0696 |
4.95E-07 |
| 2-Methylbutanoic acid |
4 |
0.848 |
2.54E-09 |
0.1145 |
2.61E-08 |
| (Z)-2-Butenal |
4 |
0.832 |
6.90E-06 |
0.0765 |
7.94E-06 |
| Xylose |
4 |
0.830 |
8.88E-05 |
0.2022 |
1.64E-04 |
| Citric acid |
4 |
0.808 |
6.34E-04 |
0.1257 |
5.32E-04 |
| 3-Methylbutanoic acid |
4 |
0.799 |
1.83E-04 |
0.0290 |
4.63E-05 |
| Benzene acetaldehyde |
4 |
0.798 |
0.003665 |
0.0640 |
0.0014 |
| Gln |
4 |
−0.743 |
6.79E-04 |
0.5090 |
0.0021 |
| Cysta |
4 |
−0.823 |
5.56E-04 |
0.2304 |
8.32E-04 |
| Mannose |
4 |
−0.827 |
8.26E-05 |
0.3270 |
2.50E-04 |
| Lys |
4 |
−0.879 |
8.83E-06 |
0.2867 |
3.75E-05 |
| Cit |
4 |
−0.892 |
5.33E-05 |
0.4704 |
2.58E-04 |
| Arg |
4 |
−0.901 |
1.17E-05 |
0.4488 |
7.58E-05 |
| Gly |
4 |
−0.908 |
4.21E-06 |
0.6630 |
5.43E-05 |
| Hls |
4 |
−0.908 |
2.67E-05 |
0.2894 |
9.03E-05 |
| Acetone |
4 |
−0.912 |
2.16E-06 |
0.2625 |
1.14E-05 |
| Fructose |
4 |
−0.912 |
6.48E-06 |
0.3249 |
3.36E-05 |
| Sucrose |
4 |
−0.926 |
4.28E-06 |
0.1335 |
9.58E-06 |
| Trp |
4 |
−0.927 |
4.67E-09 |
0.9278 |
5.27E-07 |
| Ascorbic acid |
4 |
−0.931 |
4.81E-07 |
0.0403 |
5.00E-07 |
| Thr |
4 |
−0.937 |
5.66E-06 |
0.4664 |
4.50E-05 |
| Ser |
4 |
−0.938 |
4.83E-06 |
0.1509 |
1.20E-05 |
| Glucose |
4 |
−0.970 |
4.35E-09 |
0.2727 |
1.02E-07 |
| 2,3-Butanedione |
5 |
0.834 |
2.59E-04 |
0.4421 |
0.0022 |
| Glu |
5 |
−0.742 |
0.005434 |
0.7572 |
0.0092 |
| Asp |
5 |
−0.817 |
4.07E-10 |
0.5993 |
3.39E-07 |
| Val |
5 |
−0.835 |
3.02E-05 |
0.3119 |
2.27E-04 |
| Tyr |
5 |
−0.869 |
7.27E-08 |
0.0209 |
5.83E-09 |
| Phe |
5 |
−0.894 |
3.85E-07 |
0.4222 |
2.19E-05 |
| Ala |
5 |
−0.908 |
1.34E-09 |
0.7935 |
1.14E-06 |
| Orn |
6 |
0.810 |
2.41E-04 |
0.2100 |
2.88E-04 |
| 3-Hydroxy-2-Butanone |
6 |
0.748 |
5.92E-05 |
0.5663 |
3.80E-04 |
| 3-methyl-1-Butanol, acetate |
6 |
−0.782 |
8.40E-09 |
0.0268 |
9.65E-08 |
| Pro |
6 |
−0.792 |
4.33E-05 |
0.4470 |
6.20E-04 |
| Tau |
6 |
−0.798 |
7.28E-05 |
0.8467 |
0.0010 |
| Decanoic acid, ethyl ester |
6 |
−0.829 |
4.30E-13 |
0.0222 |
5.53E-13 |
| Lactose |
7 |
−0.736 |
2.85E-05 |
1.70E-04 |
1.87E-04 |
| NH3 |
8 |
−0.744 |
3.43E-05 |
0.2080 |
8.65E-05 |
| load |
8 |
−0.827 |
3.81E-10 |
0.0102 |
1.24E-05 |
| Dimethyl Disulfide |
9 |
−0.827 |
0.0002 |
0.8730 |
0.1110 |
| 2-Methyl-1-Propanol |
10 |
0.738 |
0.0031 |
0.0814 |
0.0079 |
| Met |
10 |
0.706 |
0.0057 |
0.5805 |
0.5473 |
| Hexanal |
11 |
0.717 |
0.0025 |
0.0047 |
0.2032 |
| Styrene |
16 |
−0.710 |
0.0096 |
0.1871 |
0.0334 |
| Xylene |
16 |
−0.767 |
0.0030 |
0.1046 |
0.0021 |
| 1,3-Dichlorobenzene |
20 |
−0.746 |
0.0083 |
0.3799 |
0.0481 |
| Galactose |
20 |
−0.811 |
7.75E-09 |
2.16E-01 |
7.98E-04 |
| GABA |
21 |
0.915 |
1.10E-06 |
0.0334 |
3.84E-05 |
| Maltose |
21 |
0.734 |
6.58E-07 |
2.85E-02 |
1.41E-03 |
| 3-Methylpyridine |
21 |
−0.763 |
0.0034 |
0.1312 |
0.0038 |
| Malic acid |
21 |
−0.775 |
4.53E-05 |
0.0184 |
0.0006 |

Patterns 1 to 3 correspond to components where the mixing stage mainly influences the amount of chemical component detected in the crumb. Only one component fell into this group. Figure 2A shows the pattern of heptanal, and it can clearly be seen that the longer the mixing time, the higher the amount detected in the crumb. Aldehydes such as heptanal are produced by fatty acid oxidization as well as by microbial metabolism in the dough (Wood 1998), and oxidization of fatty acids could be enhanced with longer mixing times.
Patterns 4 to 6 correspond to components where the fermentation time mainly influences the amount of the chemical component. Most of the components were highly correlated to pattern 4, where the amounts increase or decrease simultaneously with fermentation time. The first four chemical values (above the dotted line) not only differed significantly with fermentation time, but also with mixing time (pmixing < 0.01). Figure 2B shows the pattern of 2-methyl-propanoic acid measured with GC/MS. 2-Methyl-propanoic acid clearly increased when fermentation time was 300 min. Octanoic acid ethyl ester, phenylethyl alcohol, and hexanoic acid ethyl ester showed similar trends.
The components shown below the dotted line are not significantly different between mixing times, and are only influenced by fermentation time. Figure 2C shows serine as a typical component that is negatively correlated with fermentation time. Most of the amino acids, namely glutamine, cystathionine, lysine, citrulline, arginine, glycine, histidine, tryptophan and threonine, were negatively correlated with fermentation time, due to their consumption by yeast during fermentation. Alanine (Fig. 2D), phenylalanine, tyrosine, valine, aspartic acid, and glutamic acid were also negatively correlated with fermentation time, but because the minimum value occurred with a fermentation time of 120 min, they showed highest correlation to pattern 5. The concentration of amino acids depends on two factors: increases are due to proteolytic enzymes in the wheat flour, and decreases are due to assimilation by yeast. During the exponential growth phase of microorganisms at the beginning of fermentation, yeast assimilation occurs faster, causing an overall decrease of amino acids (Collar, et al. 1992, Thiele, et al. 2002). It is suggested that with 300-min fermentation, the growth of yeast cells enters the stationary phase, and the enzymatic break down of proteins in the wheat leads to an increase of these amino acids. The pattern of ornithine was positively correlated with pattern 6, meaning that it first increased until 30 min of fermentation, and then decreased with longer fermentation times. Conversely, proline and taurine were negatively correlated with pattern 6.
It is noteworthy that while succinic, lactic, and citric acids increased with longer fermentation times, ascorbic acid decreased significantly. Lactic acid is produced by lactic acid bacteria naturally present in flour and yeast (Takeda, et al. 1984), and citric acid is a typical product of fermentation (Theron and Lues 2011). Ascorbic acid, which is sometimes added as a dough improver, has been shown to degrade through the dough manufacturing process (Nakamura and Kurata 1997), and this is thought to be the reason for its decrease.
Five types of sugars, xylose, mannose, fructose, sucrose and glucose, also had a negative correlation to pattern 4, meaning that the amount of sugars decreased with fermentation time. Conversely, many flavor compounds such as alcohols (ethanol, 2-methyl-1-propanol, 3-methyl-1-butanol, 2-methyl-1-butanol), ketones (2,3-pentanedione, 3-methyl-2-butanone), esters (ethyl acetate), aldehydes (2-butenal, benzene acetaldehyde), and carboxylic acids (2-methylbutanoic acid, 3-methylbutanoic acid) increased with fermentation time. This is understandable, since the sugars are consumed by the yeast during fermentation and are metabolized into a variety of flavor compounds.
Pattern 5 is interesting because it shows a maximum or minimum value at a fermentation time of 120 min, which is the time used in the standard manufacturing process. A compound known for its “butter” flavor, 2,3-butanedione showed a maximum value at 120 min. This compound is formed during the fermentation process and in the Maillard reaction (Jensen, et al. 2011).
Figure 2E shows the pattern of decanoic acid, which shows maximum correlation (negative) to pattern 6 and is minimized when fermented for 60 min. The amino acids proline and taurine, and 3-methyl-1-butanol show similar trends, and as can be seen from Fig. 2E, these components increased dramatically with 300-min fermentation.
Components that have a high correlation with patterns 7 to 22 are influenced both by mixing and fermentation times. Figure 2F shows the pattern for lactose. Maltose (Fig. 2G) showed a similar pattern, with high values in the pickup stage, and low values when fermented for 300 min. The reason for this may be the low level of hydration and low temperature of the dough at the pickup stage, due to the low energy input through mixing. Since maltose and lactose are only consumed by the yeast after other sources of sugars, such as glucose and sucrose, are depleted (Maloney and Foy 2003), they seem to be most affected by mixing, and the amount remaining in the bread mixed to the pickup stage was larger than in the other mixing stages. Galactose (Fig. 2H) also increased slightly in the pickup stage, but showed opposite trends in terms of fermentation time, with larger amounts found in the dough fermented for 300 min. Galactose is produced from the breakdown of lactose, and this may be the reason for its increase during fermentation.
Figure 2I shows the pattern for the load in the compression test. The load was lowest (the crumb was softest) when the dough was mixed to the final stage and fermented for 300 min, and became higher (the crumb becomes tougher) as mixing and fermentation times became shorter. Over-mixing and fermenting for 120 min produced low values that were comparative to the minimum value. One of the goals of mixing is to create a three-dimensional gluten network capable of holding the gas created during fermentation and baking, resulting in bread with a porous and soft crumb (Chin, et al. 2005). Fermentation not only produces the CO2 gas that creates the porous structure, but has a similar function to mixing by stretching the dough around the bubbles, helping to develop the gluten matrix (Tlapale-Valdivia, et al. 2010). Therefore, it is understandable that longer mixing and fermentation times generally created softer breads.
Finally, Fig. 2J shows the pattern for 2-methyl-1-propanol, which showed the highest correlation to pattern 10, and was maximized when mixed to the pickup stage and fermented for 300 min. Higher alcohols, such as 2-methyl-1-propanol, 3-methyl-1-butanol and 2-methyl-1-butanol, are produced during the fermentation process.
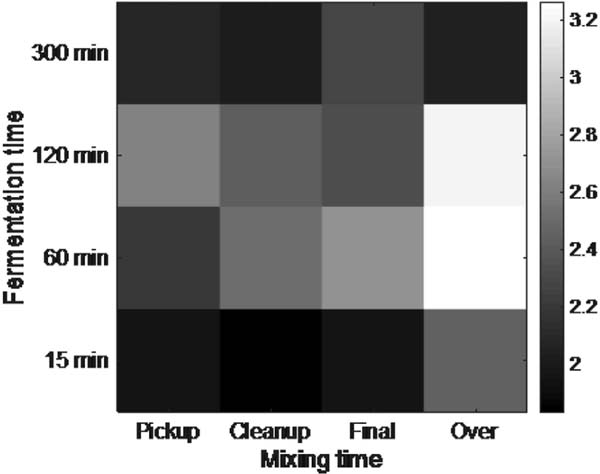
Effects of mixing and fermentation times on sensory evaluation Figure 3 shows the 2D mixing-fermentation pattern for the sensory evaluation that tested for “overall preference”. The pattern showed the highest correlation to pattern 15, with a correlation coefficient of 0.55 and ppattern = 1.53E-09. Pattern 15 shows a maximum value with the combination of over-mixing and 60 min of fermentation. Results of two-way ANOVA showed that sensory evaluation results were influenced mainly by fermentation time (pmixing = 0.058, pfermentation = 0.0078). Although the dough is mixed to the final mixing stage and fermented for 120 min in the standard manufacturing process, mixing for longer times and fermenting for a shorter period produced breads with higher preference. However, it should be noted that breads that were mixed to the over-mixing stage and fermented for 120 min also showed high values in the sensory evaluation. In addition, there was a general trend that longer fermentation times (with the exception of 300 min) were preferred for breads that were mixed for a short time.
None of the chemical and physical measurements showed high correlation to the sensory evaluation pattern (pattern 15), indicating that maximizing or minimizing a particular constituent or physical value would not lead to overall preference. In particular, the panel showed low preference for all samples fermented for 300 min, which may be because of the multiple flavor and taste compounds that increased during the long fermentation time.
Conclusions
Of all the physical and chemical properties measured, the majority were influenced mainly by fermentation time, rather than by mixing time and energy. However, many properties were influenced both by mixing and fermentation times, e.g., some sugars and compression load. For these parameters, similar effects were observed between prolonged mixing and fermentation times.
Many chemical components showed a minimum or maximum value in the dough with the longest fermentation time. However, overall preference in the sensory evaluation was the highest in the bread mixed to the over-mixing stage and fermented for 60 min or 120 min, and preference significantly decreased when the dough was fermented for 300 min. This shows that maximizing or minimizing a particular chemical component or physical value does not result in high preference. The results of this study are expected to be of importance in controlling the flavor, taste, and texture of white pan bread.
References
- AACC International. (1999). Approved methods of analysis. AACC Method 74-10A, Measurement of Bread Firmness-Compression Test (November 3, 1999)
- Bell, P. J. L., Higgins, V. J., and Attfield, P. V. (2001). Comparison of fermentative capacities of industrial baking and wild-type yeasts of the species saccharomyces cerevisiae in different sugar media. Lett. Appl. Microbiol., 32, 224-229.
- Benedito de Barber, C., Prieto, J. A., and Collar, C. (1989). Reversed-phase high-performance liquid chromatography analysis of changes in free amino acids during wheat bread dough fermentation. Cereal Chem., 66, 283-288.
- Brady, P. L. and Mayer, S. M. (1985). Correlations of sensory and instrumental measures of bread texture. Cereal Chem., 62, 70-72.
- Chen, C. H. and Bushuk, W. (1970). Nature of proteins in triticale and its parental species: I. Solubility characteristics and amino acid composition of endosperm proteins. Can. J. Plant Sci., 50, 9-14.
- Chin, N. L. and Campbell, G. M. (2005). Dough aeration and rheology: Part 2. Effects of flour type, mixing speed and total work input on aeration and rheology of bread dough. J. Sci. Food Agric., 85, 2194-2202.
- Chin, N. L., Martin, P. J., and Campbell, G. M. (2005). Dough aeration and rheology: Part 3. Effect of the presence of gas bubbles in bread dough on measured bulk rheology and work input rate. J. Sci. Food Agric., 85, 2203-2212.
- Cleemput, G., Booij, C., Hessing, M., Gruppen, H., and Delcour, J. A. (1997). Solubilisation and changes in molecular weight distribution of arabinoxylans and protein in wheat flours during bread-making, and the effects of endogenous arabinoxylan hydrolysing enzymes. J. Cereal Sci., 26, 55-66.
- Collar, C., MascarÓS, A. F., and De Barber, C. B. (1992). Amino acid metabolism by yeasts and lactic acid bacteria during bread dough fermentation. J. Food Sci., 57, 1423-1427.
- Curic, D., Novotni, D., Skevin, D., Rosell, C. M., Collar, C., Le Bail, A., Colic-Baric, I., and Gabric, D. (2008). Design of a quality index for the objective evaluation of bread quality: Application to wheat breads using selected bake off technology for bread making. Food Res. Int., 41, 714-719.
- Frasse, P., Lambert, S., Levesque, C., Melcion, D., Richard-Molard, D., and Chiron, H. (1992). The influence of fermentation on volatile compounds in french bread crumb. Lebens. Wiss. Technol., 25, 66-70.
- Fuke, S. and Konosu, S. (1991). Taste-active components in some foods: A review of japanese research. Physiol. Behav., 49, 863-868.
- Ishibashi, N., Ono, I., Kato, K., Shigenaga, T., Shinoda, I., Okai, H., and Fukui, S. (1988). Role of the hydrophobia amino acid residue in the bitterness of pep tides&dagger. Agric. Biol. Chem., 52, 91-94.
- Jensen, S., Oestdal, H., Skibsted, L. H., Larsen, E., and Thybo, A. K. (2011). Chemical changes in wheat pan bread during storage and how it affects the sensory perception of aroma, flavour, and taste. J. Cereal Sci., 53, 259-268.
- Kokawa, M., Fujita, K., Sugiyama, J., Tsuta, M., Shibata, M., Araki, T., and Nabetani, H. (2012). Quantification of the distributions of gluten, starch and air bubbles in dough at different mixing stages by fluorescence fingerprint imaging. J. Cereal Sci., 55, 15-21.
- Ktenioudaki, A., Butler, F., and Gallagher, E. (2010). The effect of different mixing processes on dough extensional rheology and baked attributes. J. Sci. Food Agric., 90, 2098-2104.
- Maeda, T., Kimura, S., Araki, T., Ikeda, G., Takeya, K., and Sagara, Y. (2009). The effects of mixing stage and fermentation time on the quantity of flavor compounds and sensory intensity of flavor in white bread. Food Sci. Technol. Res., 15, 117-126.
- Maloney, D. H. and Foy, J. J. (2003). Yeast fermentations. In “Handbook of dough fermentations” ed. by K. Kulp, and K. Lorenz. Marcel Dekker, Inc., New York, U.S.A., pp.
- Moore, M. M., Schober, T. J., Dockery, P., and Arendt, E. K. (2004). Textural comparisons of gluten-free and wheat-based doughs, batters, and breads. Cereal Chem., 81, 567-575.
- Nakamura, M. and Kurata, T. (1997). Effect of l-ascorbic acid on the rheological properties of wheat flour-water dough. Cereal Chem., 74, 647-650.
- Paredeslopez, O. and Bushuk, W. (1983). Development and undevelopment of wheat dough by mixing - microscopic structure and its relations to bread-making quality. Cereal Chem., 60, 24-27.
- Seabourn, B. W., Xie, F., and Chung, O. K. (2008). Rapid determination of dough optimum mixing time for early generation wheat breeding lines using ft-hatr infrared spectroscopy. Crop Sci., 48, 1575-1578.
- Takeda, T., Okada, S., and Kozaki, M. (1984). Characteristics of lactic acid bacteria isolated from bread-dough, compressed-yeast and active dry-yeast. J. Jpn. Soc. Food Sci. Technol. (Nippon Shokuhin Kogyo Gakkaishi), 31, 642-648 (in Japanese).
- Theron, M. M. and Lues, J. F. R. (2011). “Organic acids and food preservation” CRC Press, U.S.A.
- Thiele, C., Gänzle, M. G., and Vogel, R. F. (2002). Contribution of sourdough lactobacilli, yeast, and cereal enzymes to the generation of amino acids in dough relevant for bread flavor. Cereal Chem., 79, 45-51.
- Tkachuk, R. (1965). Amino acid composition of wheat flours. 207-223
- Tlapale-Valdivia, A. D., Chanona-Perez, J., Mora-Escobedo, R., Farrera-Rebollo, R. R., Gutierrez-Lopez, G. F., and Calderon-Dominguez, G. (2010). Dough and crumb grain changes during mixing and fermentation and their relation with extension properties and bread quality of yeasted sweet dough. Int. J. Food Sci. Technol., 45, 530-539.
- Wiseblatt, L. and Zoumut, H. F. (1963). Isolation, origin, and synthesis of a bread flavor constituent. Cereal Chem., 40, 162-169.
- Wood, B. J. B. (1998). “Microbiology of fermented foods.” Blackie Academic and Professional, London.
- Yang, C. H. (2006). Fermentation. In “Bakery products - science and technology” ed. by Y. H. Hui. Blackwell Publishing, Iowa, USA, pp. 261-272.
- http://www.stat.go.jp/english/data/kakei/index.htm (December. 3. 2015)
- http://www.jfrl.or.jp/bunsekiflow/files/047.pdf (June. 26. 2016)

