Original papers
Combined Effect of Microwave and Steam Cooking on Phytochemical Compounds and Antioxidant Activity of Purple Sweet Potatoes
2017 Volume 23 Issue 2 Pages 193-201
Details
2017 Volume 23 Issue 2 Pages 193-201
This study evaluates the effects of a microwave and steam cooking combination on the sugar composition, phytochemical compounds (total phenolics, total flavonoids, total anthocyanins and phenolic acids and anthocyanin compositions) and antioxidant capacity of purple sweet potatoes (PSPs). The combination of microwave and steam cooking could significantly decrease the cooking time. The results show an obvious increase in the quantity of total phenolics, flavonoids, and anthocyanins in PSPs after cooking. The microwave and steam cooking combination induced the greatest increase for the total flavonoids and total phenolics, with values of 22.2% and 26%, respectively. Among the phenolic acids in the PSP extract, chlorogenic acid was the major constituent, and phenolic acid concentrations increased after cooking, except for caffeic acid. An HPLC-MS analysis of anthocyanin showed that the cyanidin-3-(6″-caffeoyl-6″′-feruloylsophoroside) -5-glucoside and peonidin-3-(6″-caffeoyl-6″′-feruloylsophoroside)-5-glucoside contents in PSPs cooked with steaming for 10 min followed by microwaving for 3 min (S10 − M3) were highest among the cyanidin and peonidin compounds. The PSPs exhibited a greater antioxidant capacity after cooking, and the S10 − M3 cooking method produced the greatest antioxidant capacity. Therefore, an appropriate combination of microwave and steam cooking can better retain phytochemical compounds in PSPs and increase antioxidant capacity compared with only steaming or microwaving.
Potatoes are the fourth most crucial crop in the world after rice, wheat and maize and are a good source of dietary energy, carbohydrates and bioactive compounds, including anthocyanins, flavonoids and phenolic compounds (Blessington et al., 2010; Giusti et al., 2014; Tierno et al., 2015). Previous studies have shown that purple sweet potatoes (PSPs) exhibit strong antioxidant activity and an anti-mutagenic capacity, and they clearly decrease high blood pressure and liver injury (Kim et al., 2015; Truong et al., 2012). Considerable research on PSP has quantified the antioxidant activity as well as phenolic acid and anthocyanin compositions for various cultivars or after different cooking treatments (Kita et al., 2013; Lemos et al., 2015; Perla et al., 2012). A study performed by Lemos et al. (2015) showed the total phenolic and anthocyanin quantities as well as antioxidant activity in potatoes increased after steaming and microwaving. In addition, baking, frying and microwaving increase antioxidants as well as the carotenoid and total phenolic content in potato according to Blessington et al. (2010). However, Perla et al. (2012) reported that the total phenolics, flavonoids, anthocyanins and antioxidant activity in potatoes were significantly reduced by a microwave treatment.
Steaming and microwaving are two main household cooking methods with different characteristics. These cooking processes produce a number of changes in the physical characteristics and chemical composition of food (Turkmen et al., 2005). Although steaming usually takes over a long time period, its advantages include uniform heat distribution and an enhanced water-retaining capacity after cooking. Further, microwave treatments have also become popular in food processing due to high heating rates and shorter cooking times (S. Chandrasekaran, 2013). However, microwave heating often yields serious water loss during cooking. In addition, nonuniform heating is the largest issue in microwave processing, which can affect the palatability of cooked food. Considering the aforementioned phytochemical compounds and physical changes caused by current cooking techniques, individual steaming and microwaving methods cannot meet consumers' needs, such as sensory quality, nutrition and time saving. The combination of steaming and microwaving as a new cooking method can incorporate the advantages of steaming and microwaving but decrease the disadvantages.
Although the sensory quality and phytochemical compounds in PSPs cooked using different methods have been published, data about the effects of combination steaming and microwaving on PSP's phytochemical compounds and antioxidant activity remain unclear. Therefore, the aims of this study were (1) to investigate the effect of an intermittent combination steam and microwave cooking on chemical composition (reducing sugars and soluble sugars), phytochemical compounds (total phenolics, total flavonoids, phenolic acids and anthocyanins), and antioxidant capacity and (2) to compare the effects of the combination with only steaming or microwaving on phytochemical compounds preservation.The present study will provide useful information for developing new cooking machinery with intelligent cooking programs to improve the cooking quality and to save time.
Materials Purple sweet potatoes (Dphi potato 1, Wuxi, Jiangsu) with individual weights of approximately 80 g and with similar shapes (length: 7 – 8 cm, diameter: 3 – 4 cm) were purchased from a local market (Wuxi Jiangsu Province) and stored in a cool and dark environment.
Vanillic acid and cyanidin-3-o-gluctose were provided by J&K Scientific Ltd (China). Tans-p-coumaric acid, caffeic acid and p-hydroxy-benzoic acid were purchased from Tokyo Chemical Industry. Chlorogenic acid, fructose, fructose, maltose, and sucrose were provided by Sigma-Aldrich.
Cooking techniques The PSPs were cleaned using tap water and divided into five groups. Cooking was performed using a microwave and steaming box (Fotile ZW-D1, Ningbo Zhejiang Province) and different procedures as follows: (1) steaming (100°C) for 30 min (S30); (2) microwaving (800 W) for 2 min followed by steaming (100°C) for 15 min (M2 − S15); (3) steaming for 10 min followed by microwaving for 3 min (S10 − M3); (4) microwaving for 5 min (M5); and (5) raw PSP. Each cooking procedure was performed in triplicate.
The duration of each cooking procedure was previously determined based on tenderness evaluated by stabbing the potato with a chopstick (Lemos et al., 2015; Tian et al., 2016). After cooking the PSPs, each group of cooked PSPs was freeze dried, ground into powder and stored at −18°C for further analyses.
Water content, cooking loss and Hardness Water content in each group of sample was determined by drying approximately 3 g of sample at 105°C to a constant weight (AOAC, 1998).
The determination of cooking loss and texture was according to (Xu et al., 2016). The hardness of different cooked PSPs was measured by texture analysis. And the method of texture analysis was slightly modified. PSPs were cut to the same thickness about 1 cm. TA.XTPlus texture analyser (Stable Micro Systems, Surrey, UK) equipped with a cylindrical P/36 probe of 36 mm in diameter was used.
Total phenolics and flavonoids analysis One gram of dried powder was extracted with 25 mL of a solution of 85% methanol and 15% 1 M hydrochloric acid (v / v) using a previously described method (Hosseinian et al., 2008) with slight modifications. The tube was then shaken using a vortex shaker for 90 s, sonicated for 30 min, and then centrifuged (5000 g) for 15 min. The remaining pellet was re-extracted as previously described. The combined supernatants were stored at 4°C until the total phenolics and flavonoids were analysed within 24 h.
The total phenolic levels of the PSPs were determined using the Folin–Ciocalteau colorimetric method (Li et al., 2012). The total phenolic compound concentration was expressed as grams gallic acid equivalents per 100 g of dried PSP.
The flavonoid content was determined based on Barakat and Rohn (2014). The total flavonoids content was expressed as milligrams of rutin equivalents per 100 g dried PSP.
Reducing sugars and soluble sugars analysis The reducing sugars were extracted using 80% ethanol and according to the method of Zhou et al. (2015). The reducing sugar content was determined using the DNS method as described by Ansari et al. (2015).
Soluble sugar composition analysis To extract the soluble sugars, PSP powder (0.1 g) was extracted with 25 mL of distilled water for 45 min at 60°C and then centrifuged (15 min, 5000 g) in accordance with Gangola et al. (2014). The extraction procedure was repeated twice. The supernatant was filtered through 0.22 µm organic membrane filters and used for chromatographic analyses in accordance with the method of Kami et al. (2011). Glucose, fructose, sucrose and maltose concentrations were quantified using an HPLC equipped with a Waters Sugar-Pak1 column (300 mm × 7.8 mm) and a differential refractive index detector.
Phenolic acids analysis The phenolic acids were extracted in accordance with the procedure from León-González et al. (2013) with some modifications. One gram of dried powder was extracted with acetone/water/formic acid (70:29.5:0.5, v/v/v) in an ultrasonic bath at room temperature for 45 min. The homogenates were then centrifuged at 10000 g for 10 min. The residue was extracted again under the same conditions. The supernatants were combined and evaporated to dryness at 40°C. The residue was reconstituted with 10 mL methanol and then centrifuged (10 min, 10000 g). The supernatant was used for HPLC analyses.
The phenolic acids were identified and quantified using an Agilent series 1100 HPLC instrument with a reverse-phase C18 column (Waters, 4.6 mm × 250 mm) and UV detector. The mobile phase consisted of 0.1% formic acid (A) and acetonitrile (B). The elution gradient began at 3% B in A to reach 5% at 10 min, 15% at 35 min, 20% at 40 min, 40% at 55 min, 60% at 63 min, and 3% at 65 min to return to the initial conditions. The phenolic acids, including trans-p-coumaric acid, chlorogenic acid, vanillic acid, caffeic acid and p-hydroxy-benzoic acid, were detected at 280 nm and were quantified by comparing the retention time and peak areas for the extracts with related standard phenolic acids.
Anthocyanins analysis The PSP anthocyanins were extracted using the same procedure as that of the total phenolics and flavonoids described above. The obtained extract using acidified methanol was evaporated to dryness at 40°C and redissolved in methanol. The extracts were centrifuged (10000 g, 10 min) and stored at 4°C until the anthocyanins were analysed using LC-MS. The anthocyanin analyses were performed using an AQUITY UPLC (Waters, USA) equipped with a PAD (photo diode array detector) and a QT/MS (quadrupole time of flight mass spectrometer, Waters Maldi Synapt, USA). The column used was a 2.1 mm × 100 mm C18 column (BEH, Waters, USA). Solvent A was formic acid/water (0.1: 99.9), and solvent B was acetonitrile. The solvent gradient described in Kita et al. (2013) was used. Mass spectra in the m/z range of 20 to 2000 were obtained through electrospray ionization in the positive-ion mode. Each individual anthocyanin was quantified using cyanidin-3-O-glucoside as an internal standard in accordance with Kim et al. (2012).
Antioxidant capacity analysis The antioxidant capacity of PSP was measured using DPPH, ABTS+ and FRAP assays. The extraction procedure was the same as for the reducing sugars.
DPPH radial scavenging activity The DPPH method was used in accordance with a published procedure (Hamrouni-Sellami et al., 2012). The DPPH radical scavenging activity (RSA) was calculated using the following equation:
 |
FRAP The FRAP assay was performed in accordance with Li et al. (2012). The FRAP was expressed as FeSO4 equivalent per gram dried PSP.
ABTS+ assay For the ABTS assay, the method described by Ravichandran et al. (2012) was adopted. The radical scavenging activity of the extract was calculated as follows:
 |
A0 is the absorbance of ABTS and distilled water, and A1 is the absorbance for the ABTS and extracts. All of the samples were determined in triplicate.
Statistical Analysis The results are expressed as the mean ± standard deviation (SD). Statistical analyses were performed using SPSS 11.0 (SPSS Inc., Chicago, IL., USA). One-way analysis of variance and Duncan's multiple range test were employed to compare group means with significant differences at p < 0.05.
Water content, cooking loss and Hardness The variations in water content, cooking loss and hardness of cooked PSPs with different methods were summarized in Table 1. The cooking loss depends on the mass transfer due to thermal treatment. And the difference of water content in cooked PSPs was mainly caused by the cooking loss. From the Table 1, the change of water content was similar to the cooking loss. The smallest water content was found in PSPs of M2 − S15 and S30. From the results of hardness, there is no significant difference among different treatments.
| Treatment | Water content (%) | Cooking loss (%) | Hardness (g) |
|---|---|---|---|
| Raw | 63.88±0.17b | 0 | ---- |
| S30 | 62.07±0.23b | 0.742±0.072a | 2919.27±258.22a |
| M2 − S15 | 62.35±0.20b | 0.624±0.083a | 3035.11±413.93a |
| S10 − M3 | 60.06±0.22a | 7.886±0.205b | 3126.08±241.77a |
| M5 | 59.74±0.25a | 8.107±0.701b | 2861.10±375.36a |
Data are expressed as the mean ± SD, n=3.
Mean values of each column followed by different superscript letter significantly differ when subjected to Tukey's multiple range test (p < 0.05).
Total phenolics and flavonoids As shown in Table 2, the total phenolics and flavonoids content in the PSPs varied depending on the cooking treatment. Compared with raw PSPs, most cooking methods increased the total phenolics and flavonoids content to various levels. These data are consistent with a previous study by Lemos et al. (2015).
| Treatment | Total phenolic (mg/g DW) | Total flavonoids (mg/g DW) |
|---|---|---|
| Raw | 5.17±0.02a | 13.48±0.13a |
| S30 | 5.28±0.04a | 13.61±0.36a |
| M2 − S15 | 6.32±0.01c | 15.46±0.14b |
| S10 − M3 | 5.81±0.04b | 16.98±0.48c |
| M5 | 5.20±0.40a | 15.49±0.52b |
Data are expressed as the mean ± SD, n=3.
The total phenolics increased significantly (p < 0.05) after cooking except for M5. This observation may be attributed to polyphenol oxidase inactivation during cooking, which aids in protecting against polyphenol degradation (Chuah et al., 2008). On the other hand, higher total phenolics in cooked PSPs may also be due to improved phenolic compound extraction from the cellular matrix of the cooked sample (Blessington et al., 2010). The total flavonoids in PSPs also increased to various levels. Furthermore, the total flavonoids content in the M2 − S15 and S10 − M3 cooking combinations were higher than those in the steamed-only or microwaved-only samples. This observation may be due to the long steaming time and intense microwave heat, which may destroy the structure of the flavonoids. The microwave-only cooking method exhibited lower levels of flavonoids and total phenolics than those on other cooking methods.
The different cooking methods yielded different polyphenol and flavonoid levels in the PSP extracts. This finding is consistent with a previous study (Thi and Hwang, 2015), which found that steaming produced higher polyphenol and flavonoid levels compared with raw spinach. The results show that the microwave and steam combination cooking technique is superior to using only steaming or microwaving. The increase in polyphenol and flavonoid levels may be related to the shorter steaming and microwaving times.
Reducing sugar and soluble sugar The effects of cooking methods on the reducing sugar and the soluble sugar composition in PSPs are summarized in Table 3. Compared with raw PSPs, cooking significantly increased the content of reducing sugar. The highest reducing sugar content was observed in steamed PSPs followed by microwaving and steaming combined. The microwaved PSPs exhibited the fewest reducing sugars among the cooked PSPs. The reducing sugar concentrations exhibited a significant increasing trend with an increase in heating time. The heat used during the cooking process could lead to polysaccharide hydrolysis and subsequent sugar release (Barros et al., 2007).
| Treatment | Reducing sugar (g/100 g DW) | Glucose (g/100 g DW) | Fructose (g/100 g DW) | Maltose (g/100 g DW) | Sucrose (g/100 g DW) |
|---|---|---|---|---|---|
| Raw | 5.70±0.06a | 2.33 | 2.27 | 0 | 10.31 |
| S30 | 31.34±0.57d | 2.04 | 2.37 | 22.3 | 9.88 |
| M2 − S15 | 27.83±1.65c | 1.82 | 2.24 | 18.17 | 10.69 |
| S10 − M3 | 27.88±0.81c | 2.03 | 2.19 | 17.01 | 10.64 |
| M5 | 17.76±0.33b | 2.36 | 2.92 | 10.23 | 10.32 |
Data are expressed as the mean ± SD, n=3.
Mean values of each column followed by different superscript letter significantly differ when subjected to Tukey's multiple range test (p < 0.05). DW: dry weight.
As shown in Table 3, fructose, maltose and glucose were the main reducing sugars in PSPs. The total sugar concentration was higher than the reducing sugars because sucrose, a nonreducing sugar, is also present in PSP. The glucose, fructose, maltose and sucrose quantities slightly increased using the microwave. Steaming exhibited the same trend for the sugars, except for sucrose. Compared with raw PSPs, the reducing sugar and soluble sugar content mostly improved after cooking through microwaving and steaming. This observation is consistent with the results from Xu et al. (2014).
Notably, heating could induce hydrolysis of starch into maltose. Steaming yielded a slight loss of glucose (14.4%) and sucrose (4.17%), similar to the finding by Volden et al. (2008). The S10 − M3 and M2 − S15 combination cooking methods produced comparative levels of fructose, sucrose and glucose.
Composition of phenolic acid The effects of the cooking methods on PSP phenolic acid content are shown in Table 4. The phenolic acid content in PSP differed with different treatments. Chlorogenic acid is the primary constituent in cooked PSP followed by p-hydroxybenzoic acid and vanillic acid. However, caffeic acid and trans-p-coumaric acid were only present at trace levels in cooked PSPs.
| Treatment | Chlorogenic acid (mg/100 g DW) | P-hydroxybenzoic acid (mg/100 g DW) | Vanillic acid (mg/100 g DW) | Caffeic acid (mg/100 g DW) | Trans-p-coumaric acid (mg/100 g DW) |
|---|---|---|---|---|---|
| Raw | 176.67 | 11.34 | 1.98 | 2.19 | 5.04 |
| S30 | 206.62 | 18.49 | 31.32 | 2.16 | 9.40 |
| M2 − S15 | 270.27 | 17.33 | 33.95 | 2.02 | 8.40 |
| S10 − M3 | 305.89 | 12.72 | 32.21 | 2.05 | 9.82 |
| M5 | 239.41 | 13.42 | 22.60 | 1.89 | 9.82 |
DW: dry weight.
Physical and biological factors such as temperature, pH and levels enzymatic activity, caused destruction of phenolic compounds (Ravichandran et al., 2012). On the other hand, certain studies have reported that food processing also exerts certain positive effects that increase phenolic compounds (Burgos et al., 2013). All of the phenolic acids increased after cooking, except caffeic acid, which is similar to a previous study (Mazzeo et al., 2011). Phenolic acids were mainly present in the bound form, linked to cell-wall structural components. Food processing, such as thermal processing, fermentation and freezing, contributed to release of these bound phenolic acids (Ravichandran et al., 2012). After cooking, the chlorogenic acid in the PSPs increased from 16.8% to 73.14%. The PSPs cooked with S10 − M3 exhibited the highest chlorogenic acid content. Trans-p-coumaric acid showed an approximate 2-fold increase after cooking. P-hydroxybenzoic acid and vanillic acid content also generally increased after cooking. These results were due to an inactive polyphenol oxidase and disrupted plant cell walls, which provided better extractability (Lachman et al., 2012). In addition, Blessington et al. (2010) suspected that during cooking, phenolic compounds migrate from the peel to both the cortex and internal tissue of the potato. It is noted that caffeic acid concentration slightly decreased after cooking, which might be due to thermal processing. The results clearly indicate that steaming and microwaving can better release phenolic acids from the potato matrix. Moreover, the microwaving and steaming combination exhibited beneficial changes in the content of most phenolic acids, which is similar to the result found with only steaming alone.
Anthocyanin composition The structures of the main anthocyanins in PSPs are summarized in Figure 1. When analysed in positive-ionization mode, the chemical structures of the individual anthocyanins were confirmed using data from a fragment pattern analysis (Table 5). The anthocyanin mixture mainly contained diacylated anthocyanin acylated with caffeic (m/z 162), ferulic (m/z 172) and p-hydroxybenzoic acids (m/z 120). Nearly all mass spectra data show that the PSP anthocyanins were anthocyanin glycosidic conjugates. Furthermore, the major anthocyanin glycosylations were glucoside (m/z 162) and sophororside (m/z 324)(Kim et al., 2012). Two types of anthocyanins were present, cyanidin (m/z 287) and peonidin (m/z 301). This finding is consistent with Montilla et al. (2010). The anthocyanin composition and content analysed using LC-MS are also shown in Table 4. The types of anthocyanin in PSPs were identified based on previous data (Kim et al., 2012; Montilla et al., 2010).
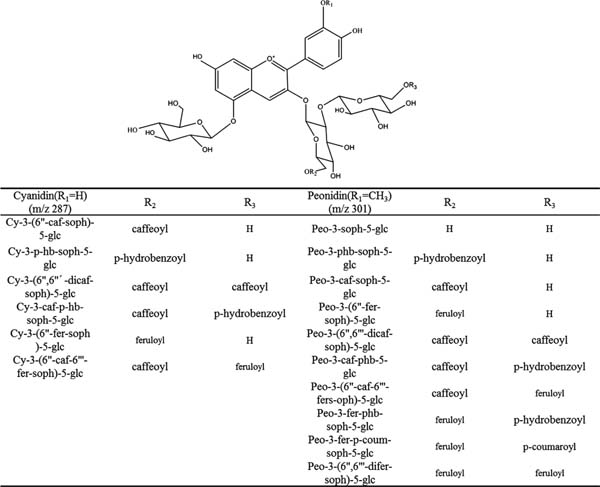
Chemical structures of the major anthocynins identified in PSP extracts using HPLC-MS. Abbreviations used: Cy, cyanidin; Peo, peonidin; soph.
| Retention time (min) | Anthocyanins | Molecular ion [M+] (m/z) | Fragment ions (m/z) | Treatment (content mg/100 g DW) | ||||
|---|---|---|---|---|---|---|---|---|
| Raw | S30 | M2 − S15 | S10 − M3 | M5 | ||||
| 7.24 | Peo-3-soph-5-glc | 787 | 625 463 301 | 21.33 | 30.88 | 25.69 | 25.99 | 32.4 |
| 8.54 | Cy-3-p-hb-soph-5-glc | 893 | 731 449 287 | 3.42 | 4.01 | 3.08 | 2.86 | 3.47 |
| 10.45 | Peo-3-p-hb-soph-5-glc | 907 | 745 463 301 | 11.75 | 12.38 | 10.65 | 12.98 | 12.85 |
| 10.59 | Unidentified | 937 | 775 463 301 | 2.75 | 2.19 | 3.05 | 3.06 | 3.19 |
| 10.72 | Peo-3-caf-soph-5-glc | 949 | 787 463 301 | 1.27 | 1.2 | 1.92 | 1.58 | 1.82 |
| 11.21 | Cy-3-(6″-fer-soph)-5-glc | 949 | 787 449 287 | 11.94 | 12.01 | 12.93 | 11.92 | 13.83 |
| 12.94 | Peo-3-(6″-fer-soph)-5-glc | 963 | 801 463 301 | 26.53 | 29.01 | 29.20 | 28.34 | 29.99 |
| 13.47 | Cy-3-(6″-caf-soph)-5-glc | 935 | 773 449 287 | 22.18 | 24.62 | 20.31 | 24.82 | 23.5 |
| 13.67 | Cy-3-(6″,6″′-dicaf-soph)-5-glc | 1097 | 935 449 287 | 4.27 | 4.31 | 4.02 | 3.81 | 3.59 |
| 13.84 | Cy-3-caf-p-hb-soph-5-glc | 1055 | 893 449 287 | 10.34 | 10.33 | 11.13 | 10.5 | 9.81 |
| 14.93 | Cy-3-(6″-caf-6″′-fer-soph)-5-glc | 1111 | 949 449 287 | 137.45 | 158.46 | 166.66 | 184.46 | 152.53 |
| 15.50 | Peo-3-(6″,6″′-dicaf-soph)-5-glc | 1111 | 949 463 301 | 21.78 | 23.93 | 27.73 | 27.6 | 23.85 |
| 15.74 | Peo-3-caf-phb-5-glc | 1069 | 907 463 301 | 53.72 | 63.03 | 59.30 | 67.27 | 53.84 |
| 16.74 | Peo-3-(6″-caf-6″′-fer-soph)-5-glc | 1125 | 963 463 301 | 120.02 | 121.02 | 138.63 | 142.61 | 125.85 |
| 17.98 | Peo-3-fer-p-hb-soph-5-glc | 1083 | 921 463 301 | 2.23 | 2.13 | 2.17 | 2.07 | 1.84 |
| 18.55 | Peo-3-fer-p-coum-soph-5-glc | 1109 | 947 463 301 | 0.9 | 0.74 | 1.00 | 1.02 | 1.25 |
| 18.86 | Peo-3-(6″,6″′-difer-soph)-5-glc | 1139 | 977 463 301 | 3.2 | 3.38 | 3.65 | 2.79 | 3.19 |
| total anthocyanins | 455.08 | 503.63 | 521.12 | 553.68 | 496.8 | |||
| peonidin anthocyanin | 262.73 | 287.7 | 299.94 | 312.25 | 286.88 | |||
| 8.13 | Cy-3-O-glc (ITSD)(mg/mL) | 449 | 287 | 0.0565 | 0.0565 | 0.0565 | 0.0565 | 0.0565 |
The retention time of peak referred to Fig. 2.
Structure elucidation based on MS analysis and literature data. Abbreviations used: cy, cyanidin; peo, peonidin; soph. sophoroside; glc, glucoside; p-hb, para-hydroxybenzoyl; caf,caffeoyl; fer, feruloyl; p-coum, para-coumaroyl; dicaf, dicaffeoyl; difer.diferuloyl. DW: dry weight.
Figure 2 shows a liquid phase chromatogram of anthocyanin from PSP extracts. Eighteen peaks were observed in the chromatogram, and the retention time of the highest peak was 16.74. The fragment patterns were identified in accordance with the method described by Tian et al. (2005). The fragment analysis was as follows: the peak at retention time 7.24 produced fragment ions at m/z 787, 625, 463, and 301 (Figure 3). The fragment ions at m/z 301 are peonidin fragmentation ions, and the peak gave m/z values at 787 [M]+, 625 [M-glucoside]+, 463 [M-sophoroside]+ and 301 [M-sophoroside-glucoside]+, which compose peonidin-3-sophoroside-5-glucoside. However, a peak at the retention time 10.59 was unidentified because nuclear magnetic resonance (NMR) was not used to ensure its structure, and no previous studies have identified this peak. However, this peak may be a peonidin anthocyanin due to the fragment ion m/z at 301.
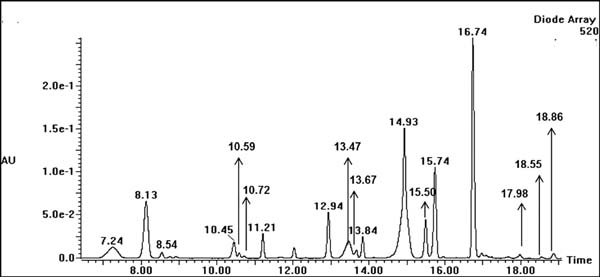
HPLC chromatograms of individual anthocyanins extracted from PSPs. The peak at 8.13 is an internal standard (cyanidin-3-O-glucoside).
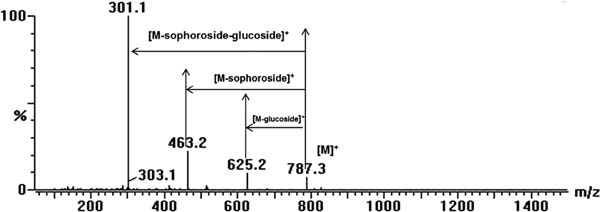
Mass spectrometry (MS) of the peonidin-3-sophoroside-5-glucoside product ion and MS data obtained using fragment ion analysis.
From the results in Table 5, the total anthocyanin content was dependent on the cooking treatment, and the cooking technique (such as S30, M2 − S15, S10 − M3 and M5) enhanced the total anthocyanin concentration. Compared with raw PSPs, many types of anthocyanins significantly increased after cooking. The quantity of cyanidin-3-(6″-caffeoyl-6″′-feruloyl-sophoroside)-5-glucoside increased from 10.97% (M5 PSP) to 34.20% (S10 − M3 PSP). The anthocyanin levels may have increased due to the inactivation of enzymes that can degrade the anthocyanin pigment (Yang, 2008). Moreover, scholars believe that the increase in anthocyanin levels is associated with an increase in anthocyanin extraction from the potato's cellular matrix due to starch texture changes during the cooking processes (Blessington et al., 2010). An appropriate combination of steaming and microwaving (M2 − S15 and S10 − M3) significantly increased the total anthocyanin concentration. Remarkably, the anthocyanins in cyanidin-3-(6″-caffeoyl-6″′-feruloyl-sophoroside)-5-glucoside and peonidin-3-(6″- caffeoyl-6″′-feruloyl-sophoroside)- 5-glucoside were abundant in PSP. Table 4 also shows that the total peonidin content was higher than the cyanidin content. For anthocyanins, heating with the moderate time and intensity can improve the levels of many types of anthocyanins compared with raw PSPs.
Antioxidant activity Several biochemical assays, DPPH, FRAP and ABTS, were used to determine the antioxidant properties.
Table 6 summarizes the antioxidant activity data for raw PSPs and the changes after cooking. All of the biochemical assays show a similar trend in which cooked PSPs exhibited greater antioxidant activity than raw PSPs. The results are consistent with (Burgos et al., 2013). The PSPs cooked using S10 − M3, which contained the highest levels of total phenolics (Table 2), chlorogenic acids (Table 4) and total anthocyanins (Table 5), exhibited the highest antioxidant capacity (DPPH, FRAP and ABTS). The antioxidant capacity of potatoes depends on their composition, such as the levels of particular anthocyanin and phenolic acids (Xu et al., 2009). The antioxidant activity of purple potatoes was mainly affected by polyphenols and certain anthocyanins (Nems et al., 2015). Xu et al. (2009) found that chlorogenic acid is the main phenolic acid that contributed to antioxidant capacity.
| Treatment | DPPH (%) | FRAP (mol FeSO4/g DW) | ABTS(%) |
|---|---|---|---|
| Raw | 60.40±0.30a | 0.423±0.002a | 73.45±0.48a |
| S30 | 63.83±0.30c | 0.497±0.002b | 80.35±0.60c |
| M2 − S15 | 70.42±0.30d | 0.534±0.001c | 86.89±1.01d |
| S10 − M3 | 74.29±0.30e | 0.594±0.001d | 92.28±0.65e |
| M5 | 62.60±0.20b | 0.493±0.002b | 77.24±0.28b |
Data are expressed as the mean ± SD, n=3.
Mean values of each column followed by different superscript letter significantly differ when subjected to Tukey's multiple range test (p < 0.05). DW: dry weight.
However, raw PSPs showed the lowest antioxidant potential due to the lower levels of flavonoids, total phenolics (Table 2), phenolic acids (Table 4) and total anthocyanins (Table 5). The results clearly indicate that the effect of the steaming and microwaving combination is positive and yields a better antioxidant capacity in PSP compared with only steaming or microwaving. The antioxidant activity significantly changed with an increase and decrease in phytochemical compounds content.
The steaming and microwaving combination can decrease the cooking time and better retain bioactive compounds. This combination exhibited a higher antioxidant capacity compared with the PSPs that were only steamed or microwaved. These findings indicate that the steaming and microwaving combination is a new cooking method that can increase the nutrition content and cooking efficiency compared with traditional cooking methods and may fulfil current consumers' needs.
PSP, purple sweet potato; M2 − S15, microwaving for 2 min followed by steaming for 15 min; S10 − M3, steaming for 10 min followed by microwaving for 3 min; DPPH, 1,1-diphenyl-2-picrylhydrazyl; FRAP, ferric reducing ability of plasma assay; ABTS, 2,2′-azino-bis-3-ethylbenzothiazoline-6-sulphonic acid; cy, cyanidin; peo, peonidin; soph. sophoroside; glc, glucoside; p-hb, para-hydroxybenzoyl; caf, caffeoyl; fer, feruloyl; p-coum, para-coumaroyl; dicaf, dicaffeoyl; difer.diferuloyl.
Acknowledgment This research was financially supported by Zhejiang postdoctoral research projects merit funding (BSH1502016), the program of “Collaborative innovation center of food safety and quality control in Jiangsu Province” and Ningbo FOTILE Kitchen Ware Co., Ltd.