Note
A Simple Method to Measure the Surface Roughness of Spaghetti Using a Digital Camera
2017 Volume 23 Issue 2 Pages 237-240
Details
2017 Volume 23 Issue 2 Pages 237-240
The surface roughness of spaghetti is an important factor influencing noodle quality during and after cooking. In this study, we describe a novel, rapid, and low-cost method, based on the principal that an object with a rougher surface refracts more light, to measure the surface roughness of spaghetti using images acquired with a common digital camera. This method helps determine the surface roughness using gray-level frequency distributions from transmission images and facilitates the measurement of surface geometry to the same accuracy as that of traditional, high-performance laser-scanning microscopy techniques. Furthermore, this method enables rapid measurement of the entire surface geometry of the spaghetti, including the steeply sloped and shaded regions, which are difficult to measure by the conventional laser method, owing to lower reflectance or shielding of the laser beam.
Pasta is popular in many countries and regions including Japan, and is industrially produced by vacuum extrusion molding (Wrigley et al., 2004; Feillet and Dexter, 1996). Dies made of bronze have traditionally been used. However, Teflon dies have become more widely used for the following reasons (Donnelly, 1982; Dalbon et al., 1996; Dawa, 2001): increased lifetime of the die from reduced abrasion, a smoother pasta surface, and improved general appearance of dried pasta. Pastas prepared using dies made of bronze and Teflon have rough and smooth surfaces, respectively. In previous study (Yoshino et al., 2013), we examined the properties of spaghetti prepared using molding dies made of aluminum, polycarbonate, and polypropylene, as well as those made of bronze and Teflon. The molding die material used affects the physical properties of spaghetti; spaghetti with the smoothest surface is prepared using a Teflon die with fast-injection extrusion molding and has a high apparent bulk density and high resistance to breaking. However, because of its rougher surface, the cooking time for spaghetti prepared using the bronze die is approximately a minute less than that for spaghetti prepared using the Teflon die. Notably, the chemical properties such as gelatinization temperature are not affected by the die material (Yoshino et al., 2013). Additionally, the initial rehydration rate of spaghetti can be controlled by altering the surface roughness, as the rehydration rate depends on the surface area, which is estimated based on surface asperity and is measured in the order of sub-micrometers (Ogawa and Adachi, 2014).
The cooking characteristics of pasta are affected by the surface roughness. Some chefs claim that pasta prepared using a bronze die, resulting in a rougher surface, retains more sauce, although this remains to be empirically validated. As described, the surface roughness of pasta is an important factor influencing pasta quality during and after cooking. Two types of instruments are typically used to measure the surface roughness of pasta. The first is a contact type instrument, such as a contact roughness meter or atomic force microscope; the second is the noncontact type, for example, a white light interferometer or laser-scanning microscope. Since pasta is a soft material, noncontact instruments are preferable for surface observations. Laser-scanning microscopy can measure surface geometry to a high degree of accuracy according to the standards set by the International Organization for Standardization (ISO) and the Japanese Industrial Standards (JIS). However, it is difficult to microscopically measure a steeply sloped or shaded sample owing to a reduction of reflectance or shielding of light. Therefore, the microscope is unsuitable for rapid measurement of the complete surface geometry of pasta prepared using a bronze die, in addition to being expensive. Therefore, in this study, we developed a novel, low-cost method for rapidly measuring the surface roughness of pasta, including the steeply sloped and shaded regions, with a high degree of accuracy.
Pasta preparation Spaghetti samples were prepared according to a previously described method (Yoshino et al., 2013). Briefly, 700 g durum semolina, supplied by Nisshin Foods, Inc. (Tokyo, Japan), and 224 g water were mixed using a KitchenAid blender (KSM150; FMI) for 20 min. The mixture was then placed into a pasta extruder (Magica, Bottene, Italy) equipped with molding dies made of bronze, aluminum, polycarbonate, polypropylene, or Teflon and extruded under reduced pressure (60 kPa) to prepare raw spaghetti. The orifice diameter and length of each die were 1.8 and 5 mm, respectively. Raw spaghetti was dried in a temperature-and humidity-controlled chamber (SH-641; Espec, Osaka, Japan) to reduce the moisture content to approximately 0.12 kg-H2O/kg dry matter. The temperature and relative humidity were increased from 50 to 85°C and 40 to 75%, respectively, during the first 50 min, maintained at 85°C and 75%, respectively, for the next 250 min, and decreased to 60°C and 65%, respectively, for the last 10 min. The mean diameters ± standard deviations of the spaghetti after drying were 1.75 ± 0.06 (bronze), 1.80 ± 0.06 (aluminum), 1.78 ± 0.05 (polycarbonate), 1.74 ± 0.05 (polypropylene), and 1.77 ± 0.04 mm (Teflon) (Yoshino et al., 2013).
Observation by transmission imaging The transmission image of the dried spaghetti, illuminated by an LED light board (Product No. NE000048; Neotex Material Co., Tokyo, Japan), was photographed using a digital camera (EOS 40D; Canon Inc., Tokyo, Japan) from the other side of the light board. The image was pixelated, and the frequency distribution of the gray level was generated from the green image using an Origin 8.1 Pro (OriginLab, Northampton, MA, USA). Ten samples were subjected to image processing for each spaghetti type sampled.
Observation of surface morphology A laser-scanning microscope (VK-8710; Keyence Corp., Osaka, Japan) was used to measure the geometry of the dried spaghetti surface. The xy- and z-direction resolutions were 686 nm/pixel (1,024 × 768 pixel) and 1 nm/digit (224 digit), respectively. The height-level frequency distributions were generated from the geometric data obtained from the laser-scanning microscope using Microsoft Excel (Redmond, WA, USA). Each spaghetti sample prepared using the five different die types was measured at least five times.
A novel method to measure surface roughness Objects with rougher surfaces refract more light; therefore, we developed a novel method to measure the surface roughness of spaghetti using a transmission image produced with a digital camera. This method facilitated the determination of surface roughness using the gray-level frequency distribution from the transmission image taken with a digital camera.
Figure 1 shows the transmission images of spaghetti prepared using various molding dies. The surface roughness was highest for the spaghetti prepared using the bronze die and became progressively smoother with the aluminum, polypropylene, polycarbonate, and Teflon dies. The images were parsed to red, green, and blue, and the gray-level frequency distribution was calculated from the green image (Fig. 2(A)). The frequency distribution was normalized for all pixels in the trimmed image for each spaghetti sample. Gray-level values can range from 0 to 255 (black to white); therefore, a larger value indicates a whiter surface. Spaghetti samples with smoother surfaces exhibited a larger gray-level value and shaper frequency distributions as a result of weak scattering of light on the surface and equable transmission of light through the spaghetti. Smaller gray-level values and broader distributions were observed for spaghetti with rougher surfaces, corresponding to those prepared using the bronze and aluminum dies.
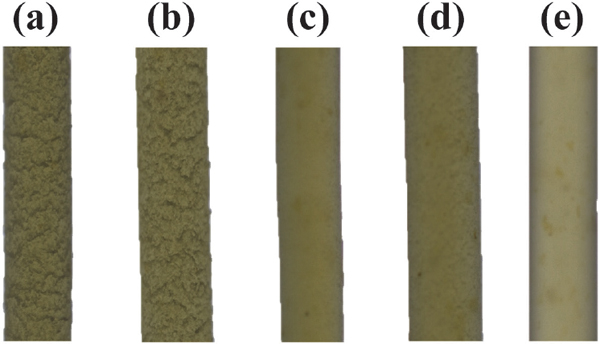
Transmission images of spaghetti extruded through dies made of (a) bronze, (b) aluminum, (c) polycarbonate, (d) polypropylene, and (e) Teflon. The diameter of each spaghetti was 1.7 – 1.8 mm. Images were trimmed from their original size to enhance the visualization of surface roughness.

Examples of (A) gray-level frequency distributions derived from green images and (B) height-level frequency distributions derived from laser scanning microscopy, for spaghetti extruded through dies made of (a) bronze, (b) aluminum, (c) polycarbonate, (d) polypropylene, and (e) Teflon. The transverse value of the gray-level frequency distribution (A) is inverted.
Comparison of existing and proposed methods The surface geometry of each spaghetti sample was measured with a three-dimensional laser-scanning microscope. Figure 2(B) shows the frequency distributions, normalized to the maximum profile valley depth. The height levels at the frequency distribution peaks were of the same order as the calculated average roughness (Ra) of the spaghetti surfaces for all the samples tested (Ogawa and Adachi, 2014). The frequency distributions of the spaghetti prepared using Teflon, polycarbonate, and polypropylene dies had sharp peaks ranging from approximately 20 to 40 µm, whereas the spaghetti prepared using the aluminum and bronze dies had broad distributions peaking near 60 µm.
The gray-level frequency distributions produced by this digital camera method were similar to the shape of the distributions of profile valley depth indicated by the laser-scanning microscope. This indicated that our method, using a transmission image produced by a digital camera, measured the surface geometry of spaghetti with nearly the same accuracy as the laser-scanning microscope method. The gray-level frequency distribution of spaghetti prepared using the Teflon die had a higher peak than those of the spaghetti prepared using the polypropylene and polycarbonate dies, and the dispersion of the gray and height levels reflected variations in the surface roughness at specific locations. The gray- and height-level frequency distributions were symmetric for spaghetti prepared using the Teflon, polycarbonate, and polypropylene dies, whereas the spaghetti prepared using the aluminum and bronze dies had asymmetric distributions and tailing at the lower gray levels. The results showed that this method could accurately measure steeply sloped surface geometries, which are difficult to measure by laser-scanning microscopy.
We also compared the gray-level height distribution characteristics of our method with those of the laser-scanning microscopy method (Fig. 3). The average (AVE), skewness (SKEW), and contrast (CNT) of each distribution were calculated using Eqs. (1), (2), and (3), respectively.

Comparison of the (A) average, (B) skewness, and (C) contrast between the gray-level frequency distributions of transmission images obtained using a digital camera (Tig) and that of the height level obtained by the existing method using a laser scanning microscope (LSM). Bars indicate standard deviations.
 |
 |
 |
where I is the gray or height level, and P(I) is the normalized frequency at I. The variance (VAR) is defined by Eq. (4).
 |
The average and skewness of the gray-level distributions correlated linearly with those of the distributions of the height level, and the contrast for the distribution of the gray level could be correlated by a power law with that for the distribution of the height level. The coefficients of determination (R2) of the average, skewness, and contrast were 0.904, 0.942, and 0.958, respectively. Therefore, once the calibration curve for a parameter characterizing the surface roughness was prepared between the proposed and existing methods, the surface roughness of spaghetti could be easily quantified using a digital camera.
Our results demonstrated that the accuracy of this method was comparable to that of both high-performance and noncontact laser-scanning microscopy methods for measurement of the surface geometry of spaghetti. However, our method has the following advantages. First, this method does not require scanning to obtain a two-dimensional transmission image and can be used on samples with a long side of approximately 10 cm or less. Additionally, this method takes approximately one-tenth of the time required for laser-scanning microscopy and enables us to measure the geometry of steeply sloped and shaded surfaces, which are difficult to determine using laser-scanning microscopy.
In conclusion, our method facilitated the measurement of the surface geometry of spaghetti using a common, inexpensive digital camera, with approximately the same accuracy as that with a laser-scanning microscope, although the method cannot estimate the parameters set forth by the ISO and JIS.
Acknowledgments This study was carried out as part of a project of The Cereal Science Consortium of the Graduate School of Agriculture, Kyoto University, Gifu University, and the Nissin Seifun Group, Inc. This work was supported by a Grant-in-Aid for Challenging Exploratory Research of the Japan Society for the Promotion of Science (S.A.; grant number 26560045) and by a Grant-in-Aid for the Japan Society for the Promotion of Science Fellows (T.O.; grant number 14J02443).