Abstract
To quantitatively evaluate the production of staphylococcal enterotoxin A (SEA) in cooked rice, we inoculated 11 strains of SEA-producing Staphylococcus aureus into cooked rice, incubated the samples at 15 – 37°C, and quantified SEA. The maximal concentrations of SEA were 0.0 (not detected)-4.0 ng/g at an incubation temperature of 15°C, 0.4 – 8.4 ng/g at 20°C, and 2.3 – 53.8 ng/g at 37°C with an inoculum size of 106 CFU/g. There were few correlations among the maximal concentrations of SEA at incubation temperatures of 15, 20, and 37°C or between the maximal concentrations of SEA produced in a liquid medium and in cooked rice. Although the predicted amounts of SEA produced in a rice ball under conditions of 16 h of incubation at 20°C or 4 h at 37°C appeared to reach levels capable of causing staphylococcal food poisoning, S. aureus growth under these conditions was not organoleptically detected.
Introduction
Staphylococcus aureus causes staphylococcal food poisoning (SFP) due to staphylococcal enterotoxins (SEs) produced in foods (Cretenet et al., 2011; Lima et al., 2013). A number of antigenically different types of SEs, including SEA-SEE, SEG-SEI and SEK-SET, have been identified (Seo, 2016). Of the SEs, SEA appears to be the most frequently associated with SFP (Holmberg and Blake, 1984). SEA is heat-stable and can be active after heating at 100°C for 30 min (Hilker et al., 1968). Reheating contaminated food before eating is, therefore, not effective in preventing SFP.
In Japan, SFP has been associated with cooked rice products such as rice ball (onigiri), traditional Japanese-style desserts (ohagi, daifuku, and dango) and packed lunch (bento). These products are made by hand, and are contaminated with S. aureus by food workers during food preparation (Uehara et al., 2014)i). A large outbreak of SFP occurs when many people eat these contaminated products. Incidences of SFP in such products sold in supermarkets and convenience stores have been reduced in recent years by improvements in the methods of preparation, distribution, and storage of the foods. However, yearly occurrences of SFP continue due to contaminated cooked rice products, such as homemade rice balls and ready-to-eat meals, sold at events in Japan.
Shinagawa (1971) reported the growth of S. aureus and SEA production in cooked rice at 37°C. SEA was detected after 24 h of incubation, but not after 12 h. The maximal concentrations of SEA were 16 – 32 µg/100 g after 48 h. Ikegame et al. (1985) reported the growth of S. aureus and SEA production in cooked rice at 35°C. SEA was detected after 9 h of incubation, and the maximal concentration of SEA was 40 ng/g after 24 h. Although these studies showed that SEA was produced in cooked rice, only one strain was used in each study. To assess SEA production in cooked rice more extensively, it is necessary to use various SEA-producing strains. Our previous study (Tsutsuura et al., 2013) showed that SEA production in a liquid medium differed significantly among strains.
SEA production has been detected by the gel diffusion method (Shinagawa, 1974) and reversed passive latex agglutination (RPLA) (Ikegame et al., 1985). In general, the amount of SEA causing SFP is considered to be about 200 – 1000 ng/person (Evenson et al., 1988; Ikeda et al., 2005), although some reports showed less toxic doses of SEA, 20 to 100 ng in humans (Evenson et al., 1988; Asao et al., 2003). The specificity of SEA detection used in these studies was low, and the estimated values were unreliable in terms of quantitative analysis. The SEA concentration can be more precisely estimated using Western blot analysis, since this method is more sensitive and specific than other assays (Rasooly and Rasooly, 1998; Shimamura and Murata, 2009).
Temperature control is important for the prevention of SFP in cooked rice. But there has been no study investigating the effect of temperatures below 20°C on SEA production in cooked rice. We, therefore, considered it important to examine SEA production at lower temperatures, such as 15 and 20°C, in cooked rice in comparison with results obtained at 37°C.
On the other hand, the growth of S. aureus can be detected using the senses of sight and smell or organoleptically. S. aureus colonies are known to be orange or yellow. Also, in general, broths in which S. aureus is grown produce an unpleasant odor. However, it is unclear whether SEA-producing strain can be organoleptically detected in cooked rice at the low levels of SEA capable of causing SFP.
The purpose of this study is to better understand SEA production in cooked rice in order to prevent SFP. We first established a quantitative analytical method for SEA in cooked rice using Western blot analysis, and then examined the concentrations of SEA in cooked rice using various SEA-producing strains of S. aureus at three different incubation temperatures of 15, 20 and 37°C. Further, we estimated the limitation of organoleptic detection of S. aureus in cooked rice.
Materials and Methods
Preparation of cooked rice Rice (Oryza sativa cv. Hitomebore, Miyagi, Japan) was purchased from a retail shop in Tokyo. Reverse osmosis water (1.4 mL) was added to 1 g of milled rice in a screw-cap test tube (20 i.d. mm × 125 mm), left for 30 min, and then autoclave-heated at 121°C for 10 min. The cooked rice (2.4 g) was left at room temperature for 1 h, and then at 37°C for 0.5 – 1 h before being used in experiments.
Inoculation of S. aureus Eleven strains of SEA-producing S. aureus held in our laboratory were used in this study (Shimamura et al., 2006; Shimamura and Murata, 2008). A loopful of bacterial culture from a slant was transferred to 5 mL of brain heart infusion (BHI) broth (Difco Laboratories, Detroit, MI, USA) and incubated at 37°C for 24 h with shaking at 120 rpm. After 50 µL of the bacterial culture was transferred to 5 mL of BHI broth, it was further incubated at 37°C for 14 h. This seed culture was washed with phosphate-buffered saline (PBS), diluted with PBS, and inoculated into cooked rice at about 106 CFU/g.
Extraction of SEA from cooked rice Two kinds of mechanical treatments for SEA extraction, vortexing and stomaching, were compared. Purified SEA (Toxin Technology, Sarasota, FL, USA) was added to cooked rice (2.4 g) at a concentration of 40 ng/g, mixed with a spatula, and left for 30 min; Milli-Q water (4 mL) was then added. After being dispersed with a spatula, the sample was shaken with a vortex mixer (Iwaki Glass, Tokyo, Japan) for 10 s or homogenized with a stomacher (GSI Creos, Tokyo) for 30 s. Each mixture was centrifuged at 18,000 × g for 20 min at 4°C, and the resulting supernatant was used for Western blot analysis.
Three kinds of solvents, i.e., water, 1 mg/mL bovine serum albumin (BSA) solution and PBS, were compared for SEA extraction. Each seed culture (about 107 CFU/mL) of the S. aureus strains (C-74, C-271, and C-77-L22) was mixed, inoculated into the cooked rice (2.4 g) at about 106 CFU/g, and then incubated at 37°C for 48 h. Two to six mL of water, BSA solution, and PBS were respectively added to the cooked rice. Each sample was shaken with a vortex mixer for 10 s, and then centrifuged at 18,000 × g for 20 min at 4°C. The resulting supernatant was used for Western blot analysis.
The effect of repeated SEA extraction was also examined. SEA (4, 20, and 40 ng) was added to cooked rice (2.4 g) and then extracted with 2 mL of BSA solution. After each mixture was shaken with a vortex mixer, the supernatant obtained by centrifugation at 18,000 × g for 20 min at 4°C was used for Western blot analysis. This procedure was repeated twice more.
Determination of S. aureus and SEA in cooked rice Cooked rice (2.4 g) inoculated with the eleven strains of S. aureus at about 106 CFU/g was incubated at 15, 20 and 37°C for 11 d, 120 h, and 48 h, respectively. To determine the staphylococcal count, each sample and 10 mL of PBS were placed into a stomacher bag (Elmex, Tokyo) and homogenized with a stomacher for 30 s. Bacterial numbers were determined by colony-counting on mannitol salt agar plates (Eiken Chemical, Tokyo) and expressed as colony forming units (CFU).
SEA was extracted by adding 2 mL of BSA solution (1 mg/mL) to each sample, which was then shaken with a vortex mixer at 10 s and centrifuged at 18,000 × g for 20 min at 4°C. This procedure was repeated once more. The two supernatants were respectively applied to the Western blot analysis.
Western blot analysis Western blot analysis was performed as previously described (Tsutsuura et al., 2013) with some modifications. After electrophoresis, the gel was blotted for 30 min onto a nitrocellulose membrane (Toyo Roshi, Tokyo) at 2 mA/cm2 using Trans-Blot SD Semi-Dry Transfer Cell (Bio-Rad, CA, USA), which was washed with PBS containing 0.05% Tween 20 (PBST) and blocked with 0.6% skim milk in PBST for 45 min. The membrane was incubated for 1 h with rabbit anti-SEA IgG (Sigma, St. Louis, MO, USA) diluted to 1:5,000 (v/v) in PBST, before being incubated for 1 h with goat anti-rabbit peroxidase (Funakoshi, Tokyo) diluted to 1:20,000 (v/v) in PBST. Immunoreactive bands were stained using EzWestLumi plus (Atto, Tokyo), before being scanned with Las-4000 (Fujifilm, Tokyo) and quantified using Image J software (National Institutes of Health, Bethesda, MD, USA). Purified SEA was used as a standard to quantify the produced SEA.
Sensory analysis Each sample of cooked rice (2.4 g) was placed in a test tube with a cap and inoculated with one of S. aureus three strains (C-241, C-271, and C-77-L22) as high SEA-producing strains. These strains were previously reported to produce approximately 200 ng/mL of SEA in BHI broth at 37°C (Tsutsuura et al., 2013). The samples were incubated at 37°C for 4, 8, 16, 24, and 48 h. Differences in the color and odor of the incubated samples compared to the non-incubated sample were respectively evaluated by the triangle test (Stone et al., 2012) using 10 untrained females (20 to 30 years old). Samples used for odor evaluation were covered with aluminum foil to eliminate visual bias and pre-warmed in hot water (60 – 70°C) for 3 – 5 min before the evaluation. Statistical differences were judged according to the table of Roessler et al. (1978).
Statistical analysis Statistical analyses were performed using Excel 2010 (Microsoft, Redmond, WA, USA) with the add-in software Statcel 3 (OMS, Tokorozawa, Japan). Data were assessed using Pearson's correlation coefficient and one-way analysis of variance followed by Tukey's multiple comparison test. The significance level was set at p < 0.05 and p < 0.01. All experiments were conducted in at least triplicate.
Results and Discussion
Procedure of SEA extraction in cooked rice To optimize SEA extraction from cooked rice, the following were assessed: mechanical treatment, extraction solvent, amount of added solvent, and multiple extraction cycles. First, vortexing and stomaching were compared for SEA extraction. The recoveries of spiked SEA to cooked rice were similar for both vortexing and stomaching, 80 ± 9% and 75 ± 6%, respectively. As the recovery with vortexing was somewhat higher and it is a simpler procedure than stomaching, the vortexing method was selected for SEA extraction from cooked rice.
Next, the extraction solvent and the volume of added solvent were examined. SEA in cooked rice was extracted using three kinds of solvent, i.e., water, BSA solution, and PBS. As shown in Fig. 1A, the efficiency of SEA extraction was the highest with BSA solution, followed by water. The extraction volumes were then examined using BSA solution and water (Fig. 1B). The extraction efficiency using 2 mL of BSA solution was the highest, and had the smallest standard deviation. Therefore, 2 mL of BSA solution was selected for SEA extraction. The use of BSA solution is known to increase the sensitivity of Western blot analysis by preventing non-specific adsorption to experimental materials.

To determine the effect of multiple extraction cycles, three levels of SEA (5, 20, and 40 ng/g) were added to cooked rice. The recoveries of the first, second and third SEA extractions from cooked rice were about 62 – 92%, 0 – 36%, and 0 – 1%, respectively. The extraction recoveries for all analyses were greater than 93%. Most of the added SEA was recovered in the first and second extractions. Thus, we decided to extract SEA twice from cooked rice.
From these results, we determined the extraction method for SEA in cooked rice. The detection limit was about 0.4 ng/g of cooked rice using our method.
Effects of incubation temperature on S. aureus growth and SEA production in cooked rice The effects of incubation temperature (15, 20, and 37°C) on S. aureus growth and SEA production in cooked rice were examined using three S. aureus strains (C-77-L22, C-241, and C-271). Table 1 shows the growth and SEA production of the strains. SEA was first detected after 2 – 3 d of incubation at 15°C, 6 h at 20°C, and 4 h at 37°C. Increasing incubation temperature from 15°C to 37°C resulted in increased growth of strains and SEA production in cooked rice. It was reported that SEA was first detected after 24 h of incubation at 37°C with an inoculum size of 103–4 CFU/g, but was not after 12 h (Shinagawa, 1974). It was also reported that SEA was first detected after 9 h of incubation at 35°C with an inoculum size of 103 CFU/g, but was not after 8 h (Ikegame et al., 1985). In this study, SEA was detected more rapidly than in the previous reports. Notably, the inoculum size in this study was larger than in the previous reports. Moreover, the sensitivity of SEA detection in this study seemed to be greater than that in the previous studies, likely due to the use of the gel diffusion method and RPLA for SEA detection.
Table 1.
Growth of three strains of S. aureus (C-241, C-271, and C-77-L22) and their SEA production at the incubation temperature of 15°C (A), 20°C (B), and 37°C (C) in cooked rice (n=3).
| A |
Incubation time
(d) |
C-241 |
C-271 |
C-77-L22 |
| Growth |
SEA |
Growth |
SEA |
Growth |
SEA |
| (log CFU/g) |
(ng/g) |
(log CFU/g) |
(ng/g) |
(log CFU/g) |
(ng/g) |
| 0 |
6.0±0.0 |
nd* |
5.9±0.1 |
nd* |
6.1±0.0 |
nd* |
| 1 |
7.5±0.0 |
nd* |
7.4±0.1 |
nd* |
7.3±0.0 |
nd* |
| 2 |
8.3±0.0 |
0.5±0.0 |
8.1±0.0 |
nd* |
8.1±0.0 |
nd* |
| 3 |
8.5±0.1 |
0.9±0.0 |
8.5±0.0 |
0.6±0.3 |
8.5±0.0 |
0.9±0.1 |
| 5 |
8.6±0.1 |
1.0±0.1 |
8.5±0.2 |
1.1±0.3 |
8.7±0.0 |
1.1±0.1 |
| 7 |
8.4±0.1 |
1.4±0.1 |
8.4±0.0 |
1.3±0.1 |
9.0±0.0 |
1.3±0.0 |
| 9 |
7.7±0.2 |
1.4±0.1 |
8.3±0.1 |
1.4±0.0 |
9.0±0.1 |
1.4±0.0 |
| 11 |
7.5±0.1 |
1.7±0.0 |
8.3±0.2 |
1.5±0.3 |
9.0±0.3 |
1.9±0.3 |
| mean ± SD. * not detected (< 0.4 ng/g) |
| B |
Incubation time
(h) |
C-241 |
C-271 |
C-77-L22 |
| Growth |
SEA |
Growth |
SEA |
Growth |
SEA |
| (log CFU/g) |
(ng/g) |
(log CFU/g) |
(ng/g) |
(log CFU/g) |
(ng/g) |
| 0 |
6.4±0.0 |
nd* |
6.2±0.0 |
nd* |
6.3±0.0 |
nd* |
| 6 |
7.4±0.1 |
0.9±0.1 |
7.2±0.0 |
1.9±0.3 |
7.3±0.1 |
1.5±0.3 |
| 8 |
7.8±0.0 |
1.1±0.3 |
7.4±0.1 |
2.0±0.3 |
7.5±0.2 |
1.9±0.3 |
| 16 |
8.2±0.0 |
2.0±0.4 |
8.0±0.1 |
2.8±0.3 |
8.1±0.1 |
3.1±0.6 |
| 24 |
8.4±0.0 |
3.5±0.4 |
8.3±0.0 |
2.9±0.0 |
8.5±0.5 |
4.6±1.4 |
| 48 |
8.6±0.1 |
2.6±0.9 |
8.3±0.1 |
3.4±0.2 |
8.6±0.0 |
4.9±0.6 |
| 72 |
8.7±0.0 |
4.4±0.3 |
8.6±0.0 |
3.8±0.0 |
8.9±0.1 |
5.6±1.2 |
| 96 |
8.8±0.0 |
4.4±0.5 |
8.8±0.1 |
5.0±0.1 |
9.2±0.1 |
6.9±0.2 |
| 120 |
9.3±0.1 |
6.2±0.6 |
8.8±0.0 |
7.2±0.3 |
9.3±0.1 |
8.4±1.6 |
| mean ± SD. * not detected (< 0.4 ng/g) |
| C |
Incubation time
(h) |
C-241 |
C-271 |
C-77-L22 |
| Growth |
SEA |
Growth |
SEA |
Growth |
SEA |
| (log CFU/g) |
(ng/g) |
(log CFU/g) |
(ng/g) |
(log CFU/g) |
(ng/g) |
| 0 |
6.4±0.0 |
nd* |
5.8±0.2 |
nd* |
6.6±0.1 |
nd* |
| 2 |
8.0±0.0 |
nd* |
6.9±0.1 |
nd* |
7.2±0.0 |
nd* |
| 4 |
8.7±0.0 |
0.6±0.8 |
7.4±0.1 |
4.0±0.2 |
7.8±0.1 |
2.4±0.2 |
| 8 |
8.8±0.0 |
4.0±0.0 |
8.0±0.2 |
25.3±3.1 |
8.7±0.1 |
7.3±1.3 |
| 16 |
9.1±0.0 |
4.2±0.0 |
8.8±0.0 |
32.8±0.7 |
9.5±0.0 |
29.2±0.3 |
| 24 |
9.3±0.1 |
5.5±0.4 |
8.7±0.0 |
44.7±0.3 |
9.6±0.1 |
31.8±0.1 |
| 40 |
9.5±0.1 |
5.9±0.8 |
9.0±0.0 |
42.5±0.2 |
9.8±0.1 |
34.5±0.5 |
| 48 |
9.4±0.1 |
5.9±0.1 |
9.1±0.1 |
53.8±0.8 |
9.8±0.1 |
34.5±2.3 |
| mean ± SD. * not detected (< 0.4 ng/g) |
SEA was first detected when the S. aureus strains reached numbers of 2.9 × 10⁸ − 3.2 × 10⁸ CFU/g at 15°C, 1.6 × 10⁷ − 2.7 × 10⁷ CFU/g at 20°C, and 2.6 × 10⁷ − 4.9 × 10⁸ CFU/g at 37°C. The bacterial populations reached 3.2 × 10⁷ − 1.1 × 10⁹ CFU/g for 11 d of incubation at 15°C, 6.4 × 10⁸ − 2.0 × 10⁹ CFU/g for 120 h at 20°C, and 1.4 × 10⁹ − 6.6 × 10⁹ CFU/g for 48 h at 37°C. The bacterial numbers at an incubation temperature of 37°C in this study were similar to those of previous reports (Shinagawa, 1974; Ikegame et al., 1985). There was a concomitant increase in SEA production with increasing bacterial population. The maximal concentrations of SEA produced by these three strains were 1.5 – 1.9 ng/g, 6.2 – 8.4 ng/g, and 5.9 – 53.8 ng/g for 11 d of incubation at 15°C, 120 h at 20°C, and 48 h at 37°C, respectively. These results were equivalent to or less than those reported previously (Shinagawa, 1974).
The time-course of SEA production was then compared among the strains at each incubation temperature. SEA produced by C-271 and C-77-L22 was detected after 3 d of incubation at 15°C, 6 h at 20°C, and 4 h at 37°C, while SEA produced by C-241 was detected after 2 d of incubation at 15°C, 6 h at 20°C, and 4 h at 37°C. These results indicate that there was no definite difference in incubation time for SEA detection among these three strains. C-271 and C-77-L22 produced SEA during the exponential and stationary phases. On the other hand, C-241 produced a small amount of SEA during the death phase as well as the exponential and stationary phases at 15°C, although a longer incubation time was required. Our previous study (Tsutsuura et al., 2013) showed that C-241 produced SEA during the death phase as well as the exponential and stationary phases in a liquid medium at 10°C.
Assuming that a rice ball was made with 80 g of cooked rice and was contaminated with these S. aureus strains, the amount of SEA per rice ball could be calculated from the SEA quantified in this study. For example, as these strains produced 0.6 – 4.0 ng/g of SEA after 4 h at 37°C, the contaminated rice ball would contain 48 – 320 ng/rice ball of SEA after 4 h of incubation at 37°C. Similarly, the contaminated rice ball would contain 120 – 132 ng/rice ball of SEA after 11 d at 15°C and 160–248 ng/rice ball of SEA after 16 h at 20°C. The amount of SEA required to cause SFP is thought to be about 200 – 1000 ng/person (Ikeda et al., 2005; Evenson et al., 1988). Thus, the amount of SEA in a rice ball contaminated with about 106 CFU/g of S. aureus and incubated for 4 h at 37°C or 16 h at 20°C might be sufficient to cause SFP.
Effect of incubation temperature on the maximal concentration of SEA produced by eleven strains The maximal concentrations of SEA produced at incubation temperatures of 15, 20, and 37°C in cooked rice were compared using the eleven strains (Table 2). The maximal concentrations of SEA were 0.0 (not detected)-4.0 ng/g at 15°C, 0.4 – 8.4 ng/g at 20°C, and 2.3 – 53.8 ng/g at 37°C. There were significant differences in the amount of SEA produced among the strains at each incubation temperature (p < 0.05 at 15 and 20°C, and p < 0.01 at 37°C). In our previous study (Tsutsuura et al., 2013), there were also significant differences in the amount of SEA produced among these strains in BHI broth.
Table 2.
Effect of incubation temperatures on the maximal concentrations of SEA (ng/g) produced by each strain in cooked rice (n=3).
| Strain |
Maximal concentrations of SEA |
| 15°C |
20°C |
37°C |
| C-29 |
2.7±0.4 |
0.8±0.1 |
4.4±0.7 |
| C-70 |
0.9±0.1 |
2.3±0.2 |
24.3±1.0 |
| C-74 |
nd* |
0.4±0.2 |
4.6±0.4 |
| C-90 |
0.4±0.4** |
2.6±1.1 |
5.3±0.2 |
| C-95 |
3.0±0.9 |
3.7±0.3 |
20.7±1.5 |
| C-102 |
2.8±0.8 |
0.8±0.1 |
6.2±0.6 |
| C-103 |
4.0±0.9 |
1.5±0.1 |
3.0±0.1 |
| C-241 |
1.7±0.0 |
6.2±0.6 |
5.9±0.1 |
| C-271 |
1.5±0.3 |
7.2±0.3 |
53.8±0.8 |
| C-29#13 |
3.0±0.5 |
1.6±0.4 |
2.3±0.0 |
| C-77-L22 |
1.9±0.3 |
8.4±1.6 |
34.5±2.3 |
Cooked rice inoculated with each strain was incubated for 11 day, 120 h, and 48 h at 15°C, 20°C, and 37°C, respectively. mean ± SD.
* not detected (< 0.4 ng/g).
** measurements less than the detection limit were contained.
The maximal concentrations of SEA produced by the strains (C-29, C-70, C-74, C-90, C-95, C-102, C-271 and C-77-L22) at 15 and 20°C were less than those at 37°C. However, some strains (C-103, C-241 and C-29#13) produced as much or more SEA at 15 and 20°C than at 37°C, although a longer incubation time was required.
The relationship between maximal SEA concentration and incubation temperatures of 15, 20, and 37°C were then examined (Fig. 2). A significant correlation was apparent only between the maximal SEA concentrations at 20°C and 37°C (R=0.71, p < 0.05). We previously found significant correlations between the maximal concentrations of SEA at 15°C and 20°C, at 15°C and 37°C, and at 20°C and 37°C using these strains in BHI broth (Tsutsuura et al., 2013). However, no correlations between the maximal concentrations of SEA in the cooked rice at 15°C and 20°C, and at 15°C and 37°C were apparent. This suggests that the effect of temperature on SEA production was more strongly dependent on strain characteristics in cooked rice than in a liquid medium.

Comparison of the maximal concentrations of SEA produced in cooked rice and in BHI broth In our previous study (Tsutsuura et al., 2013), the growth of S. aureus and SEA production were examined in BHI broth at 15 – 37°C. We compared that data with the results obtained in this study. All of the strains increased in numbers from 106 CFU/mL to 109–10 CFU/mL after 24 h at 37°C in BHI broth and from 106 CFU/g to 108–10 CFU/g after 48 h at 37°C in cooked rice. The maximal numbers of most strains in BHI broth were thus tenfold that observed in cooked rice.
The maximal concentrations of SEA produced by all the strains were 50 – 300 ng/mL after 24 h at 37°C in BHI broth and 2 – 54 ng/g after 48 h at 37°C in cooked rice. The maximal concentrations of SEA produced by all the strains in BHI broth were greater than those in cooked rice. Gourama et al. (1991) reported that the maximal concentrations of SEA were 0.3 ng/g in clam chowder and 21.9 ng/mL in BHI broth at 37°C. Similar to our results, the maximal concentration of SEA produced in BHI broth was higher than that in food. It is possible that the nutrient composition of the medium or food had an influence on the SEA production. The most commonly required amino acids for the growth of S. aureus strains are arginine, valine, leucine, cysteine and proline (Bergdoll et al., 1974). Of these amino acids, three (cysteine, arginine, and proline) are the minimal requirements for growth and SEA production (Mah et al., 1967). Further, Onoue and Mori (1997) reported that valine was required for growth, and that arginine and cysteine were required for growth and SEA production. It is also known that the nutritional requirements for the growth of S. aureus and SEA production differ among S. aureus strains (Taylor and Holland, 1989).
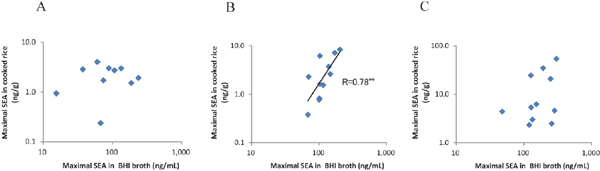
The relationships between the maximal concentrations of SEA produced in BHI broth and in cooked rice at each temperature of 15, 20, and 37°C were then examined (Fig. 3). A significant correlation was found between the maximal concentrations of SEA in BHI broth and in cooked rice at 20°C (R=0.78, p < 0.01), while no correlations were apparent between those at 15°C (R=0.52) and 37°C (R=0.46). These results indicate the difficulty in predicting the amount of SEA produced in cooked rice from that observed in a liquid medium, making it necessary to determine the concentration of SEA in each food.
Sensory evaluation of S. aureus growth To determine the level of S. aureus growth necessary for organoleptic detection or the duration of time until detection, we compared the color and odor of the cooked rice inoculated with S. aureus (C-241, C-271, and C-77-L22) and incubated at 37°C for 4–48 h with those of the non-incubated control by sensory evaluation. Table 3 shows the results of the triangle test. Because SEA is toxic, we were unable to examine differences in the taste of the cooked rice. The cooked rice inoculated with C-77-L22 and C-241 and incubated for 16 and 24 h at 37°C, respectively, showed significant differences in the color compared to the control (Table 3A), while that inoculated with C-271 and incubated for 48 h at 37°C did not. The duration of incubation necessary to detect differences in the color differed among the strains and appeared to be dependent on strain characteristics. Most S. aureus strains produce orange colonies, while others produce yellow and white colonies (Marshall and Wilmoth, 1981a; Grinsted and Lacey, 1973; Niskanen and Aalto, 1978). The color of the C-271 colonies in the medium was cream yellow, and was lighter than that of C-241 and C-77-L22. It was proposed that the incubation duration required to detect color differences varied among the strains because the amounts and types of carotenoids produced by S. aureus strains are different (Davis et al., 2005). The main pigment has been identified as α-d-glucopyranosyl 1-O-(4,4-diaponeurosporen-4-oate)-6-O-(12-methyltetradecanoate) (Marshall and Wilmoth, 1981b).
Table 3.
Sensory evaluation of the color (A) and the odor (B) of cooked rice inoculated with a strain of
S. aureus (C-241, C-271, and C-77-L22).
| A |
Incubation time
(h) |
Number of correct answers (n=10) |
| C-241 |
C-271 |
C-77-L22 |
| 0 |
- |
- |
- |
| 4 |
4 |
4 |
1 |
| 8 |
3 |
3 |
6 |
| 16 |
0 |
5 |
**10 |
| 24 |
**9 |
1 |
**9 |
| 48 |
**10 |
2 |
**10 |
| B |
Incubation time
(h) |
Number of correct answers (n=10) |
| C-241 |
C-271 |
C-77-L22 |
| 0 |
- |
- |
- |
| 4 |
4 |
4 |
3 |
| 8 |
**9 |
*7 |
**9 |
| 24 |
**10 |
**10 |
**9 |
Differences between non-incubated (0 h; control) and incubated cooked rice at 37°C for 4–48 h were evaluated using the triangle test. -, control.
On the other hand, the cooked rice incubated for 8 h at 37°C with all the strains showed significant differences in odor compared to the control (Table 3B). It was reported that various compounds, such as aldehydes (3-methylbutanal, 2-methylpropanal, acetaldehyde and (Z)-2-methyl-2-butenal), alcohols (1-butanol, 2-methyl-1-propanol, and 3-methyl-1-butanol), ketones (acetoin and acetol), acids (isovaleric acid and acetic acid) and volatile sulfur-containing compounds (dimethyldisulfide and methanethiol) were released during S. aureus growth in the medium (Filipiak W et al., 2012), although there are no reports examining the types of odor components produced in cooked rice contaminated with S. aureus. These results indicate that odor could be a more sensitive detector of S. aureus growth than color. However, it is important to point out that no significant difference in the odor was detected with 4 h incubation at 37°C. As mentioned above, cooked rice incubated for 4 h at 37°C might contain sufficient amounts of SEA to cause SFP. These results suggest that the SEA concentration reaches a level sufficient to cause SFP in cooked rice before we are able to perceive S. aureus growth and SEA production using our sense of smell. The senses of sight and smell are not sufficient to detect SEA production during the early phase of incubation. Scientific regulation and control is, therefore, indispensable to avoid SFP.
Conclusion
All the strains used here produced SEA in BHI broth, and grew and produced SEA in cooked rice. SEA production in cooked rice was influenced by incubation temperature, and varied among S. aureus strains. Our results indicated the difficulty in predicting the amount of SEA produced in cooked rice from the information obtained at different incubation temperatures or using a liquid medium. Although we proposed that the level of SEA in a rice ball inoculated with 106 CFU/g was sufficient to cause SFP after 16 h of incubation at 20°C and after 4 h at 37°C, the growth of S. aureus under these conditions was not organoleptically detected.
Acknowledgements This study was supported by a Grant-in-Aid for Scientific Research (no. 26750021) from the Japan Society for the Promotion of Science.
References
- Asao, T., Kumeda, Y., Kawai, T., Shibata, T., Oda, H., Haruki, K., Nakazawa, H., and Kozaki, S. (2003). An extensive outbreak of staphylococcal food poisoning due to low-fat milk in Japan: estimation of enterotoxin A in the incriminated milk and powdered skim milk. Epidemiol. Infect., 130, 33-40.
- Bergdoll, M.S., Czop, J.K., and Gould, S.S. (1974). Enterotoxin synthesis by the Staphylococci. Ann. N. Y. Acad. Sci., 236, 309-316.
- Cretenet, M., Even, S., and Loir, Y.L. (2011). Unveiling Staphylococcus aureus enterotoxin production in dairy products: a review of recent advances to face new challenges. Dairy Sci. Technol., 91, 127-150.
- Davis, A.O., O'Leary, J.O., Muthaiyan, A., Landevin, M.J., Delgado, A., Abalos, A.T., Fajardo, A.R., Marek, J., Wilkinson, B.J., and Gustafson, J.E. (2005). Characterization of Staphylococcus aureus mutants expressing reduced susceptibility to common house-cleaners. J. Appl. Microbiol., 98, 364-372.
- Evenson, M.L., Hinds, M.W., Bernstein, R.S., and Bergdoll, M.S. (1988). Estimation of human dose of staphylococcal enterotoxin A from a large outbreak of staphylococcal food poisoning involving chocolate milk. Int. J. Food Microbiol., 7, 311-316.
- Filipiak, W., Sponring, A., Baur, M.M., Filipiak, A, Ager, C., Wiesenhofer, H., Nagl, M., Troppmair, J., and Amann, A. (2012). Molecular analysis of volatile metabolites released specifically by Staphylococcus aureus and Pseudomonas aeruginosa. BMC Microbiol., 12, 113-129.
- Gourama, H., Tsai, W.Y.J., and Bullerman, L.B. (1991). Growth and production of enterotoxins A and D by Staphylococcus aureus in salad bar ingredients and clam chowder. J. Food Protect., 11, 836-899.
- Grinsted, J. and Lacey, R.W. (1973). Ecological and genetic implications of pigmentation in Staphylococcus aureus. J. Gen. Microbiol., 75, 259-267.
- Hilker, J.S., Heilman, W.R., Tan, P.L., Demy, C.B., and Bohrer, C.W. (1968). Heat inactivation of enterotoxin A from Staphylococcus aureus in veronal buffer. Appl. Microbiol., 16, 308-310.
- Holmberg, S.D. and Blake, P.A. (1984). Staphylococcal food poisoning in the United States: new facts and old misconceptions. J. Am. Med. Assoc., 27, 487-489.
- Ikeda, T., Tamate, N., Yamaguchi, K., and Makino, S. (2005). Mass outbreak of food poisoning disease caused by small amounts of staphylococcal enterotoxins A and H. Appl. Mictobiol., 71, 2793-2795.
- Ikegame, K., Mochinaga, T., Terada, A., Tokujyu, S., Takano, H., Uchida, K., Igarashi, H., Ushioda, H., and Sakai, S. (1985). Effect of gram-negative bacteria on the growth of Staphylococcus aureus and production of enterotoxin in foods [Syokuhincyu niokeru budoukyukin to enterotokishin sansei ni oyobosu guramuinseikin no eikyo]. Jpn. J. Food Microbiol (Nippon Shokuhin Biseibutsu Gakkai Zasshi)., 2, 92-96 (in Japanese).
- Lima, G.C., Loiko, M.R., Casarin, L.S., and Tondo, E.C. (2013). Assessing the epidemiological data of Staphylococcus aureus food poisoning occurred in the State of Rio Grande do Sul, Southern Brazil. Braz. J. Microbiol., 44, 759-763.
- Mah, R.A., Fung, D.Y.C., and Morse, S.A. (1967). Nutritional requirements of Staphylococcus aureus S-6. Appl. Mictobiol., 15, 866-870.
- Marshall, J.H. and Wilmoth, G.J. (1981a). Proposed pathway of triterpenoid carotenoid biosynthesis in Staphylococcus aureus: evidence from a study of mutants. J. Bacteriol., 147, 914-919.
- Marshall, J.H. and Wilmoth, G.J. (1981b). Pigments of Staphylococcus aureus, a series of triterpenoid carotenoids. J. Bacteriol., 147, 900-913.
- Niskanen, A. and Aalto, M. (1978). Comparison of selective media for coagulase-positive enterotoxigenic Staphylococcus aureus. Appl. Environ. Microbiol., 35, 1233-1236.
- Onoue, Y. and Mori, M. (1997). Amino acid requirements for the growth and enterotoxin production by Staphylococcus aureus in chemically defined media. Int. J. Food Microbiol., 36, 77-82.
- Rasooly, A. and Rasooly, R.S. (1998). Detection and analysis of staphylococcal enterotoxin A in food by Western immunoblotting. Int. J. Food Microbiol., 41, 205-212.
- Roessler, E.B., Pandborn, R.M., Sidel, J.L., and Stone, H. (1978). Expanded statistical tables for estimating significance in paired-preference, paired-difference, duo-trio and triangle tests. J. Food Sci., 43, 940-947.
- Seo K.S. (2016). Superantigens: Methods and Protocols., Chapter 11, Monkey feeding assay for testing emetic activity of staphylococcal enterotoxin, Springer, New York, pp. 125-131.
- Shimamura, Y., Kidokoro, S., and Murata, M. (2006). Survey and properties of Staphylococcus aureus isolated from Japanese-style desserts. Biosci. Biotechnol. Biochem., 70, 1571-1577.
- Shimamura, Y. and Murata, M. (2008). Relationship among properties of Staphylococcus aureus isolated from retail foods and human hands, and distribution of MRSA. Food Sci. Technol. Res., 14, 513-518.
- Shimamura, Y. and Murata, M. (2009). Evaluation of identification methods for Staphylococcus aureus and development of modified detection methods for staphylococcal enterotoxin A. Food Sci. Technol. Res., 15, 89-94.
- Shinagawa, K. (1974). Examination of staphylococcal enterotoxin [Budoukyûkin Enterotokishin no kensa.] Japanese Journal of Bacteriology (Nippon Saikingaku Zasshi), 29, 336-344 (in Japanese).
- Stone, H., Bleibaum, R.N., and Thomas, H.A. (2012). Sensory Evaluation Practices, 4th edition. Chapter 5, Discrimination Testing, Academic Press, UK, pp. 176-178.
- Taylor, D. and Holland, K.T. (1989). Amino acid requirements for the growth and production of some exocellular products of Staphylococcus aureus. J. Appl. Bacteriol., 66, 319-329.
- Tsutsuura, S., Shimamura, Y., and Murata, M. (2013). Temperature dependence of the production of staphylococcal enterotoxin A by Staphylococcus aureus. Biosci. Biotechnol. Biochem., 77, 30-37.
- Uehara, S., Katoh, R., Matsushita, S., Kobayashi, M., Suzuki, Y., Higuchi, Y., Chiba, T., Takahashi, Y., Yamamoto, K., Hirai, A., Nakama, A., Sadamasu, K., and Kai, A. (2014). Bacteriological study on boxed lunches ‘Bento’ sold in Tokyo. Annual Report Tokyo Metropolitan Institute of Public Health (Toukyoutoritsu Eisei Kenkyujo Kenkyuu Nenpou), 65, 121-127 (in Japanese).
- http://www.mhlw.go.jp/stf/seisakunitsuite/bunya/kenkou_iryou/shokuhin/syokuchu/04.html (in Japanese) (May 28, 2016)