Original papers
Influence of the Number of Chewing Cycles on the Sweetness and Saltiness Intensity of Agarose Gel
2017 Volume 23 Issue 3 Pages 437-448
Details
2017 Volume 23 Issue 3 Pages 437-448
In this study, we investigated the relationship between the size of food pieces generated by chewing and the taste intensity during mastication, using cubic gels of two sizes made from agarose of different molecular weights. The intensities of both sweetness and saltiness increased to peak intensity and then decreased with increasing number of chewing cycles, irrespective of the gel sample size and of the molecular weight of agarose gels used. The suppression of sweet taste release was strong with high molecular weight agarose gels with a large pre-ingestion size. In the large pre-ingestion size gel, agarose of higher molecular weight required larger differences in gel fragment size for perception of significant differences in the sweetness intensity than agarose of lower molecular weight. The sodium chloride concentration eluted from agarose gel and the perception of taste was positively correlated in the early stage of mastication, but negatively correlated in the late stage.
Taste intensity is an important consideration in the food industry. Hydrocolloids contained in food influence the release of taste components. Taste intensity has been found to be lowered by increases in the viscosity and elasticity of food, through the suppressed release of taste components (Pangorn et al., 1973, 1974, 1978; Braines and Morris, 1987; Jaime et al., 1993; Morris, 1994; Guinard and Marty, 1995; Harrison and Hills, 1996; Wilson and Brown, 1997; Beak et al., 1993; Moritaka and Naito, 2002). However, enhanced intensities of some flavor components have been reported in gelatinous foods (Pangorn et al., 1974; Yamaguchi, 1980). Many studies to date have investigated the flavor/taste intensity in liquid (Pangorn et al., 1973, 1974, 1978; Braines and Morris, 1987), semi-solid, or solid foods (Lundgren et al., 1986; Jaime et al., 1993; Morris, 1994; Guinard and Marty, 1995; Harrison and Hills, 1996; Wilson and Brown, 1997; Beak et al., 1993; Moritaka and Naito, 2002).
We previously examined bitterness from caffeine, sweetness from aspartame, and saltiness from sodium chloride in gels containing various concentrations of agar and gelatin, in order to uncover the relationship between taste intensity and the mechanical characteristics of agar and gelatin gels (Moritaka and Naito, 2002). We found that changes in the suppression of taste intensity relative to the changes in agar concentration were significantly smaller for saltiness than for bitterness, and that those changes relative to the changes in gelatin concentration were small in all three tastes. In agar and gelatin gels, saltiness was suppressed to a significantly lesser extent than the other tastes.
It has been reported that in humans, saltiness is perceived when sodium ions permeate through ionotropic receptors (Weiss et al., 2011). One such possible sodium channel is the amiloride-sensitive epithelial sodium channel (ENaC) (Ninomiya and Sigemura, 2004). Sweetness as well as umami is perceived through the T1R family of G-protein-coupled receptors possessing seven transmembrane domains. The T1R family members have T1R1, T1R2, and T1R3 subunits, and the T1R2-T1R3 heterodimer serves as a receptor for sugars and proteins with a sweet taste (Zhao et al., 2003; Nelson et al., 2001, 2002).
However, the size of the ingested food piece varied in previous studies (Kitade et al., 2012, 2013, 2014) and very few studies reported the influence of the size of the food piece on the taste intensity of gels made from agarose samples of different molecular weights. Here, we investigated the relationship between the size of food pieces generated by chewing and the taste intensity during mastication.
Samples Three types of agarose with different molecular weights (Wako Pure Chemical Industries, Ltd., Kyoto, Japan; AGa (Lot. CR119), AGb (Lot. CV211), and AGc (Lot. CV201), sulfur content: less than 0.30%) were used to prepare 2.0% agarose gels. The melting temperature of agarose gels was measured by the falling ball method at a heating rate of 0.2°C/min. The molecular weight was measured using gel permeation chromatography (GPC) (HLC-8120 GPC; Tosoh Co., Ltd., Tokyo, Japan). Agarose was solved at 95°C and filtered using a 0.45 mm filter just before GPC measurements. Aqueous 0.1 M NaCl was used as the carrier solvent at a flow rate of 1 mL/min. The inlet and column temperatures were 60°C. GPC calibrations were performed using the Pullulan standard P-82 (Showa Denko, Co., Ltd., Tokyo, Japan), with both the inlet and column temperature set at 35°C.
To prepare sample gels, 2.0% agarose suspension was swollen at room temperature for 1 h and then heated at 90 – 95°C for 30 min. Then, 0.025% aspartame (sweetness) and 0.25% sodium chloride (saltiness) were separately added to the agarose at 65°C. The amounts of aspartame and sodium chloride were determined based on a preliminary study to ensure comparable sweetness and saltiness intensities. The mixture was cooled at room temperature for 2 h and then at 4 – 5°C for 24 h. Gel samples were cut into cubes with sides of 3 or 15 mm in length (hereafter, referred to as 3-mm gel and 15-mm gel). To clarify the effect of gel size before ingestion, the sample weight of 3-mm gel was determined to be the same as the weight of 15-mm gel. The concentration of sodium chloride was 3.0% upon measurement with a salinometer (PAL-ES2; Atago Co., Ltd., Tokyo, Japan). All chemicals were purchased from Wako Pure Chemical Industries Ltd. unless otherwise stated.
Participants Twelve female university students, all in their twenties, participated in the preliminary study; 10 of whom went on to participate in the present study. Each participant underwent a set of experiments (sensory evaluation for intensity of sweetness and saltiness, and measurements of post-mastication sizes and sodium chloride release). This study was approved by the ethics committee of Showa Women's University and was conducted in accordance with the Declaration of Helsinki (approval number: 12–14).
Fracture properties A desktop unconfined compression tester (EZ-Test; Shimadzu Corp., Kyoto, Japan) with an acrylic resin plunger 20 mm in diameter was used to compress a 15-mm gel sample to 95% of its original height. Five compression rates (0.02, 0.1, 1, 10, and 16 mm/s) were used to determine fracture stress, fracture strain, and fracture energy at 25°C. Fracture was defined as the point where the stress sharply and greatly drops in the stress-strain curve. At this point, the gel was completely broken.
Sensory evaluation Three reference solutions were used for scaling of taste: water (taste intensity score 0), 0.025% aspartame solution (sweetness taste intensity score 7), and 0.25% sodium chloride solution (saltiness taste intensity score 7). After 3-mm or 5-mm gel sample fragments were chewed for 1, 3, 5, 10, 15, 20, 25, 30, 40, or 50 chewing cycles, taste intensity was sequentially scored using the following scale: 0 (no taste), 1 (very weak), 2 (weak), 3 (slightly weak), 4 (neither weak nor strong), 5 (slightly strong), 6 (strong), and 7 (very strong). The chewing speed was 2 chews/s throughout. Subjects were instructed to not swallow the sample for up to 50 chewing cycles. After a complete cycle of chewing, participants were asked to removing the remaining sample from the mouth and rinse the oral cavity thoroughly with water. This test procedure was repeated 6 times per participant for one sample, and the results of 5 tests were used for analysis.
Sizes of gel fragments after mastication Three-mm or 15-mm gel samples made from AGa, AGb, or AGc were recovered after 1, 3, 5, and 10 chewing cycles for post-mastication size measurement. Each participant repeated the procedure shown below to obtain at least 1 000 gel fragments in total. Thus, the number of gel fragments chewed by the 10 participants was more than 10 000. Chewed gel samples were spat directly from the mouth onto a sieve (18-8 stainless steel, number 50 mesh). After thoroughly rinsing the oral cavity with water, the contents of the mouth were spat onto the sieve to recover any gel fragments. The recovered fragments of chewed samples were rinsed with deionized water to remove attached saliva, stained with Food Blue no. 2 (Tokyo Chemical Industry Co., Ltd., Tokyo, Japan), and scanned (PM-A840, Seiko Epson Corp., Nagano, Japan). Acquired images were imported to a personal computer and compressed with Microsoft Office Picture Manager, and the size of gel fragments was measured with Image J image processing software. Ten thousand pieces were arranged from largest to smallest and divided into 20 groups, and then the mean size of each group was obtained (Group 1> Group 2> ------> Group 19> Group 20) (Kitade et al., 2013). Since it was extremely difficult to determine the surface area of the gel fragment, the area of each gel fragment was simplified as the area of the smallest circle to completely contain the gel fragment (Kitade et al., 2012).
Concentration of sodium chloride The amount of saliva was determined by subtracting the weight of the gel prior to chewing from the weight of the bolus after chewing at 3, 10, 20, 30, and 50 chewing cycles (sodium chloride content, 3.0%). An amount of water was added to make a 10-fold dilution of saliva. After filtering through a sieve (18-8 stainless steel, number 50 mesh), the concentration of sodium chloride in the diluted saliva was measured using a salinometer (PAL-ES2; ATAGO Co., Ltd. Tokyo, Japan). Sodium could not be detected in the saliva. The increasing ratio was obtained by dividing the subtracted amount of sodium chloride from the previous mastication by the amount of sodium chloride of the previous mastication.
Statistical analysis Three-way analysis of variance was performed for taste intensity, saliva amount and sodium chloride concentration, and then two-way analysis of variance was performed with respect to the value of fracture property, using SPSS16.0J, and differences between two sample-groups were examined using Tukey's test. A p-value < 0.05 was considered statistically significant.
Sample The melting temperatures of 7.2% AGa-gel and 7.9% AGb-gel were 90.5 – 92°C, and that of 6.6% AGc-gel was 78°C. The molecular weight of agarose was the largest in AGa, followed by AGb, and then AGc. (Fig. 1).

Molecular weight of three types of agarose
Fractureproperties Fig. 2 shows the effect of the compression rate on fracture properties of AGa-15-mm, AGb-15-mm, and AGc-15-mm gel samples. The main effects of gel type and the number of chewing cycles were significant respectively. In the fracture stress and fracture energy, an interaction was observed between the gel type and the compression rate.

Fracture properties of 3 kinds of 15×15×15 mm3 agarose gel
AGa: 0.02<0.1<1<10<16 mm/s, AGb: 0.02<0.1<1<10•16 mm/s, AGc: 0.02•0.1<1<10•16 mm/s
0.02 mm/s: AGa>AGc, 0.1∼16 mm/s: AGa>AGb•AGc, AGb>AGc
AGa: 0.1<1<10•16 mm/s, AGb: 0.1•1<10•16 mm/s, AGc: 0.1<10•16 mm/s
0.02•16 mm/s: AGa>AGb•AGc, 0.1∼10 mm/s: AGa>AGb•AGc
AGa: 0.02•0.1<1<10<16 mm/s, AGb: 0.02•0.1•1<10<16 mm/s
0.02 mm/s: AGa>AGc, 0.1 mm/s: AGa>AGb•AGc, 1∼16 mm/s: AGa>AGb•AGc, AGb>AGc
● : AGa-15 mm gel, ■ : AGb-15 mm gel, ▲ : AGc-15 mm gel
Because the concentrations of aspartame and sodium chloride were extremely low and the sulfur content of agarose was less than 0.30%, the fracture properties of the agarose gel were not affected by the addition of aspartame and sodium chloride. The fracture stress of AGa-15-mm gel increased with increasing compression rate (Fig. 2a). The fracture stress of AGb-15-mm gel did not significantly change from 10 mm/s to 16 mm/s; similarly, that for AGc-15-mm gel did not significantly change from 0.02 mm/s to 1.0 mm/s and from 10 mm/s to 16 mm/s (Fig. 2a). The fracture stress of AGa-15-mm gel was significantly larger than that of an AGc-15-mm gel at a compression rate of 0.02 mm/s. At other compression rates, the fracture stress of AGa-15-mm gel was consistently the highest, while that of AGc-15-mm gel was always the lowest; the differences among the three different gel types were significant.
There were no significant differences in fracture strain between the compression rate of 10 mm/s and that of 16 mm/s, regardless of Fig. 1. Molecular weight of three types of agarose agarose type (Fig. 2b). The fracture strain of AGb-15-mm and AGc-15-mm gels did not significantly differ between the compression rates of 0.1 mm/s and 1 mm/s. The fracture strain at 1 mm/s for all types of agarose gel was significantly smaller than those at 10 mm/s and 16 mm/s. At compression rates of 0.02 mm/s and 16 mm/s, fracture strain of AGa-15-mm gel was significantly higher than that of AGb-15-mm gel, which was significantly higher than that of AGc-15-mm gel. In a compression rate range of 0.1 mm/s, 1 mm/s, and 10 mm/s, fracture strain of AGa-15-mm gel was significantly higher than those of AGb-15-mm and AGc-15-mm gels. The standard deviations of fracture strain at a compression rate of 0.02 mm/s were larger than those at other compression rates. This result might be attributable to the non-uniformity of fractures, because the fracture process may be changed by various factors under compression at low rates.
The fracture energy of AGa-15-mm and AGb-15-mm gels did not change from 0.02 mm/s to 0.1 mm/s, and that of AGc-15-mm gel did not change for all compression rates (Fig. 2c). Otherwise, the fracture energy among the other compression rates increased with increasing compression rate. Changes in the fracture energy with increasing compression rate were largest in AGa-15-mm gel. The fracture energy of AGa-15-mm gel was significantly higher than that of AGc-15-mm gel at compression rates of 0.02 mm/s and 0.1 mm/s, and higher than that of AGb-15-mm gel at a compression rate of 0.1 mm/s. At compression rates of 1 – 16 mm/s, the fracture energy of AGa-15-mm gel was significantly higher than that of AGb-15-mm gel, which was significantly higher than that of AGc-15-mm gel.
These results show that the effect of the different types (molecular weights) of agarose on all fracture properties was more prominent at faster compression rates. Considering that the lower jaw closes during mastication at a speed greater than 16 mm/s (Pangorn et al., 1973), the differences in fracture properties among the three types of agarose gel are expected to be larger during actual mastication than those observed in this experiment.
Sweetness intensity The relationship between the sweetness intensity and the number of chewing cycles is shown in Fig. 3. The main effects of gel type, size of pre-ingestion gel and the number of chewing cycles were significant respectively. An interaction was not observed between the gel type, the size of pre-ingestion gel and the number of chewing cycles. In the same number of chewing cycles, the sweetness intensities in each of 15-mm gels (Fig. 3a) and 3-mm gels (Fig. 3b) were not significantly different among AGa, AGb, and AGc gels.

Sweetness intensity of agarose gel with chewing cycle
● : AGa-15 mm gel, ■ : AGb-15 mm gel, ▲ : AGc-15 mm gel
● : 1<10∼50, 3<10∼40, 5<15∼30, 50<20•25 chewing cycles
■ : 1<5∼50, 3<10∼30, 5<15—25, 50<15∼25 chewing cycles
▲ : 1<5∼50, 3<10∼30, 5<15•20, 50<15∼25 chewing cycles
○ : AGa-3 mm gel, □: AGb-3 mm gel, △: AGc-3 mm gel
○ : 1<5∼40, 3<10∼30, 5<15•20, 40<15•20, 50<10∼30 chewing cycles
□ : 1<5∼40, 3<10∼30, 5<15•20, 40<15•20, 50<10∼30 chewing cycles
△ : 1<5∼40, 3<10∼25, 5<15, 40<15•20, 50<10∼30 chewing cycles
1—15 chewing cycles : AGc-3 mm gel > AGa-15 mm gel
AGa, 1—15 chewing cycles : 3 mm gel > 15 mm gel
AGb, 1 chewing cycle : 3 mm gel > 15 mm gel
AGc, 5 chewing cycles : 3 mm gel > 15 mm gel
(p > 0.05, n=50)
In 15-mm gels, the sweetness intensity after 1 chewing cycle was significantly lower than that after 10 – 50 chewing cycles for AGa gel, and that after 5 – 50 chewing cycles for AGb and AGc gels (Fig. 3a). Similarly, the sweetness intensity after 3 chewing cycles was significantly lower than that after 10 – 40 chewing cycles for AGa gel and those after 10 – 30 chewing cycles for AGb and AGc gels. The sweetness intensity after 5 chewing cycles was significantly lower than that after 15 – 30 chewing cycles for AGa gel, that after 15 – 25 chewing cycles for AGb gel, and that after 15 and 25 chewing cycles for AGc gel. The sweetness intensity after 50 chewing cycles was significantly lower than that after 20 and 25 chewing cycles for AGa gel and lower than those after 15 – 25 chewing cycles for AGb and AGc gels. These results suggest that the changes in the sweetness intensity with increasing number of chewing cycles were moderate in 15-mm gels prepared from high molecular weight agarose, but were more rapid in 15-mm gels prepared from lower molecular weight agarose. This may be influenced by the fact that gels made from high molecular weight agarose retain more water than those from low molecular weight agarose.
In 3-mm gels, the sweetness intensity after 1 chewing cycle was significantly lower than that after 5 – 40 chewing cycles irrespective of the molecular weight of agarose (Fig. 3b). The sweetness intensity after 3 chewing cycles was significantly lower than those after 10 – 30 chewing cycles for AGa and AGb gels and that after 10 – 25 chewing cycles for AGc gel. The sweetness intensity after 5 chewing cycles was significantly lower than those after 15 and 20 chewing cycles for AGa and AGb gels and that after 15 chews for AGc gel. The sweetness intensity after 40 chewing cycles was significantly lower than that after 15 and 20 chewing cycles; and similarly, that after 50 chewing cycles was significantly lower than that after 10 – 30 chewing cycles, irrespective of the molecular weight of agarose. In 15-mm gel, there was no significant difference in the sweetness intensity between 40 chewing cycles and those of the other chewing cycles in any type of gel. Furthermore, a difference in the sweetness intensity between 50 chewing cycles and 10 chewing cycles was not observed in 15 mm gel. From these results, we suggest that the rate of decrease of sweetness intensity in the chewing process of 3-mm gel is faster than that in 15-mm gel.
In addition, the sweetness intensity of AGa-15-mm gel was significantly lower than that of AGc-3-mm gel in 1 – 15 chewing cycles (Fig. 3c). The sweetness intensity of 15-mm gel was significantly lower than that of 3-mm gel after 1 – 15 chewing cycles for AGa gel, that after 1 chewing cycle for AGb gel, and that after 5 chewing cycles for AGc gel. These results suggested that the sweetness intensity in chewing tends to be higher in gels with smaller molecular weight and with smaller pre-ingestion gel size than in gels with higher molecular weight and with large gel size.
Saltiness intensity The relationship between the saltiness intensity and the number of chewing cycles is shown in Fig. 4. The main effects of gel type, size of pre-ingestion gel and the number of chewing cycles were significant respectively. An interaction was not observed between the gel type, the size of pre-ingestion gel and the number of chewing cycles. In the same number of chewing cycles, the saltiness intensity of 15-mm gel did not significantly differ among AGa, AGb, and AGc gels. For the saltiness intensity of 3-mm gel, the results were similar to that of 15-mm gel. Sala and Stieger (2013) reported that the sweetness intensity of gels with small fracture strain was greater than that of gels with large fracture strain. However, in the present study, there was no difference in saltiness intensity among AGa, AGb, and AGc gels (Fig. 2b). Similar results were obtained for sweetness intensity.

Saltiness intensity of agarose gel with chewing cycle
● : AGa-15 mm gel, ■ : AGb-15 mm gel, ▲ : AGc-15 mm gel
● : 1<5—25, 30<15, 40<10—25, 50<5—25 chewing cycles
■ : 1<5—25, 3<10•15, 30<10•15, 40<5—25, 50<3—30 chewing cycles
▲ : 1<5—20, 30<10•15, 40<5—20, 50<3—30 chewing cycles
○ : AGa-3 mm gel, □ : AGb-3 mm gel, △ : AGc-3 mm gel
○ : 1<10•15, 30<10•15, 40<3—20, 50<1—30 chewing cycles
□ : 1<5—20, 30<10•15, 40<3—25, 50<3—30 chewing cycles
△ : 1<10•15, 30<10—20, 40<3—25, 50<1—30 chewing cycles
1—3 chewing cycles : AGc-3 mm gel > AGa-15 mm gel
AGa, 1 chewing cycle : 3 mm gel > 15 mm gel
AGc, 1 chewing cycle : 3 mm gel > 15 mm gel
(p > 0.05, n=50)
In 15-mm gels, the saltiness intensity after 1 chewing cycle was significantly lower than those after 5 – 25 chewing cycles for AGa and AGb gels and that after 5 – 20 chewing cycles for AGc gel (Fig. 4a). The saltiness intensity after 3 chewing cycles was significantly lower than that released after 10 and 15 chewing cycles for AGb gel, while it was not significantly different from that of other chewing cycles for AGa and AGc gels. The saltiness intensity after 30 chewing cycles was significantly lower than that after 15 chewing cycles for AGa gels, and those after 10 and 15 chewing cycles for AGb and AGc gels. The saltiness intensity after 40 chewing cycles was significantly lower than that after 10 – 25 chewing cycles for AGa gel, than that after 5 – 25 chewing cycles for AGb gel, and that after 5 – 20 chewing cycles for AGc gel. The saltiness intensity after 50 chewing cycles was significantly lower than that after 5 – 25 chewing cycles for AGa gel and those after 3 – 30 chewing cycles for AGb and AGc gels. These results suggest that the effect of mastication was more prominent in the decreasing stage of saltiness intensity than in the increasing stage.
In 3-mm gels, the saltiness intensity after 1 chewing cycle was significantly lower than those after 10 and 15 chewing cycles for AGa and AGc gels and that after 5 – 20 chewing cycles for AGb gel (Fig. 4b). The saltiness intensity after 30 chewing cycles was significantly lower than those after 10 and 15 chewing cycles for AGa and AGb gels and that after 10 – 20 chewing cycles for AGc gel. The saltiness intensity after 40 chewing cycles was significantly lower than that after 3 – 20 chewing cycles for AGa gel and those after 3 – 25 chewing cycles for AGb and AGc gels. The saltiness intensity after 50 chewing cycles was significantly lower than those after 1 – 30 chewing cycles for AGa and AGc gels and that after 3 – 30 chewing cycles for AGb gel. Taken together, the incremental increases in saltiness intensity in the early stage of mastication were smaller than the decreases in saltiness intensity in the late stage. The effect of the molecular weight of agarose on the saltiness intensity of 3-mm gels was more prominent in the middle and late stages of mastication than in the early stage.
When AGa and AGc were used for gel preparation, the saltiness intensities of 15-mm gels were significantly lower than those of 3-mm gels after 1 chewing cycle (Fig. 4c). The mean saltiness intensities after 1 – 3 chewing cycles from 15-mm gels of all agarose types were significantly lower than those after corresponding chewing cycles from 3-mm gels of all agarose types (data not shown).
As shown in Fig. 3, a significant increase in sweetness intensity was observed until 5 chewing cycles. However, a significant increase in saltiness intensity was observed only at 1 chewing cycle (Fig. 4). Fewer chewing cycles may be required to reach maximum saltiness intensity than maximum sweetness intensity. A significant decrease in sweetness intensity was observed at 50 chewing cycles for 15-mm gel and at 40 chewing cycles for 3-mm gel. However, a significant decrease in saltiness intensity was observed from 30 chewing cycles for both 15-mm and 3-mm gels. The decline in taste intensity was sharper with saltiness than with sweetness. Saliva plays an important role in transporting taste molecules to taste receptors. Hirasawa et al. (2000) reported that the saliva secretion speed was fastest for sourness during mastication of chewing gum containing taste components (sweetness, saltiness, sourness, and bitterness), followed by saltiness, sweetness, and then bitterness, and that the saliva secretion speed increased as the content of each taste component increased. Heizerling et al. (2011) reported significant decreases in perception with increasing salivary flow rates for citric acid and sodium chloride, which they explained partially by a dilution effect. However, they reported that bitterness and sweetness were unaffected by salivary conditions. It has been reported that saltiness is perceived via permeation of sodium ions through ionotropic receptors, one of which is thought to be ENaC (Ninomiya and Sigemura, 2004). Sweetness is instead perceived through the T1R family of G-protein-coupled receptors with 7 transmembrane domains, which are also involved in the perception of umami. The T1R family members have T1R1, T1R2, and T1R3 subunits, and the T1R2-T1R3 heterodimer is reported to serve as a receptor of sugars and sweet-tasting proteins (Zhao et al., 2003; Nelson et al., 2001, 2002). Differences in the mechanism of perception may be related to the differences in the results of saltiness and sweetness; however, this issue should be explored in more detail in a future study.
Sizes of gel fragments after mastication Fig. 5 shows the ratio of the number of fragments of a given size relative to the total number of gel fragments recovered after 1, 3, 5, and 10 chewing cycles in AGa-15-mm, AGb-15-mm, and AGc-15-mm gels. The ratio of the number of large-size fragments (fragment size ≥1.00 cm2) was high when there was a low number of chewing cycles, and then decreased with increasing number of chewing cycles. The ratio of large-size fragments (fragment size ≥1.00 cm2) was larger with AGa-15-mm gels than with AGb-15-mm and AGc-15-mm gels, indicating that AGa-15-mm gels were more difficult to break into small fragments than AGb-15-mm and AGc-15-mm gels.

Size area of chewed fragments for 15x15x15 mm3 agarose gel with numbers of chewing cycles
a) 1 chewing cycle, b) 3 chewing cycles, c) 5 chewing cycles, d) 10 chewing cycles
● : AGa-15 mm gel, ■ : AGb-15 mm gel, ▲ : AGc-15 mm gel
ns: Number of size, NT: Total number of fragments
Fig. 6 shows the ratio of the number of fragments of a given size relative to the total number of gel fragments recovered after 1, 3, 5, and 10 chewing cycles in AGa-3-mm, AGb-3-mm, and AGc-3-mm gels. Fragments of sizes between 0.8 cm2 and 0.16 cm2 were most common at 1 chewing cycle (Fig. 6a) or 3 chewing cycles (Fig. 6b). Although 15-mm gels showed higher mastication efficiency than 3-mm gels, the ratio of the number of large-size fragments (fragment size ≥1.00 cm2) remained higher with 15-mm gels, but not with 3-mm gels, even after 10 chewing cycles. Kitade et al. reported that gel fragments of large size were destroyed by mastication more effectively than those of small size (Kitade et al., 2013), which is in agreement with our findings in the present study.

Size area of chewed fragments for 3×3×3 mm3 agarose gel with numbers of chewing cycles
a) 1 chewing cycle, b) 3 chewing cycles, c) 5 chewing cycles, d) 10 chewing cycles
◯ : AGa-3 mm gel, □: AGb-3 mm gel, △: AGc-3 mm gel
ns: Number of size, NT: Total number of fragments
Mean sizes of 20 gel fragment groups The gel fragments were arranged in a line from largest to smallest for each agarose type and were divided into 20 groups (Group 1> Group 2> ------> Group 20). The mean size of each group was calculated to examine its relationship with the number of chewing cycles.
In 15-mm gels (Fig. 7), changes in the mean fragment size with increasing number of chewing cycles was largest in the group with the largest gel fragment size (Group 1), irrespective of the molecular weight of agarose. In this group, the size of gel fragments exponentially decreased with increasing number of chewing cycles, and the exponential decrease changed after 3 – 5 chews (crossover structure), indicating that there are two regions where the relationship between the number of chewing cycles and gel fragment size was distinct. However, the exponential decrease with increasing number of chewing cycles was small in small-sized gel fragment groups, and crossover structure was not observed. The slope of exponential decline in the fragment size was steeper in the early stage of mastication than in the late stage, suggesting that 15-mm agarose gels were broken down effectively in the early stage.

Relation between chewed fragments size for 15×15×15 mm3 agarose gel and chewing cycle
a)•a') AGa-15 mm gel, b)•b') AGb-15 mm gel, c)•c') AGc-15 mm gel
●—:Gp1, ○—:Gp2, ●–·–:Gp3, ○—:Gp4, ●---:Gp5, △—:Gp6, ▲---:Gp7, △–·–:Gp8, ▲—:Gp9, △---:Gp10, ■—:Gp11, □---:Gp12, ■–·–:Gp13, □—:Gp14, ■---:Gp15, ◆—:Gp16, ◇---:Gp17, ◆–·–:Gp18, ◇—:Gp19, ◆---:Gp20 (Gp : Group)
In 3-mm gels (Fig. 8), a crossover structure was observed in gel fragment groups where mean sizes were small or medium-sized, but not in those where mean size was large. The absence of this crossover structure in large-sized gel groups may be explained by the tight distribution of the gel fragment size, while the presence of the crossover structure in small- and medium-sized gel groups may be explained by the broad distribution of gel fragments after mastication.

Relation between chewed fragments size for 3×3×3 mm3 agarose gel and chewing cycle
a)•a') AGa-3 mm gel, b)•b') AGb-3 mm gel, c)•c') AGc-3 mm gel
●—:Gp1, ○---:Gp2, ●–·–:Gp3, ○—:Gp4, ●---:Gp5, △—:Gp6, ▲---:Gp7, △–·–:Gp8, ▲—:Gp9, △---:Gp10, ■—:Gp11, □---:Gp12, ■–·–:Gp13, □—:Gp14, ■---:Gp15, ◆—:Gp16, ◇---:Gp17, ◆–·–:Gp18, ◇—:Gp19, ◆---:Gp20 (Gp : Group)
Relationship between the size of food fragments and the intensity of taste components Relationships between the size of gel fragments and the sweetness and saltiness intensities after 1 – 10 chewing cycles were investigated using the mean sizes of the largest-sized gel fragment group (Group 1) in the three agarose gels (AGa, AGb, and AGc), originally provided in two sizes (15-mm and 3-mm gels) (Fig. 9).

Relation between perceptual intensity and fragments size (Group 1) of agarose gel
Sweetness: a) 1 chewing cycle, b) 3 chewing cycles, c) 5 chewing cycles, d) 10 chewing cycles Saltiness: e) 1 chewing cycle, f) 3 chewing cycles, g) 5 chewing cycles, h) 10 chewing cycles
● : AGa-15 mm gel, ■ : AGb-15 mm gel, ▲ : AGc-15 mm gel, ○ : AGa-3 mm gel, □ : AGb-3 mm gel, △ : AGc-3 mm gel
The sweetness intensity of 15-mm gels was significantly higher in the mean fragment size of 0.4 cm2 (after 10 chews) than in that of 2.1 cm2 (after 1 chew) and 1.2 cm2 (after 3 chews), but not in that of 0.7 cm2 (after 5 chews), for AGa gel. However, the sweetness intensity of 15-mm gels was significantly higher in the mean fragment size of 0.3 cm2 (after 10 chews) than in those of 0.6 – 0.7 cm2 (after 3 chew) for AGb and AGc: it was also significantly higher in the mean fragment size of 0.3 cm2 (after 10 chews) than in that of 1.3 – 1.4 cm2 (after 1 chew) (Figs. 3a, 9). These results suggest that AGa-15-mm gel required larger differences in gel fragment size for perception of significant differences in sweetness intensity than did the AGb-15-mm and AGc-15-mm gels.
Although changes in the size of gel fragments of 3-mm gels were very small for AGa, AGb, and AGc gels, the sweetness intensity was significantly higher after 5 chewing cycles than after 1 chewing cycle, and also significantly higher after 10 chewing cycles than after 1 and 3 chewing cycles (Fig. 3b). These results suggest that the maximum mean size of gel fragments hardly affects the sweetness intensity of 3-mm gels. This is thought to be due to the fact that a 3-mm gel is not easily broken down further by chewing and that gels of the original size were still present after 10 chewing cycles.
The saltiness intensity of 15-mm gels after 5 and 10 chewing cycles was significantly higher than that after 1 chewing cycle, irrespective of gel type: the saltiness intensity of AGb gels after 3 chewing cycles was significantly lower than that after 10 chewing cycles (Fig. 4a). The saltiness intensity of 3-mm gels was significantly higher after 10 chewing cycles than after 1 chewing cycle, regardless of the molecular weight of agarose: the saltiness intensity of 3-mm AGb gels was significantly higher after 5 chews than after 1 chew (Fig. 4b). In both 3-mm and 15-mm gels, the differences in saltiness intensity due to the molecular weight of agarose and the size of gel fragments were not clear compared to the sweetness intensity. These results support our previous findings showing that suppression of taste perception in gelled foods was weaker with saltiness from sodium chloride than with other types of taste (Moritaka and Naito, 2002).
Sodium chloride concentrations eluted from the gels Concentrations of sodium chloride eluted during mastication from 15-mm and 3-mm gels (initial sodium chloride concentration, 3.0%) made from AGa, AGb, or AGc are shown in Fig. 10a, and the saliva weight corresponding to the number of chewing cycles is shown in Fig. 10b. The saliva weight increased with increasing chewing cycles, as did the concentration of sodium chloride eluted from the gels.
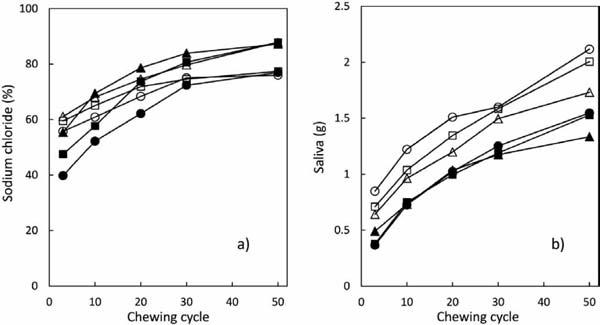
Saliva weight and sodium chloride concentrations eluted from agarose gel
a) Sodium chloride concentration eluted from gel, b) Secretion of saliva
● : AGa-15 mm gel, ■ : AGb-15 mm gel, ▲ : AGc-15 mm gel, ○ : AGa-3 mm gel, □ : AGb-3 mm gel, △ : AGc-3 mm gel
When the three types of 15-mm gels were compared at the same number of chewing cycles, the sodium chloride concentration after 3 chewing cycles was significantly highest in boluses from AGc gel, followed by AGb and then by AGa gels. The sodium chloride concentration eluted from 15-mm gels was significantly higher in AGc gels than in AGa and AGb gels after 10 chewing cycles, and was also significantly higher in AGb and AGc gels than in AGa gels after 20, 30, and 50 chewing cycles. The sodium chloride concentration eluted from 3-mm gels was significantly higher in AGb and AGc gels than in AGa gels after 3 and 10 chewing cycles; however, differences among the three different agarose gels were not significant when the number of chewing cycles exceeded 20.
Concentrations of eluted sodium chloride were significantly higher from 3-mm AGa gels than 15-mm AGa gels after 3 and 20 chewing cycles. Sodium chloride concentrations were significantly higher in boluses from 3-mm AGb gels than those from 15-mm AGb gels after 3 and 10 chewing cycles, but were significantly higher in boluses from 15-mm AGb gels than 3-mm AGb gels after 30 chewing cycles. Sodium chloride concentrations did not significantly differ between 15-mm and 3-mm AGc gels. From these results, the effect of type (molecular weights) of agarose on the concentration of sodium chloride is more prominent with 15-mm gels than with 3-mm gels. Three-mm gels have a larger surface area than 15-mm gels, and this may weaken the effect of different water retention capacities of agarose gels on the elution of sodium chloride.
The sodium chloride concentration eluted from gels (Fig. 10a) and saltiness intensity (Fig. 4) increased with increasing number of chewing cycles in the early stage of mastication, indicating the correlation between the sodium chloride concentration eluted from gels and saltiness intensity. However, this correlation was absent in the late stage of the mastication process, as the sodium chloride concentration eluted from the gels continuously increased, but the saltiness intensity decreased with increasing number of chewing cycles. Thus, the increasing ratio of sodium chloride concentration was calculated to determine the source of the above differences between early and late stages of the mastication process.
The increasing ratio of 15-mm and 3-mm gels made from AGa, AGb, and AGc are shown in Fig. 11. The increasing ratio changed with the number of chewing cycles; however, the increasing ratio after 50 chewing cycles was the smallest regardless of gel sample size and molecular weight of agarose. The decline of increasing ratio in the sodium chloride concentration is thought to be a possible reason for the decline in taste perception with increasing number of chewing cycles. In addition, various causes such as the attenuation in excitement of the sensory organs by repetitive stimulation and the influence of saliva may also contribute to the decline. Further research is necessary to explore these points.

The increasing ratio of sodium chloride eluted from agarose gel
a) 15×15×15 mm3 gel, ● : AGa-15 mm gel, ■ : AGb-15 mm gel, ▲ : AGc-15 mm gel
b) 3×3×3 mm3 gel, ○ : AGa-3 mm gel, □ : AGb-3 mm gel, △ : AGc-3 mm gel
In this study, we examined the relationship between the size of gels (cubes with 3 or 15 mm length of sides: 3-mm and 15-mm gels, respectively) made from three types of agarose—AGa, AGb, and AGc (molecular weight, AGa>AGb>AGc)—with the intensities of sweetness and saltiness released after 1-50 chewing cycles. Both the 3-mm and 15-mm gels used in the experiment were of the same weight. The intensities of both sweetness and saltiness increased to peak intensity and then decreased with increasing number of chewing cycles, irrespective of the gel sample size and the molecular weight of agarose. The suppression of sweetness intensity was strong with high molecular weight agarose gels with a large pre-ingestion size. The relationship between the sweetness intensity and the maximum mean size of gel fragments originating from 15-mm gels revealed that larger differences in gel fragment size of the high molecular weight agarose were required to perceive significant differences in the sweetness intensity than were required in agarose with a lower molecular weight. However, the differences in saltiness intensity due to the molecular weight of agarose and the size of gel fragments were not clear. The sodium chloride concentration eluted from gels and the perception of taste were positively correlated in the early stage of mastication, but negatively correlated in the late stage. The decline of the increasing ratio in sodium chloride concentration may be one possible reason for the decline in taste perception with increasing number of chewing cycles.