Abstract
Hydrolyzed leather protein (HLP), which is collagen extracted from leather scraps, was intentionally added into dairy products by some illegal dairy producers and has caused food safety scares in China. In this study, near-infrared (NIR) spectroscopy and chemometric analysis were employed to detect HLP adulteration in infant formula. Infant formula adulterated with HLP powder can be well discriminated from authentic samples by using soft independent modelling of class analogy (SIMCA) method. Furthermore, partial least squares regression (PLS) and support vector regression (SVR) models were developed, optimized and compared for quantitative analyses of HLP adulteration concentrations. The SVR modelling method has demonstrated a better predicted capacity than PLS, and a relatively high (7.42) ratio of prediction (RPD) can be achieved. NIR spectroscopy coupled with the chemometric analysis technique could be a useful tool for simple, rapid, economical and non-destructive detection of HLP adulteration in dairy products.
Introduction
Hydrolyzed leather protein (HLP) is collagen extracted from leather scraps, which can be used as leather filler or animal feed additive. In 2011, it was reported that HLP was intentionally added into dairy products, including liquid milk, milk powder and infant formula, by some illegal dairy producers, in order to boost the apparent protein content (Dong et al., 2012; Liu et al., 2014). People who drink such adulterate dairy products will be at great risk for osteoporosis and heavy metal (Cr) poisoning, because a large amount of potassium dichromate and sodium dichromate are added during the tanning and dyeing process of leather (Huang and Wu, 2011; Liu et al., 2014). It is well known that dairy products adulterated with melamine caused global food safety scares in 2008, which have attracted extensive concern from researchers and many effective detection methods have been developed ever since (Balabina and Smirnovb, 2011; Lim et al., 2016; Tyan et al., 2009). However, there are only a few reports mentioning the HLP in dairy products, which is more difficult to detect due to the similar animal protein constituents in the HLP and in milk (Dong et al., 2012).
As revealed by previous reports, HLP is usually measured by detecting Hydroxyproline (Hyp), which is found almost exclusively in collagen and can be used as a marker of the collagen content. Most of the methods detecting Hyp are chromatography-based, such as high-performance liquid chromatography (HPLC) (Conventz et al. 2007; Kakinuma et al., 2005), gas chromatography (GC) (Kataoka et al., 1993), and micellar electrokinetic chromatography (MEKC) (Dong et al., 2012). These methods are highly sensitive, but time-consuming, expensive, require complicated sample pretreatments and well-trained technicians. Therefore, it's necessary to develop a quick, simple, and economical method for detecting HLP in dairy products.
Near-infrared (NIR) spectroscopy is an useful analytical tool which has been widely used in studies of food science (Bellincontro et al., 2012; Cevoli et al., 2013; Chen et al., 2008; Graham et al., 2012; Nordon et al., 2008; Pissard et al., 2013; Travers et al., 2014), medical (Hoshi, 2007; Taubes, 1997), pharmaceutical (Blanco et al., 1998 a, b) and petroleum industries (Balabin and Safieva, 2007; Felizardo et al., 2007). It has advantages in simpleness in sample preparation and testing, real-time response, relatively low-cost instrument, non-destructive and environmentally friendly analysis. Quite a few efforts have been made to detect adulterants in dairy products by combining NIR spectroscopy and chemometric algorithms (Borin et al., 2006; Botros et al., 2013; Fuentea and Juáreza, 2005; Harnly et al., 2014; Hsieh et al., 2011; Santos et al., 2013; Zhang et al., 2014). For instance, Capuano et al. (2015) detected acid whey, starch, and maltodextrin in skim milk powder by class modelling and PLS regression method. Balabin et al. (2011) detected melamine in liquid milk, infant formula and milk powder by mid- and near-infrared (MIR/NIR) spectroscopy. Several regression models, such as partial least squares regression (PLS), polynomial PLS (Poly-PLS), artificial neural network (ANN) and support vector regression (SVR), were optimized and compared in their works. There are also several works detecting adulterants in dairy products by handheld NIR spectroscopy (Santos et al., 2013; Wang et al., 2015), with the rapid development of such instruments in recent years. However, to the best of our knowledge, so far, no studies have used NIR spectroscopy for detecting hydrolyzed leather protein in dairy products for the purpose of assuring food safety.
In this paper, we developed a NIR spectroscopy based method for detecting hydrolyzed leather protein adulteration in infant formula. The class modelling method was used to discriminate between pure infant formula powder and infant formula adulterated with HLP. Furthermore, regression modelling methods have been established for quantitative analysis. The aim of this study was to evaluate the performance of NIR spectroscopy for HLP adulteration detection in infant formula.
Materials and Methods
Samples A total of 170 samples, including 80 pure infant formula samples and 90 adulterated samples, were analyzed. Among them, the 80 pure infant powder samples contained the infant powder of three brands and their mixtures with random proportions. All the infant powder was obtained from a local food safety supervision organization (Guangzhou Quality Supervision and Testing Institute, China).
The HLP powder purchased from three producers (Kaitai, Beijing, China; Cargill, Hamburg, Germany; AccoBio, Wuxi, China) was mixed into infant formula to form 90 adulteration samples. Such an experimental design was aimed to improve the robustness of the NIR model to the variations in chemical composition of infant formula and HLP powder in practical use (Balabina and Smirnovb, 2011). Adulteration concentrations of HLP ranged from 1% to 20%. All of the adulterated samples were well stirred before NIR spectroscopy measurement.
NIR spectroscopy measurement The near-infrared spectra were acquired with a handheld NIR analyser DLP NIRscan Nano (Texas Instruments, USA). The spectra ranged from 900 ∼ 1700 nm (11100 cm−1 ∼ 5880 cm−1) with the scanning resolution of 2.8 nm (18 cm−1). Sixteen diffuse reflectance scans were averaged for each spectrum. All of the measurements were taken at room temperature (24 ∼ 27°C).
Data processing The spectra ranging from 1000 nm to 1600 nm were utilized for analysis and the initial and terminal sections with a length of 100 nm were deleted because these regions had rather high instrument noise. Several widely used pretreatment methods or combinations (listed below) were tested during classification modelling and regression modelling. They were evaluated by the correct classification rate and the root mean squared error of prediction (RMSEP).
-
·MSC: mean scattering correction.
-
·First derivative: first-order gap segment derivative.
-
·Second derivative: second-order gap segment derivative.
-
·MSC + First derivative: first-order gap segment derivative followed by the mean scattering correction.
-
·MSC + Second derivative: second-order gap segment derivative followed by the mean scattering correction.
Principle component analysis (PCA) was applied to evaluate the possibility of discrimination between samples of pure infant formula and HLP adulteration. Soft independent modelling of class analogy (SIMCA) was performed to discriminate between specific classes. Two thirds of the samples were utilized as calibration sets, while one third of them were assigned into validation sets.
Two regression modelling methods, namely PLS and SVR, were adopted to predict the concentration of HLP in adulteration samples in this study. For method optimization, several parameters of the methods were modified. The number of latent variables was optimized in the PLS method, while the error weight (C), the maximal error value (ε) and the kernel function were optimized in the SVR method.
The root mean squared error of leave-one-out cross validation (RMSECV), the root mean squared error of prediction (RMSEP), the determination coefficient of validation set (R2) and ratio of prediction (RPD) were used to evaluate the prediction capacity of each regression model. The RPD can be calculated as:
where SD is the standard deviation of the adulteration concentrations in the validation set. Commonly, an RPD value lower than 2 is unacceptable for a regression model, and a value above 5 indicates a good prediction accuracy while a value above 8 corresponds to an excellent predict accuracy (Cevoli et al., 2013; Maurel et al., 2010).
In this study, the PCA, SIMCA, PLS and SVR models were performed in The Unscrambler ver. 10.3 (CAMO, Oslo, Norway).
Results and Discussion
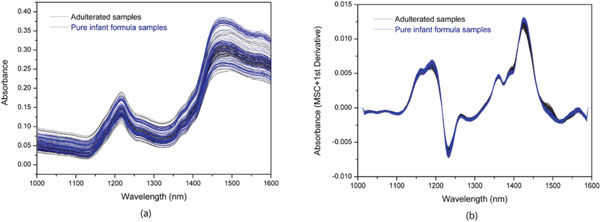
Development of class models The original and pretreated (MSC + First derivative) NIR spectra of pure infant formula (80 samples) and infant formula adulterated with HLP (90 samples) are shown in Fig. 1(a) and Fig. 1(b), respectively. Different spectra pretreatments were tested in class modelling and regression modelling, evaluating by the correct classification rate and RMSEP. MSC + First derivative was found to achieve the best performance. It can be seen from Fig. 1 that the NIR spectra became much more concentrated after pretreatments that eliminated the influence of baseline drift and particle scattering. In Fig. 1(a), the difference of original spectra between authentic and adulterated samples cannot be clearly observed, and the two kinds of spectra overlapped with each other. In Fig. 1(b), compared with the spectra of authentic samples, the spectra of adulterated samples show a weakening around 1425 nm and a small peak between 1473 and 1503 nm, although the pretreated spectra of adulterated samples are still quite similar to those of authentic samples.
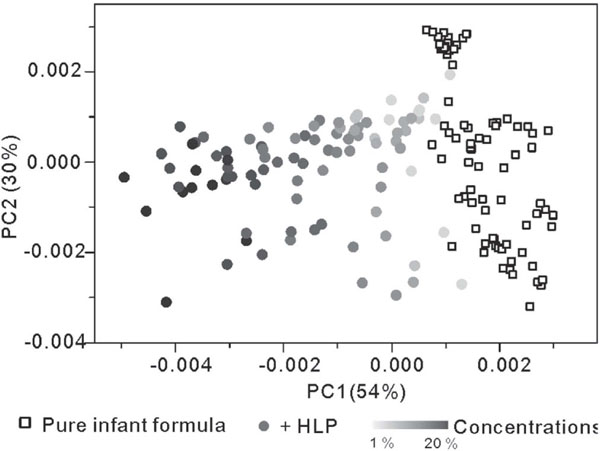
Before the class modelling, a PCA analysis was performed on 80 pure infant formula samples and 90 HLP adulteration samples (See Fig. 2). Over 80% of the total variances are explained by PC1 and PC2. As shown in Fig. 2, the pure infant formula samples and the HLP adulteration samples exhibit obvious differences in PC1 and a good potential of clustering. The concentrations of HLP are shown by gray gradient in Fig. 2. As can be seen, the adulterated samples gradually move away from the sample cluster of pure infant formula with the increase in HLP concentration. The samples with an adulteration concentration lower than 3% show very close distances to the pure samples.
As a classification method, SIMCA first builds up a PCA model for each class in the training stage, and uses these established class models to assess new samples and assigns them to the class they best fit in the subsequent classification stage. In this study, class models of pure infant formula and infant formula adulterated with HLP were established respectively by using two thirds of the samples (54 authentic samples and 60 adulterated samples). The rest one third of the samples (26 authentic samples and 30 HLP samples) were tested based on these models. The results of SIMCA classification are shown in Table 1. For the pure infant formula group, 96.2% of the samples were classified correctly, and only one sample was recognized as adulteration. As for the HLP adulteration group, the correct classification rate is 100%. There are 5 samples have adulteration concentrations lower than 3% (1%, 1.5%, 2%, 3% and 3%, respectively) in the validation set. Although they showed very close distances to the pure samples in PC1, they were all classified correctly.
Table 1.
SIMCA results for the classification of pure infant formula and HLP adulteration (referring to a significant level of 5%).
|
Pure |
+ HLP |
Model-to-model distance |
| Correct classification rate |
96.2%
(25/26) |
100%
(30/30) |
8.57 |
The model-to-model distance is an important parameter for evaluating the similarity or dissimilarity between classes. Generally, a model distance greater than 3 indicates that the two models can be well distinguished from each other (Cevoli et al., 2013). The model distances between pure infant formula and infant formula adulterated with HLP is 8.57.
Development of regression models Quantification of adulterant concentrations in infant formula was performed through PLS and SVR regression analysis. The regression models were built on 100 samples, including 90 HLP adulterated samples and 10 pure infant formula samples. Before developing the regression models, samples were divided into two groups randomly: calibration set contained 6 pure infant formula samples and 70 HLP adulterated samples, and validation set included 4 pure infant formula samples and 20 HLP adulterated samples. The detailed information about the datasets utilized in regression modelling can be found in Table 2.
Table 2.
Description of datasets used in the PLS and SVR regression models.
|
pcs |
HLP concentration |
Mean (%) |
SD (%) |
| Calibration |
76 |
0∼20% |
9.46 |
6.26 |
| Validation |
24 |
0∼20% |
8.75 |
6.59 |
In this approach, PLS and SVR regression models were developed, optimized and compared. In PLS modelling, the root mean square error of leave-one-out cross validation (RMSECV) was applied for determining the optimum number of latent variables for the PLS model. Fig. 3(a) presents the variations of RMSEC and RMSECV with the number of latent variables. It is possible to see that RMSECV was minimized with a latent variable number of 6. When the number of latent variables was greater than 6, the RMSECV began to increase while the RMSEC continued to decrease, which indicates an over-fitted calibration. Therefore, a latent variable number of 6 was chosen. The RMSEC and RMSEP value were 0.886 and 1.233% respectively in the PLS model.

In SVR modelling, the objects with prediction errors larger than ε are “support vectors” and determine the prediction results of SVR model. The parameters ε, C (penalty coefficient) and kernel functions need to be defined by users. In this study, radial basis function (RBF) and polynomials of order two and three kernels were tested, and RBF kernels found to be the best-performed kernel function. The values of ε and C were optimized through grid search, evaluating by the RMSECV values (See Fig. 3(b)). The search ranges of ε and C were 0.001∼1 and 1∼100, respectively, which were selected based on the experience obtained from previous studies. The optimized values of ε and C were 0.00215 and 7.74, respectively. The RMSEC and RMSEP values were 0.967 and 0.884% respectively in the SVR model. The SVR regression curve is displayed in Fig. 4.

When comparing the results for the PLS and SVR models (shown in Table 3), it can be observed that although PLS showed a higher RMSEC value, the SVR model had a better predictive ability given the higher RMSEP, coefficient of determination (R2) and ratio of prediction (RPD) values.
Table 3.
Calibration and validation results for the PLS and SVR regression models.
|
Parameters |
RMSEC |
RMSEP |
R2 |
RPD |
| PLS |
PCs = 6 |
0.886 |
1.233 |
0.965 |
5.34 |
| SVR |
C = 7.74
ε = 2.15e-3 |
0.967 |
0.884 |
0.975 |
7.42 |
In HLP, the content of hydroxyproline (Hyp) is about 9%. In this paper, the RMSEP for HLP is 0.884%. Therefore, the equivalent prediction sensitivity for Hyp is 0.0796% (0.884%×0.09) in the present work. Some chromatography-based methods and the spectroscopy-based methods for determining Hyp are summarized in Table 4. The sensitivity of the chromatography-based methods is commonly expressed by limit of detection (LOD), while the sensitivity of spectroscopy-based methods is usually expressed by RMSEP.
Table 4.
Summary of the chromatography-based methods and the spectroscopy-based methods for determining Hyp.
|
Analytical method |
Detection objects |
Sensitivity (LOD or RMSEP) |
| Chromatography-based methods |
Capillary Electrophoresis |
Urine samples |
4 µmol·L−1 (0.52 mg·L−1) |
| Capillary Electrophoresis |
Amniotic fluid |
8.6 µmol·L−1 (1.13 mg·L−1) |
| Micellar Electrokinetic Chromatography |
Dairy products |
8.2 nmol·L−1 (1.07 µg·L−1) |
| Spectroscopy-based methods |
NIR spectroscopy |
Pork and beef |
0.05% (0.5 g·kg−1) |
| Auto-fluorescence Spectroscopy |
Beef |
0.37% (3.7 g·kg−1) |
| Present work |
Infant formula |
0.0796% (0.796 g·kg−1) |
As can be seen in the Table 4, the accuracy of the present work and the other spectroscopy-based methods are in the same order of magnitude. However, the chromatography-based methods have much higher sensitivity than the spectroscopy-based methods. The spectroscopy-based methods have no advantage in sensitivity, but they have advantages of simpleness in sample preparation and testing, real-time response, relatively low-cost instrument, non-destructive and environmentally friendly analysis. Moreover, in this paper, we use a portable NIR spectral device for measurement. This method is promising for applied in rapid detection for government supervisory organizations, infant formula distributors and even consumers, instead of the traditional laboratory testing.
Conclusion
In this study, HLP adulteration in infant formula was detected by NIR spectroscopy combined with chemometric methods. Classification and quantitative analyses were carried out respectively. The SIMCA classification model was established by pure infant formula and infant formula adulterated with HLP. The correct classification rates for pure infant formula and HLP adulteration samples are 96.2% and 100% respectively. In the quantitative analysis part, PLS and SVR modelling was developed, optimized and compared. The validation results show that SVR had better prediction capacity than PLS and could achieve a prediction error (RMSEP) of 0.884%. Our results indicate that NIR spectroscopy could provide a simple, rapid, economical and non-destructive detection for HLP adulteration in dairy products.
Acknowledgements This work was supported by Science and Technology Planning Project of Guangdong Province, China (fund No. : 2015B090901025, 2015A010103008, 2016B090918061) and Science and Technology Planning Project of Guangzhou, China (fund No: 201607010093, 201508020071).
References
- Balabin, R. M. and Safieva, R. Z. (2007). Capabilities of near infrared spectroscopy for the determination of petroleum macromolecule content in aromatic solutions. J. Near Infrared Spectrosc., 15, 343-349.
- Balabina, R. M. and Smirnovb, S. V. (2011). Melamine detection by mid-and near-infrared (MIR/NIR) spectroscopy: A quick and sensitive method for dairy products analysis including liquid milk, infant formula, and milk powder. Talanta, 85, 562-568.
- Bellincontro, A., Taticchi, A., Servili, M., Esposto, S., Farinelli, D., and Mencarelli F. (2012). Feasible application of a portable NIR-AOTF tool for on-field prediction of phenolic compounds during the ripening of olives for oil production. J. Agric. Food Chem., 60, 2665-2673.
- Blanco, M., Coello, J., Iturriaga, H., Maspoch, S., and Pezuela, C. (1998a). Near-infrared spectroscopy in the pharmaceutical industry. Analyst, 123, 135-150.
- Blanco, M., Coello, J., Iturriaga, H., Maspoch, S., and Serrano, D. (1998b). Near-infrared analytical control of pharmaceuticals. A single calibration model from mixed phase to coated tablets. Analyst, 123, 2307-2312.
- Borin, A., Ferrao, M. F., Mello, C., Maretto, D. A., and Poppi, R. J. (2006). Least-squares support vector machines and near infrared spectroscopy for quantification of common adulterants in powdered milk. Anal. Chim. Acta, 579, 25-32.
- Botros, L. L., Jablonski, J., Chang, C., Bergana, M. M., Wehling, P., Harnly, J. M., Downey, G., Harrington, P., Potts, A. R., and Moore, J. C. (2013). Exploring authentic skim and nonfat dry milk powder variance for the development of nontargeted adulterant detection methods using near-infrared spectroscopy and chemometrics. J. Agric. Food Chem., 61, 9810-9818.
- Capuano, E., Boerrigter-Eenling, R., Koot, A., and Ruth, S. M. (2015). Targeted and untargeted detection of skim milk powder adulteration by near-infrared spectroscopy. Food Anal. Methods, 8, 2125-2134.
- Cevoli, C., Gori, A., Nocetti, M., Cuibus, L., Caboni, M. F., and Fabbri, A. (2013). FT-NIR and FT-MIR spectroscopy to discriminate competitors, non compliance and compliance grated Parmigiano Reggiano cheese. Food Res. Int., 52, 214-220.
- Chen, J. Y., Miao, Y., Sato, S., and Zhang, H. (2008). Near infrared spectroscopy for determination of the protein composition of rice flour. Food Sci. Technol. Res., 14, 132-138.
- Conventz, A., Musiol, A., Brodowsky, C., Müller-Lux, A., Dewes, P., Kraus, T., and Schettgen, T. (2007). Simultaneous determination of 3-nitrotyrosine, tyrosine, hydroxyproline and proline in exhaled breath condensate by hydrophilic interaction liquid chromatography/ electrospray ionization tandem mass spectrometry. J. Chromatogr. B, 860, 78-85.
- Dong, Y. L., Yan, N., Li, X., Zhou, X. M., Zhou, L., Zhang, H. J., and Chen, X. G. (2012). Rapid and sensitive determination of hydroxyproline in dairy products using micellar electrokinetic chromatography with laser-induced fluorescence detection. J. Chromatogr. A, 1233, 156-160.
- Graham, S. F., Haughey, S. A., Ervin, R. M., Cancouët, E., Bell, S., and Elliott, C. T. (2012). The application of near-infrared (NIR) and Raman spectroscopy to detect adulteration of oil used in animal feed production. Food Chem, 132, 1614-1619.
- Felizardo, P., Baptista, P., Menezes, J. C., and Correia, M. J. N. (2007). Multivariate near infrared spectroscopy models for predicting methanol and water content in biodiesel. Anal. Chim. Acta, 595, 107-113.
- Fuentea, D. L. and Juáreza, M. (2005). Authenticity assessment of dairy products. Crit. Rev. Food Sci., 45, 563-585.
- Harnly, J. M., Harrington, P. B., Botros, L. L., Joseph, J., Chang, C., Bergana, M. M., Wehling, P., Downey, G., Potts, A. R., and Moore, J. C. (2014). Characterization of near-infrared spectral variance in the authentication of skim and nonfat dry milk powder collection using ANOVA-PCA, pooled-ANOVA, and partial least-squares regression. J. Agric. Food Chem., 62, 8060-8067.
- Hoshi, Y. (2007). Functional near-infrared spectroscopy: Current status and future prospects. J. Biomed. Opt., 12, 24-32.
- Hsieh, C. L., Hung, C. Y., and Kuo, C. Y. (2011). Quantization of adulteration ratio of raw cow milk by least squares support vector machines (LS-SVM) and visible/near infrared spectroscopy. IFIP Advances in Information and Communication Technology, 363, 130-139.
- Huang, W. S. and Wu, L. P. (2011). Determination of L-hydroxyproline in “leather milk”. Chin. J. Spectrosc. Lab., 28, 3094-3096.
- Kakinuma, M., Watanabe, Y., Hori, Y., Oh-i, T., and Tsuboi, R. (2005). Quantification of hydroxyproline in small amounts of skin tissue using isocratic high performance liquid chromatography with NBD-F as fluorogenic reagent. J. Chromatogr. B, 824, 161-165.
- Kataoka, H., Nabeshima, N., Nagao, K., and Makita, M. (1993). Selective and sensitive determination of urinary total proline and hydroxyproline by gas chromatography with flame photometric detection. Clin. Chim. Acta, 214, 13-20.
- Lim, J., Kim, G., Moa, C., Kim, M. S., Chao, K., Qin, J., Fu, X., Baek, I., and Cho, B. K. (2016). Detection of melamine in milk powders using near-infrared hyperspectral imaging combined with regression coefficient of partial least square regression model. Talanta, 151, 183-191.
- Liu, J. X., Wang, L. L., Liu, J., and Wang, J. P. (2014). Development of an indirect competitive immunoassay for determination of L-hydroxyproline in milk. Food Agric. Immunol., 25, 243-255.
- Maurel, V. B., Ahumada, E. F., Palagos, B., Roger, J. M., and McBratney, A. (2010). Critical review of chemometric indicators commonly used for assessing the quality of the prediction of soil attributes by NIR spectroscopy. Trends Analyt. Chem., 29, 1073-1081.
- Nordon, A., Littlejohn, D., Dann, A. S., Jeffkins, P. A., Richardson, M. D., and Stimpsonb, S. L. (2008). In situ monitoring of the seed stage of a fermentation process using non-invasive NIR spectrometry. Analyst, 133, 660-666.
- Pissard, A., Pierna, J. F., Baeten, V., Sinnaeve, G., Lognay, G., Mouteau, A., Dupont, P., Rondia, A., and Lateur, M. (2013). Non-destructive measurement of vitamin C, total polyphenol and sugar content in apples using near-infrared spectroscopy. J. Sci. Food Agric., 93, 238-244.
- Taubes, G. (1997). Play of light opens a new window into the body. Science, 276, 1991-1993.
- Travers, S., Bertelsena, M. G., and Kucheryavskiy, S. V. (2014). Predicting apple (cv. Elshof) postharvest dry matter and soluble solids content with near infrared spectroscopy. J. Sci. Food Agric., 94, 955-962.
- Santos, P., M., Pereira-Filho, E., R., and Rodriguez-Saona, L., E. (2013). Application of hand-held and portable infrared spectrometers in bovine milk analysis. J. Agric. Food Chem., 61, 1205-1211.
- Tyan, Y. C., Yang, M. H., Jong, S. B., Wang, C. K., and Shiea, J. (2009). Melamine contamination. Anal. Bioanal. Chem., 395, 729-735.
- Wang, N. N., Shen, B. H., Guan, J. J., Zhao, Z. R., Zhu, Y. W., Zhang, L. D., Yan, Y. L., Zheng, Y. Y., Dong, C. Y., and Kang, D. M. (2015). Detection of adulteration in milk powder with starch near infrared. Spectrosc. Spect. Anal., 35, 2141-2146.
- Zhang, L. G., Zhang, X., Ni, L. J., Xue, Z. B., Gu, X., and Huang, S. X. (2014). Rapid identification of adulterated cow milk by non-linear pattern recognition methods based on near infrared spectroscopy. Food Chem., 145, 342-348.
