Abstract
Ultrasound assisted extraction (UAE) was used to extract phenolic compounds and anthocyanins from perilla leaves. Response surface methodology (RSM) was used to optimize the extraction conditions. The optimal conditions were as follows: ethanol concentration of 76.58%, liquid-to-solid ratio of 22.15:1, extraction temperature of 52.75°C and extraction time of 53.84 min. Under these optimal conditions, total phenolic content (TPC) and the total anthocyanins content (TAC) were 63.11 mg gallic acid equivalent (GAE)/g dry weight (DW) and 6.44 mg cyanidin-3-glucoside equivalent (CGE)/g DW, respectively. The experimental data are consistent with the predicted values, confirming that the model was valid for optimization of the extraction conditions. In addition, perilla extract was purified using XAD-7 resin. The antioxidant activity of purified extract was determined using 2,2-diphenyl-1-picrylhydrazyl (DPPH) and 3-ethyl-benzo-thiazoline-6-sulphonate (ABTS) methods (50% inhibition values of 19.88 µg/mL by DPPH and 81.75 µg/mL by ABTS). The results indicated that purified extract exhibited potent antioxidant capacity.
Introduction
Perilla (Perilla frutescens) is widely used in Asia as a traditional medicine and functional food (Igarashi and Miyazaki, 2013). Perilla leaves are widely consumed in salads, sushi and soup, as well as for pickles and garnishes (Ha et al., 2012). Additionally, the leaves can be used in the treatment of asthma, influenza, cough, chronic bronchitis, intestinal disorders, and allergies (Nakazawa and Ohsawa, 2000; Ueda et al., 2002; Takano et al., 2004). Some studies have reported that perilla leaves are rich in phytochemicals such as polyphenols and anthocyanins (Meng et al., 2009; Kang and Lee, 2011). Phenolic compounds have been associated with antioxidant activities and the prevention of degenerative diseases (Lopez-Velez et al., 2003; Zafra-Stone et al., 2007). Moreover, anthocyanins are natural pigments that have beneficial properties including antioxidant (He and Giusti, 2010), amelioration of Parkinson's disease (Gao et al., 2012), beneficial effects on memory (Gutierres et al., 2014), antidiabetic properties (Sancho and Pastore, 2012), anticancer (Wang and Stoner, 2008) and anti-inflammatory (Seeram, 2008) activities. In recent years, there has been a growing interest in natural extracts resulting from consumer awareness of their health-promoting benefits. Extraction of phenolic compounds from perilla leaves has previously been reported (Li et al., 2016). However, perilla varieties determine leaf quality and extracts of purple perilla leaves have higher concentrations of phytochemicals and stronger antioxidant activity compared with extracts from green perilla leaves (Meng et al., 2009). It is therefore important to develop an effective method for extraction of phenolic compounds and anthocyanins from purple perilla leaves.
Extraction methods such as ultrasound-assisted extraction, microwave-assisted extraction, enzyme-assisted extraction, and supercritical fluid extraction have been used to obtain bioactive compounds from plant materials (Vilkhu et al., 2008; Chen et al., 2015). Of these, ultrasound-assisted extraction (UAE) has received particular attention because of the short extraction time, low solvent consumption, simplicity, good reproducibility and environmental friendliness (Barba et al., 2016; Tao et al., 2014). The enhancement of extraction rate by UAE is mainly due to the acoustic cavitations produced by ultrasonic waves, which increase penetration of solvent into the plant material (Romanik et al., 2007; Adjé et al., 2010). Literature studies have reported the effects of different acids on extraction efficiency of anthocyanins and concentration of anthocyanin products by cross-flow microfiltration and reverse osmosis (Meng et al., 2008). However, the effect of UAE on total phenolic and anthocyanin yield from perilla leaves has not been reported.
The extraction solvent, time, temperature, and liquid-to-solid ratio have great impact on polyphenol and anthocyanin yields, and the interaction of these factors determines the extraction rate. It is therefore necessary to use a comprehensive evaluation method to identify the best extraction conditions. Response surface methodology (RSM) is used to establish models between factors and responses using mathematical and statistical methods (Karacabey and Mazza, 2010; Bassani et al., 2014). The advantage of RSM is that it can take into account the interactions of independent variables and predict optimal conditions (Prasad et al., 2011; Xu et al., 2013; Sharif et al., 2014). RSM has been widely used to optimize extraction conditions of phytochemicals from natural sources (Xu and Bao, 2014; Teng et al., 2014). To the best of our knowledge, there is no literature on the use of RSM to optimize extraction of phenolic compounds and anthocyanins from perilla leaves using UAE.
In this study, we have evaluated the effects of four factors (ethanol concentration, liquid-to-solid ratio, temperature, and time) on extraction yield, and optimized the extraction process using RSM. In addition, the crude extract was purified using XAD-7 resin. The antioxidant properties of the purified extract were analyzed using 2,2-diphenyl-1-picrylhydrazyl (DPPH) and 3-ethyl-benzo-thiazoline-6-sulphonate (ABTS) radical scavenging capacity assays.
Material and Methods
Materials and reagents P. frutescens leaves were collected in August 2015 from experimental plots at North University of China (Taiyuan, Shanxi Province, China). The leaves were air-dried and thoroughly milled into powder with a particle size lower than 0.6 mm. The powder was sealed in plastic bags and stored at 4°C before analysis.
2,2-diphenyl-1-picrylhydrazyl (DPPH), 2,2′-azino-bis (3-ethylbenzothiazoline-6-sulphonic acid) (ABTS), Folin-Ciocalteu (FC) reagent, Gallic acid and vitamin C were purchased from Sigma Chemical Co. (St. Louis, MO, USA). Analytical grade ethanol, hydrochloric acid and sodium carbonate were purchased from Tianjin Guangfu Chemical Reagent Co., Ltd. (Tianjin, China).
Extraction of phenolic compounds and anthocyanins 1 g of powdered perilla leaves was usually extracted using 80% (v/v) ethanol acidified by the addition of HCl to 0.1% and mixed well. The extraction was performed in an ultrasonic bath (SB-5200 DTDN, 300 W Xinzhi Ltd., Ningbo, China) at 50°C for 30 min with a liquid-to-solid ratio of 20:1 (mL/g). After processing, the extract was centrifuged at 5200 × g for 15 min (TDL-60B, Anting, Shanghai, China). The supernatant was transferred to a glass vial and stored at 4°C before analysis.
Single factor experiments Prior to extraction optimization, the upper and lower values of variables were determined by single factor experiments. The effect of ethanol concentration on extraction-related variables was determined at 50%, 60%, 70%, 80% and 90% (0.1% HCl) at 50°C for 30 min with a liquid-to-solid ratio of 20:1. The effect of liquid-to-solid ratio was determined at different ratios (5:1, 10:1, 15:1, 20:1 and 25:1) using 80% ethanol (0.1% HCl) at 50°C for 30 min. The effect of extraction temperature was determined at 20°C, 30°C, 40°C, 50°C and 60°C using 80% ethanol (0.1% HCl) with a liquid-to-solid ratio of 20:1 for 30 min. Finally, the effect of extraction time was determined at 15, 30, 45, 60 and 75 min using 80% ethanol (0.1% HCl) with a liquid-to-solid ratio of 20:1 at 50°C.
Experimental design Based on the single factor experiments, a Box-Behnken Design (BBD) method was used to evaluate effects on the extraction yield of four independent variables: ethanol concentration (X1), liquid-to-solid ratio (X2), extraction temperature (X3), and extraction time (X4). The independent variables were coded at three levels (−1, 0, and 1). Total phenolic content (TPC) and total anthocyanins content (TAC) were selected as the response variables (Y). The design, with three levels and four variables (27 experiments), included five replicates of central points to assess lack of fit. Table 1 shows the run order, variable levels, and the experimental values. A second degree polynomial equation was used to calculate the response:
Table 1.
Box-Behnken Design and response values of TPC and TAC
| Run |
Independent variables |
Respond variables |
|
Ethanol concentration X1 (%, v/v) |
Liquid-to-solid ratio X2 (mL/g) |
Extraction temperature X3 (°C) |
Extraction time X4 (min) |
TPC (mg GAE/g DW) |
TAC (mg CGE/g DW) |
| 1 |
80 (0) |
25 (1) |
60 (1) |
45 (0) |
52.29 ± 1.22 |
5.96 ± 0.14 |
| 2 |
90 (1) |
25 (1) |
50 (0) |
45 (0) |
48.89 ± 1.31 |
5.68 ± 0.11 |
| 3 |
80 (0) |
15 (−1) |
40 (−1) |
45 (0) |
47.73 ± 1.19 |
5.71 ± 0.10 |
| 4 |
80 (0) |
20 (0) |
50 (0) |
45 (0) |
59.86 ± 0.67 |
6.45 ± 0.13 |
| 5 |
80 (0) |
20 (0) |
50 (0) |
45 (0) |
61.98 ± 0.94 |
6.44 ± 0.16 |
| 6 |
90 (1) |
20 (0) |
50 (0) |
30 (−1) |
50.74 ± 1.21 |
5.74 ± 0.11 |
| 7 |
80 (0) |
20 (0) |
60 (1) |
30 (−1) |
55.15 ± 1.38 |
6.07 ± 0.13 |
| 8 |
80 (0) |
20 (0) |
50 (0) |
45 (0) |
62.20 ± 0.86 |
6.46 ± 0.12 |
| 9 |
90 (1) |
20 (0) |
60 (1) |
45 (0) |
52.21 ± 1.28 |
5.82 ± 0.10 |
| 10 |
80 (0) |
15 (−1) |
50 (0) |
60 (1) |
51.43 ± 1.02 |
5.81 ± 0.09 |
| 11 |
80 (0) |
25 (1) |
40 (−1) |
45 (0) |
53.40 ± 0.70 |
6.00 ± 0.12 |
| 12 |
80 (0) |
15 (−1) |
60 (1) |
45 (0) |
49.21 ± 0.71 |
5.79 ± 0.13 |
| 13 |
80 (0) |
20 (0) |
40 (−1) |
30 (−1) |
55.84 ± 1.28 |
6.10 ± 0.11 |
| 14 |
70 (−1) |
20 (0) |
50 (0) |
60 (1) |
57.43 ± 1.35 |
6.08 ± 0.13 |
| 15 |
90 (1) |
20 (0) |
50 (0) |
60 (1) |
51.91 ± 1.53 |
5.77 ± 0.08 |
| 16 |
80 (0) |
20 (0) |
50 (0) |
45 (0) |
59.95 ± 0.58 |
6.29 ± 0.14 |
| 17 |
70 (−1) |
25 (1) |
50 (0) |
45 (0) |
59.64 ± 1.33 |
6.14 ± 0.10 |
| 18 |
80 (0) |
20 (0) |
40 (−1) |
60 (1) |
49.65 ± 1.63 |
5.75 ± 0.10 |
| 19 |
70 (−1) |
20 (0) |
50 (0) |
30 (−1) |
52.68 ± 0.96 |
5.80 ± 0.11 |
| 20 |
80 (0) |
25 (1) |
50 (0) |
30 (−1) |
53.59 ± 0.81 |
5.98 ± 0.07 |
| 21 |
80 (0) |
20 (0) |
50 (0) |
45 (0) |
62.13 ± 1.35 |
6.44 ± 0.09 |
| 22 |
70 (−1) |
20 (0) |
40 (−1) |
45 (0) |
57.39 ± 1.63 |
6.05 ± 0.11 |
| 23 |
70 (−1) |
20 (0) |
60 (1) |
45 (0) |
57.68 ± 1.31 |
6.01 ± 0.13 |
| 24 |
80 (0) |
25 (1) |
50 (0) |
60 (1) |
61.77 ± 1.26 |
6.39 ± 0.08 |
| 25 |
80 (0) |
20 (0) |
60 (1) |
60 (1) |
60.33 ± 1.53 |
6.31 ± 0.15 |
| 26 |
90 (1) |
20 (0) |
40 (−1) |
45 (0) |
47.16 ± 1.27 |
5.58 ± 0.12 |
| 27 |
90 (1) |
15 (−1) |
50 (0) |
45 (0) |
48.89 ± 0.91 |
5.67 ± 0.08 |
| 28 |
80 (0) |
15 (−1) |
50 (0) |
30 (−1) |
51.37 ± 1.34 |
5.86 ± 0.09 |
| 29 |
70 (−1) |
15 (−1) |
50 (0) |
45 (0) |
47.27 ± 0.88 |
5.68 ± 0.13 |
Results are the means ± standard deviation (n = 3).
where Y is the predicted response; b0 denotes the model intercept; bi, bii, and bij are the regression coefficients of the linear, squared and interaction effects, respectively; Xi and Xj represent the independent variables.
RSM experimental design was performed using Design Expert software (Version 8; Stat-Ease, Inc., Minneapolis, MN, USA). The data were statistically analyzed using analysis of variance (ANOVA) to determine the effects of linear, quadratic, and interaction variables on TPC and TAC.
Determination of TAC and TPC The TPC was determined using the Folin-Ciocalteu method according to the literature (Dewanto et al., 2002). Results are expressed as gallic acid equivalent per g of dry weight (mg GAE/g DW). The TAC was determined using a pH differential method according to the literature (Lee, 2005). Absorbance was measured at 520 nm and 700 nm using a spectrophotometer (UV9600, Bobang Co., Zhengzhou, China). Results are expressed as cyanidin-3-glucoside equivalent (CGE) per g of dry weight (mg CGE/g DW).
Partial purification 8 g of powdered perilla leaves was extracted under the optimal conditions. The supernatant was evaporated to remove ethanol at 50°C on a rotary vacuum evaporator (SHZ-95B, Yuhua Ltd., Gongyi, China). The concentrated extract was adjusted to approximately 2.0 mg CGE/mL with acidified water, and then was purified following the literature (Zhang et al., 2011) with some modifications. A glass column (1.0 cm × 20.0 cm) was filled with 6.0 g Amberlite XAD-7HP resin. The concentrated extract was slowly added to the resin. The resin was washed with 120 mL of distilled water to remove sugars, aliphatic acids and other impurities. Subsequently, the absorbed phenolic compound and anthocyanins were eluted slowly with 30 mL of 60% (v/v) acidified water-ethanol solution. The eluate was collected, evaporated and freeze-dried (SCIENTZ-10N, Xinzhi Ltd., Ningbo, China) to provide the purified extract powder for further antioxidative analysis.
Analysis of antioxidant activity DPPH radical scavenging activity was measured as previously reported (Choi et al., 2000), with some modifications. Briefly, 100 µL of diluted extract was mixed with 2.9 mL of fresh 60 µM DPPH in methanol. The mixture was allowed to stand in the dark for 30 min at room temperature prior to measuring absorbance at 517 nm. DPPH scavenging activity was calculated using the following formula,
ABTS radical scavenging ability was performed as reported by literature (Arts et al., 2004). ABTS radical cation solution was prepared by mixing potassium persulfate (2.45 mM) with ABTS stock solution (7 mM) at a volume ratio of 1:1. The mixture was kept in the dark for 12 h and used within two days. The ABTS solution was diluted with ethanol until the absorbance measurement was 0.7 ± 0.02 at 734 nm. The diluted extract (300 µL) was mixed with 2.7 mL ABTS solution and allowed to stand in the dark for 7 min at room temperature. ABTS scavenging ability was calculated by the following equation,
Statistical analysis Data were analyzed by SPSS version 22.0 (IBM Crop. Armonk, NY, USA). Values were expressed as mean ± standard deviation (SD). Coefficients between TPC and TAC were calculated using Pearson's correlation.
Results and Discussion
Single factor study The effect of ethanol concentration on extraction yield is shown in Fig. 1(A). The extract solution was acidified with 0.1% aqueous HCl, since anthocyanins are stable under acidic conditions. The yields of TPC and TAC were highest when the ethanol concentration was increased to 80%. The yield decreased when the ethanol concentration was higher than 80%. Therefore, the ethanol concentration ranging from70% to 90% was selected for optimization.
The influence of liquid-to-solid ratio on extraction yields is shown in Fig. 1(B). Extraction yield increased as the liquid-to-solid ratio was increased to 20:1. The yield did not increase further when the liquid-to-solid ratio was increased from 20:1 to 25:1. Since an increase in the liquid-to-solid ratio increases solvent consumption, with consequent increased costs (Cissé et al., 2012). Consequently, the liquid-to-solid ratio was selected was from 15:1 to 25:1 during optimization.
The influence of extraction temperature on yields is shown in Fig. 1(C). Extraction yields increased with increasing temperature. Taking into account the instability of anthocyanins, higher temperatures may be detrimental (Bianca et al., 2012). As a result, the range of extraction temperature was between 40°C and 60°C for subsequent extraction optimization.
Increasing the extraction time increased yields (Fig. 1(D)), but the magnitude of the increase was small. The yield was not significantly increased when the extraction time was increased from 45 to 60 min. Long extraction times at high temperature degrade phenolic compounds [Şahin et al., 2013], so extraction times between 30 and 60 min were selected for optimization.
Fitting the model The TPC and TAC responses are shown in Table 1. The TPC ranged from 62.20 mg GAE/g (run 8) to 47.16 mg GAE/g (run 26) and the TAC ranged from 6.46 mg CGE/g (run 8) to 5.58 mg CGE/g (run 26). The ANOVA is presented in Table 2. The two quadratic polynomial models for TPC and TAC were highly significant (P < 0.001), and the F-values were 10.70 and 14.57. The lack of fit (0.1102 > 0.05 and 0.2204 > 0.05) for TPC and TAC was not significant, suggesting that the model adequately represented the experimental data. The R2 coefficient determines the appropriateness of the model (Granato et al., 2014). The R2 values of 0.9145 and 0.9358 for TPC and TAC suggested that the model explained 91.45% and 93.58% of the variance in the responses. The TPC and TAC are satisfactorily predicted by the model.
Table 2.
Analysis of variance (ANOVA) for the quadratic polynomial model
| Source |
TPC |
|
|
|
|
TAC |
|
|
|
|
|
SS |
DF |
MS |
F-value |
p-valuea |
SS |
DF |
MS |
F-value |
p-valuea |
| Model |
636.86 |
14 |
45.49 |
10.70 |
<0.0001 |
1.97 |
14 |
0.14 |
14.57 |
<0.0001 |
| X1 |
86.89 |
1 |
86.89 |
20.44 |
0.0005 |
0.19 |
1 |
0.19 |
19.39 |
0.0006 |
| X2 |
94.53 |
1 |
94.53 |
22.24 |
0.0003 |
0.22 |
1 |
0.22 |
22.90 |
0.0003 |
| X3 |
20.54 |
1 |
20.54 |
4.83 |
0.0453 |
0.049 |
1 |
0.049 |
5.11 |
0.0402 |
| X4 |
14.41 |
1 |
14.41 |
3.39 |
0.0869 |
0.026 |
1 |
0.026 |
2.70 |
0.1224 |
| X1X2 |
38.25 |
1 |
38.25 |
9.00 |
0.0096 |
0.051 |
1 |
0.051 |
5.24 |
0.0382 |
| X1X3 |
5.66 |
1 |
5.66 |
1.33 |
0.2677 |
0.020 |
1 |
0.020 |
2.03 |
0.1764 |
| X1X4 |
3.20 |
1 |
3.20 |
0.75 |
0.3999 |
0.016 |
1 |
0.016 |
1.62 |
0.2243 |
| X2X3 |
1.68 |
1 |
1.68 |
0.39 |
0.5401 |
3.600E-003 |
1 |
3.600E-003 |
0.37 |
0.5515 |
| X2X4 |
16.48 |
1 |
16.84 |
3.88 |
0.0691 |
0.053 |
1 |
0.053 |
5.47 |
0.0347 |
| X3X4 |
32.32 |
1 |
32.32 |
7.60 |
0.0154 |
0.087 |
1 |
0.087 |
9.00 |
0.0095 |
| X12 |
142.95 |
1 |
142.95 |
33.63 |
<0.0001 |
0.85 |
1 |
0.85 |
87.80 |
<0.0001 |
| X22 |
195.91 |
1 |
195.91 |
46.08 |
<0.0001 |
0.51 |
1 |
0.51 |
52.79 |
<0.0001 |
| X32 |
99.97 |
1 |
99.97 |
23.52 |
0.0003 |
0.32 |
1 |
0.32 |
32.62 |
<0.0001 |
| X42 |
31.24 |
1 |
31.24 |
7.35 |
0.0169 |
0.16 |
1 |
0.16 |
16.49 |
0.0012 |
| Residual |
59.52 |
14 |
4.25 |
|
|
0.14 |
14 |
9.667E-003 |
|
|
| Lack of fit |
53.69 |
10 |
5.37 |
3.68 |
0.1102 |
0.12 |
10 |
0.012 |
2.29 |
0.2204 |
| Pure error |
5.83 |
4 |
1.46 |
|
|
0.020 |
4 |
5.030E-003 |
|
|
| Cor Total |
696.38 |
28 |
|
|
|
2.11 |
28 |
|
|
|
| R2 |
0.9145 |
|
|
|
|
0.9358 |
|
|
|
|
| Adj.R2 |
0.8291 |
|
|
|
|
0.8716 |
|
|
|
|
P < 0.01 highly significant; 0.01 < P < 0.05 significant; P > 0.05 not significant.
SS: sum of squares; DF: degree of freedom; MS: mean square.
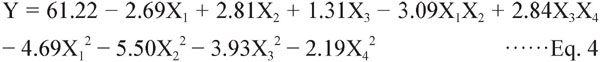
RSM analysis of TPC The regression equation was obtained by fitting the four extraction factors, revealing the relationship of TPC to each factor. The final equation, neglecting insignificant terms, in respect of the coded levels is shown:
The effects of X1, X2, X1X2, X12, X22, X32 on TPC were highly significant (P < 0.01), and the effects of X3, X3X4, X42 were significant (0.01 < P < 0.05), but the effects of X4, X1X3, X1X4, X2X3, X2X4 were not significant (P > 0.05).
The effects of ethanol concentration, liquid-to-solid ratio, extraction temperature and time on TPC are shown in Fig. 2. The effects of ethanol concentration and liquid-to-solid ratio are shown in Fig. 2(A). The highest extraction yield was with an ethanol concentration of 75.06% and a liquid-to-solid ratio of 22.62:1. With increasing ethanol concentration and liquid-to-solid ratio, the yield fell. This indicated that a balance was reached at a liquid-to-solid ratio of 22.62:1. Fig. 2(B) shows the effect of ethanol concentration and temperature on TPC. Increasing the temperature was beneficial at lower ethanol concentration (< 75.06%), but excessive increases led to lower extraction yields. The effects of extraction temperature and time and interaction of the two independent variables on TPC is shown in Fig. 2(C). The separate and combined effects of the two independent variables on the extraction yield were different. As a result, the TPC yield was highest at 53.43°C for 57.23 min (63.30 mg GAE/g) (Table 3).
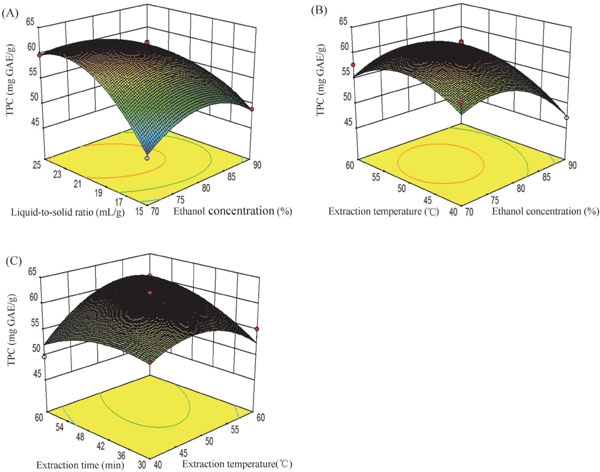
Table 3.
Predicted and experimental values of responses tested at optimal UAE conditions.
|
Optimum UAE conditions |
Optimum Value |
| Response variables |
Ethanol concentration (%) |
Liquid-to-solid ratio (mL/g) |
Extraction temperature (°C) |
Extraction time (min) |
Predicted |
Experimentala |
| TPC (mg GAE/g DW) |
75.06% |
22.62:1 |
53.43 |
57.23 |
63.30 |
63.42 ± 1.16 |
| TAC (mg CGE/g DW) |
77.54% |
21.85:1 |
52.28 |
51.61 |
6.47 |
6.52 ± 0.14 |
| Combination of TPC and TAC |
76.58% |
22.15:1 |
52.75 |
53.84 |
63.15
6.47 |
63.11 ± 1.14
6.44 ± 0.15 |
a Results are the means ± standard deviation (n = 3).
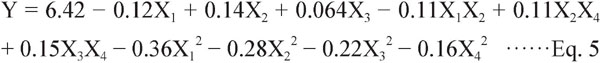
RSM analysis of TAC The effects of the four factors on TAC were complex. The linear, squared and interaction effects of the regression equation can be obtained by regression analysis of experimental results. The final equation in terms of coded levels, neglecting insignificant terms, is shown:
The effects of X1, X2, X3X4, X12, X22, X32, X42 on TAC were highly significant (P < 0.01), the effects of X3, X1X2, X2X4 were significant (0.01 < P < 0.05), and the effects of X4, X1X3, X1X4, X2X3 were not significant (P > 0.05).
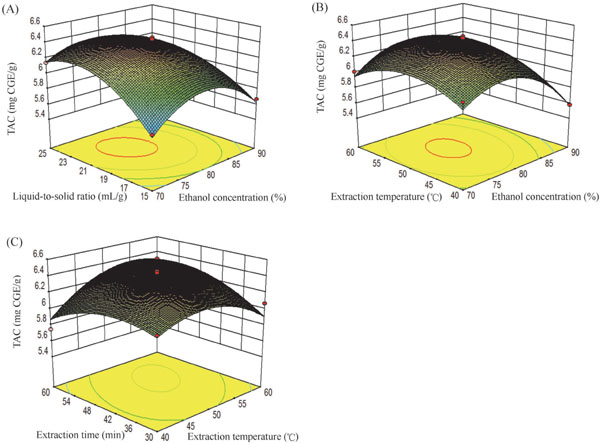
Fig. 3 shows the effect of X1, X2, X3, and X4 on TAC. Fig. 3(A) shows the effect of ethanol concentration and liquid-to-solid ratio on TAC at an extraction temperature of 50°C with an extraction time of 45 min. As ethanol concentration and liquid-to-solid ratio increased, the TAC extraction yield increased. When the ethanol concentration exceeded 77.54%, the extraction yield of anthocyanins decreased. On the other hand, the liquid-to-solid ratio had a highly significant effect on extraction yield, and the system reached equilibrium at a ratio of 21.85:1. Fig. 3(B) shows the effect of ethanol concentration and extraction temperature on TAC. The highest extraction yield was obtained with an ethanol concentration of 77.54% and an extraction temperature of 52.28°C. Higher temperatures may increase mass transfer, increasing extraction rate, but when the temperature exceeds 52.28°C the extraction rate is reduced, which may be related to the instability of anthocyanins. The interaction effect of extraction temperature and time was highly significant (Fig. 3(C)). The yield increased with increasing extraction temperature (< 52.28°C) and time (< 51.61 min), but decreased as the temperature and time were increased further. Of the conditions generated by RSM, the highest TAC content was observed at an ethanol concentration of 77.54%, liquid-to-solid ratio of 21.85:1, temperature of 52.28°C and time of 51.61 min (Table 3). Also, the Pearson's correlation coefficients (r) of TPC and TAC were 0.9697. This date suggest that there is a strong correlation between phenolic compounds and anthocyanins extraction from perilla leaves. The result is consistent with that of Chen et al. (2015).
Optimization of extraction parameters and model validation Each factor has different effects on the different responses. The two response values reached their highest extraction yields following comprehensive optimization. The optimal parameters were an ethanol concentration of 76.58%, liquid-to-solid ratio of 22.15:1, temperature of 52.75°C and time of 53.84 min. Under these conditions, the predicted TPC and TAC were 63.15 mg GAE/g and 6.47 mg CGE/g, respectively. To verify the reliability of the optimization results, extraction was conducted under the suggested conditions, i.e. an ethanol concentration of 77%, liquid-to-solid ratio of 22:1, and temperature of 53°C for 54 min. The experimental TPC and TAC were 63.11 mg GAE/g and 6.44 mg CGE/g, respectively, consistent with the predicted results and were found to be not significantly different (P > 0.05) using one-sample T test (Table 3).
The strong cavitations effect of ultrasonic energy accelerates the diffusion process of phenolic compounds into to the extraction solvent. Ultrasonic extraction significantly shortens the required time and saves energy. Therefore, the ultrasonic assisted extraction method can improve extraction efficiency (Ghafoor et al., 2009). Additionally, the experimental were consistent with the predicted results. Therefore, the two quadratic polynomial models were reliable for optimizing the experimental protocols by RSM (Xu et al., 2013).
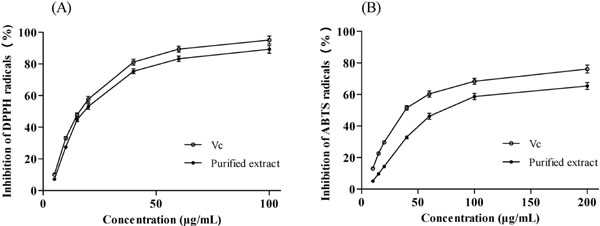
Determination of antioxidant activity After purification of crude extract with XAD-7 resin, the TPC and TAC of purified extract were 568.36 mg GAE/g and 81.37 mg CGE/g, respectively. The antioxidant activities of purified extract were investigated using the DPPH and ABTS methods (Fig. 4). Vitamin C was used as reference antioxidant. At a concentration of 100 µg/mL, the purified extract and vitamin C showed 89.26% and 95.12% inhibition, respectively, in the DPPH assay. The IC50 value (concentration of antioxidant that inhibits DPPH by 50%) of purified extract (19.88 µg/mL) was slightly higher than that of vitamin C (17.14 µg/mL). In addition, the IC50 value in the ABTS assay of purified extract (81.75 µg/mL) was significantly higher than that of vitamin C (47.03 µg/mL). The results indicated that the antioxidant activity of purified extract is comparable to that of vitamin C, and that the extract is a natural antioxidant.
Conclusions
The RSM method was successfully used to optimize ultrasound assisted extraction of total phenolics and anthocyanins from perilla leaves. The optimal conditions of ethanol concentration, liquid-to-solid ratio, extraction temperature and time were determined for maximum extraction yield of bioactive compounds. Under the optimal conditions, the TPC and TAC were 63.11 mg GAE/g and 6.44 mg CGE/g, respectively. The experimental data are consistent with the predicted values. The study indicates that ultrasonic treatment is a green process and effective for recovery of phenolic components and anthocyanins from perilla leaves. Moreover, the purified extract from perilla leaves exhibited potent antioxidant capacity. There is clearly potential for the utilization of perilla leaves in the pharmaceutical and food industries as a replacement for synthetic antioxidant and colorant.
Acknowledgments This work was supported by the Science and Technology Research Program in Social Development of Shanxi Province (201603D321031) and Science and Technology Research Program in Agriculture of Shanxi Province (20150311009-4).
References
- Adjé, F., Lozano, Y.F., Lozano, P., Adima, A., Chemat, F., and Gaydou, E.M. (2010). Optimization of anthocyanin, flavonol and phenolic acid extractions from Delonix regia tree flowers using ultrasound-assisted water extraction. Ind. Crop. Prod., 32, 439-444.
- Arts, M.J.T.J., Haenen, G.R.M.M., Voss, H.P., and Bast, A. (2004). Antioxidant capacity of reaction products limits the applicability of the trolox equivalent antioxidant capacity (TEAC) assay. Food Chem. Toxicol., 42, 45-49.
- Barba, F.J., Zhu, Z., Koubaa, M., Sant'Ana, A.S., and Orlien, V. (2016). Green alternative methods for the extraction of antioxidant bioactive compounds from winery wastes and by-products: a review. Trends Food Sci. Tec., 49, 96-109.
- Bassani, D.C., Nunes, D.S., and Granato, D. (2014). Optimization of phenolics and flavonoids extraction conditions and antioxidant activity of roasted yerba-mate leaves (Ilex paraguariensis A. St.-Hil., Aquifoliaceae) using response surface methodology. An. Acad. Bras. Cienc., 86, 923-934.
- Bianca, M., Lumini, A.D., Cristian, C., and Claudia, C. (2012). Degradation kinetics of anthocyanins from European cranberry bush (Viburnum opulus L.) fruit extracts. Effects of temperature, pH and storage solvent. Molecules., 17, 11655-11666.
- Chen, M.S., Yi, Z., and Yu, S.J. (2015). Optimization of ultrasonic-assisted extraction of phenolic compounds, antioxidants, and anthocyanins from sugar beet molasses. Food Chem., 172, 543-550.
- Choi, H.S., Song, H.S., Ukeda, H., and Sawamura, M. (2000). Radical scavenging activities of Citrus essential oils and their components: detection using 1,1-diphenyl-2-picrylhydrazyl. J. Agr. Food Chem., 48, 4156-4161.
- Cissé, M., Bohuon, P., Sambe, F., Kane, C., Sakho, M., and Dornier, M. (2012). Aqueous extraction of anthocyanins from Hibiscus sabdariffa: experimental kinetics and modeling. J. Food Eng., 109, 16-21.
- Dewanto, V., Wu, X., Adom, K.K., and Liu, R.H. (2002). Thermal processing enhances the nutritional value of tomatoes by increasing total antioxidant activity. J. Agr. Food Chem., 50, 3010-3014.
- Gao, X., Cassidy, A., Schwarzschild, M.A., Rimm, E.B., and Ascherio, A. (2012). Habitual intake of dietary flavonoids and risk of parkinson disease. Neurology, 78, 1138-1145.
- Ghafoor, K., Choi, Y.H., Jeon, J.Y., and Jo, I.H. (2009). Optimization of ultrasound-assisted extraction of phenolic compounds, antioxidants, and anthocyanins from grape (Vitis vinifera) seeds. J. Agr. Food Chem., 57, 4988-4994.
- Granato, D., Calado, V.M.D.A., and Jarvis, B. (2014). Observations on the use of statistical methods in food science and technology. Food Res. Int., 55, 137-149.
- Gutierres, J.M., Carvalho, F.B., Schetinger, M.R.C., Agostinho, P., Marisco, P.C., and Vieira, J.M. (2014). Neuroprotective effect of anthocyanins on acetylcholinesterase activity and attenuation of scopolamine-induced amnesia in rats. Int. J. Dev. Neurosci., 33, 88-97.
- Ha, T.J., Jin, H.L., Lee, M.H., Lee, B.W., Kwon, H.S., Park, C.H., Shim, K.B., Kim, H.T., Baek, I.Y., and Jang, D.S. (2012). Isolation and identification of phenolic compounds from the seeds of Perilla frutescens (L.) and their inhibitory activities against α-glucosidase and aldose reductase. Food Chem., 135, 1397-1403.
- He, J. and Giusti, M.M., (2010). Anthocyanins: natural colorants with health-promoting properties. Annu. Rev. Food Sci. Technol., 1, 163-187.
- Igarashi, M. and Miyazaki, Y. (2013). A review on bioactivities of perilla: progress in research on the functions of perilla as medicine and food. Evid-Based Compl. Alt., 2013, 1-7.
- Kang, N.S. and Lee, J.H. (2011). Characterisation of phenolic phytochemicals and quality changes related to the harvest times from the leaves of Korean purple perilla (Perilla frutescens). Food Chem., 124, 556-562.
- Karacabey, E. and Mazza, G. (2010). Optimization of antioxidant activity of grape cane extracts using response surface methodology. Food Chem., 119, 343-348.
- Lee, J. (2005). Determination of total monomeric anthocyanin pigment content of fruit juices, beverages, natural colorants, and wines by the pH differential method: collaborative study. J. Aoac Int., 88, 1269-1278.
- Li, H.Z., Zhang, Z.J., Xue, J., Cui, L.X., Hou, T.Y., Li, X.J., and Chen, T. (2016) Optimization of ultrasound-assisted extraction of phenolic compounds, antioxidants and rosmarinic acid from perilla leaves using response surface methodology. Food Sci. Technol., 36, 686-693.
- López-Vélez, M., Martínez-Martínez, F., and Del Valle-Ribes, C. (2003). The study of phenolic compounds as natural antioxidants in wine. Crit. Rev. Food Sci. Nutr., 43, 233-244.
- Meng, L., Lozano, Y., Bombarda, I., Gaydou, E., and Li, B. (2006) Anthocyanin and Flavonoid Production from Perilla frutescens: Pilot Plant Scale Processing Including Cross-Flow Microfiltration and Reverse Osmosis. J. Agric. Food Chem., 54, 4297-4303.
- Meng, L., Lozano, Y.F., Gaydou, E.M., and Li, B. (2009). Antioxidant activities of polyphenols extracted from Perilla frutescens varieties. Molecules, 14, 133-140.
- Nakazawa, T. and Ohsawa, K. (2000). Metabolites of orally administered Perilla frutescens extract in rats and humans. Biol. Pharm. Bull., 23, 122-127.
- Prasad, K.N., Hassan, F.A., Yang, B., Kong, K.W., Ramanan, R.N., Azlan, A., and Ismail, A. (2011). Response surface optimization for the extraction of phenolic compounds and antioxidant capacities of underutilized Mangifera pajang Kosterm. peels. Food Chem., 128, 1121- 1127.
- Romanik, G., Gilgenast, E., Przyjazny, A., and Kamiński, M. (2007). Techniques of preparing plant material for chromatographic separation and analysis. J. Biochem. Biophys. Methods, 70, 253-261.
- Şahin, S., Aybastıer, Ö., and Işık, E. (2013). Optimisation of ultrasonic-assisted extraction of antioxidant compounds from Artemisia absinthium using response surface methodology, Food Chem., 141, 1361-1368.
- Sancho, R.A.S. and Pastore, G.M. (2012). Evaluation of the effects of anthocyanins in type 2 diabetes. Food Res. Int., 46, 378-386.
- Seeram, N. (2008). Berry fruits: Compositional elements, biochemical activities, and the impact of their intake on human health, performance, and disease. J. Agr. Food Chem., 56, 627-629.
- Sharif, K.M., Rahman, M.M., Azmir, J., Mohamed, A., Jahurul, M.H.A., Sahena, F., and Zaidul, I.S.M. (2014). Experimental design of supercritical fluid extraction - A review. J. Food Eng., 124, 105-116.
- Takano, H., Osakabe, N., Sanbongi, C., Yanagisawa, R., Inoue, K., Yasuda, A., Natsume, M., Baba, S., Ichiishi, E., and Yoshikawa, T. (2004). Extract of Perilla frutescens enriched for rosmarinic acid, a polyphenolic phytochemical, inhibits seasonal allergic rhinoconjunctivitis in humans. Exp. Biol. Med., 229, 247-254.
- Tao, Y., Wu, D., Zhang, Q.A., and Sun, D.W. (2014). Ultrasound-assisted extraction of phenolics from wine lees: Modeling, optimization and stability of extracts during storage. Ultrason. Sonochem., 21, 706-715.
- Teng, H., Lee, W.Y., and Choi Y.H. (2014). Optimization of ultrasonic-assisted extraction of polyphenols, anthocyanins, and antioxidants from raspberry (Rubus coreanus Miq.) using response surface methodology. Food Anal. Methods, 8, 539-539.
- Ueda, H., Yamazaki, C., and Yamazaki, M. (2002). Luteolin as an anti-inflammatory and anti-allergic constituent of Perilla frutescens. Biol. Pharm. Bull., 25, 1197-202.
- Vilkhu, K., Mawson, R., Simons, L., and Bates, D. (2008). Applications and opportunities for ultrasound assisted extraction in the food industry-A review. Innov. Food Sci. Emerg., 9, 161-169.
- Wang, L.S. and Stoner, G.D. (2008). Anthocyanins and their role in cancer prevention. Cancer Lett., 269, 281-290.
- Xu, H. and Bao, Y. (2014). Response surface optimization of extraction and antioxidant activity of total flavonoids from seed shell of Juglans mandshurica. Food Sci. Technol. Res., 20, 715-724.
- Xu, Q., Shen, Y.Y., Wang, H.F., Zhang, N.P., Xu, S.H., and Zhang, L. (2013). Application of response surface methodology to optimize extraction of flavonoids from fructus sophorae. Food Chem., 138, 2122- 2129.
- Zafra-Stone, S., Yasmin, T., Bagchi, M., Chatterjee, A., Vinson, J.A., and Bagchi, D. (2007). Berry anthocyanins as novel antioxidants in human health and disease prevention. Mol. Nutr. Food Res., 51, 675-683.
- Zhang, L.H., Fu, Q.J., and Zhang, Y.H. (2011). Composition of anthocyanins in pomegranate flowers and their antioxidant activity. Food Chem., 127, 1444-1449.


 ).
).