Abstract
This study aimed to investigate the effects of areca flower tea polyphenol extract (AFPE) on the adipogenesis of 3T3-L1 preadipocytes. AFPE was extracted from areca flower tea using boiling water, and the polyphenolic compounds were analysed by HPLC. At doses that they did not induce cytotoxicity, AFPE (50 – 200 µg/mL) efficiently inhibited triglyceride accumulation in the mature adipocytes in a dose-dependent manner when induced to differentiate. Additionally, AFPE suppressed the secretion of leptin and the expression of lipoprotein lipase (LPL). Moreover, the anti-adipogenic properties were also attributed to the down-regulation of protein expression of major transcriptional factors in adipogenesis, including peroxisome proliferator-activated receptor γ (PPARγ) and CCAT/enhancer-binding protein α (C/EBPα). Therefore, these results suggest that AFPE may prevent obesity by inhibiting the differentiation of preadipocytes, suggesting its potential application in functional foods and nutraceuticals for obesity management.
Introduction
Obesity has become a major risk factor known to contribute to a variety of comorbidities including diabetes mellitus, lipidaemia, hypertension, atherosclerosis, and certain cancers (Kopelman, 2000; Wang et al., 2015). Obesity is mainly caused by an excess of dietary fatty acids and carbohydrates, and it is characterized by increased adipose tissue mass and energy intake (Spalding et al., 2008). Numerous studies in anti-obesity have made attentions on adipose tissues and development of adipocytes, which is known as adipogenesis. Adipogenesis is a process of differentiation and development of fibroblastic preadipocytes to mature lipid-filled adipocytes and is coordinated by hormones and transcription factors. Adipocytes play a crucial role in energy balance of the body due to it can control storage and mobilization of triacylglycerol (Spiegelman and Flier, 2001). Excessive lipid content in the cell can affect the function of adipocyte and secretion of adipocytokines, which maybe strongly correlated with insulin resistance and increase the risk of diabetes (Gregoire, 2001).
Thus, more attentions have been paid to the exploration of strategies for prevention and treatment of obesity, especially natural nontoxic phytochemicals as potential functional ingredients with anti-obesity activity (Chen et al., 2014; Yang et al., 2015). Many reports have demonstrated that polyphenolic compounds, for example resveratrol (Chen et al., 2011), catechin (Furuyashiki et al., 2004), chlorogenic acid (Cho et al., 2010), caffeic acid (Liao et al., 2014), oxyresveratrol and cyanomaclurin (Tan et al., 2015), anthocyanin (Wu et al., 2016), have the potential to suppress adipogenesis, increase lipolysis and induce the apoptosis of adipocytes. Thus, the suppression of adipogenesis by effective phenolic compounds is considered as a useful approach to prevent or alleviate obesity and some related metabolic disorders.
Areca flower is the male bud of areca palm (Areca catechu L.). Areca flower is a potential by-product of areca palm due to its long florescence and crowded inflorescences (Cheng et al., 2011). The planting area of areca plam is about 100,000 hectares in Hainan province of China. Many areca flowers are used for processing areca flower tea, which has been sold throughout the country and are deeply loved by people. Previous studies have indicated that areca flower contains a variety of nutrients and pharmaceutical properties (Lin and Li, 2010; Zhang et al., 2009). Moreover, as a potential antioxidant which is rich in polyphenol, areca flower is consumed as a material of functional food. In China, tea has been used as an anti-obesity therapy for more than a millennium (Yang et al., 2015). Tea contains abundant of polyphenolic fraction, the putative anti-obesity effects have been most commonly attributed to the polyphenolic compounds in tea. Our studies demonstrated catechin, rutin and naringenin were the main phenolic compounds in extracts of areca flower tea. As previously study, the anti-adipogenic activity of catechin in 3T3-L1 cells was determined, and results indicated that catechin exerted inhibitory activity on adipocyte differentiation via acting on early stage of adipogenesis (Liu et al., 2011). On the other hand, the effect of rutin on adipogenesis in 3T3-L1 preadipocyte was reported and results showed rutin reduced the intracellular TG accumulation (Jeon et al., 2014). Results also proved anti-obesity effect of rutin in obese rats was through decreasing the weight gain and adipose tissue (Hsu and Yen, 2007). Other polyphenolic compounds such as naringenin, chlorogenic acid was also demonstrated the anti-adipogenic activity. However, the direct effect of areca flower tea polyphenol extracts on adipogenesis has not been reported yet. Therefore, the study of areca flower tea polyphenol extracts (AFPE) on the adipogenesis can provide theoretical basis about the development of obesity and associated metabolic diseases. In addition, our results demonstrated an enormous potential application of AFPE in developing a variety of functional foods and other health products.
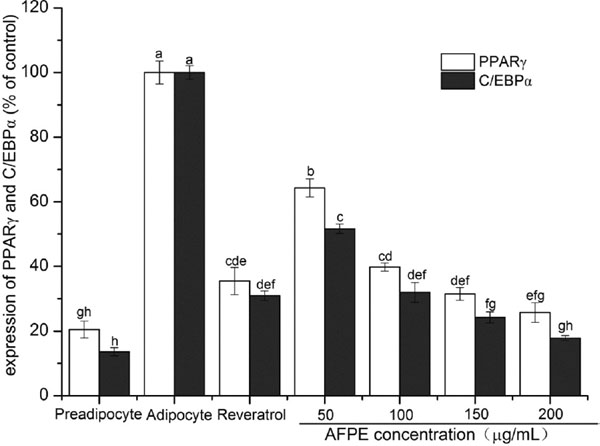
The differentiation and proliferation of preadipocytes is coordinated and regulated by several adipogenic molecules, which include a variety of growth factors, cytokines, and hormones. Adipogenesis is mainly regulated by two key adipogenic transcription factors, peroxisome proliferator-activated receptor γ (PPARγ) and CCAT/enhancer-binding protein α (C/EBPα), which plays key roles in regulating the adipogenesis and modulating the function of fat cells in adipose tissue (Choi et al., 2016). Many of studies have reported that the expression of PPARγ and C/EBPα were decreased in 3T3-L1 adipocytes treated with natural products (Ogawa et al., 2010). In view of this, the effects of areca flower tea polyphenol extracts on the expression of PPARγ and C/EBPα was studied, which could indicate whether areca flower tea polyphenol extracts has the potential to prevent obesity.
Therefore, the main objective of the present study was to evaluate the effects of areca flower tea polyphenol extracts on the adipogenic differentiation of 3T3-L1 preadipocytes by determination of lipid accumulation and identify several potential mechanisms that may be involved in this process.
Materials and Methods
Reagents MTT, Oil Red O, trypsin, insulin, dexamethasone, and 3-isobutyl-1-methylxanthine were purchased from Sigma (St. Louis, MO, USA). Dulbecco's Modified Eagle's Medium (DMEM) was obtained from Gibco (Grand Island, NY, USA). Fetal bovine serum (FBS) was purchased from Sijiqing (Hangzhou, China). The mouse TG ELISA kit, mouse LPL ELISA kit, mouse Leptin ELISA kit were purchased from Jingmei biotechnology (Jiangsu, China). The mouse PPARγ ELISA kit and mouse C/EBPα ELISA kit were purchased from Cusabio Co. (Wuhan, China). All other reagents were of the highest analytical grade and purchased from common sources.
Preparation of areca flower tea polyphenol extracts (AFPE) Areca flower tea was purchased from local supermarket in Hainan, China. Areca flower tea was shatter into powder, and extracted three times with boiling water for 1 h. The ratio of areca flower powder and water was 1:10. After filtered, all the mixture was centrifuged at 10,000 rpm for 10 min at room temperature, and the supernatant was collected. Extract was kept in a refrigerator after dried by the rotary evaporation (BUCHI, Switzerland) until use.
Resin adsorption technology is being explored to concentrate polyphenols. AB-8 resins were selected in this experiment, and pre-treatment was performed as previously described by Buran et al. (2014). As our previous study, the optimal extracting conditions were as follows: the sample pH 4.0, concentration of ethanol used as elution agent 60%, initial sample concentration 0.4 mg/mL, adsorption ratio and desorption ratio 3 BV/h. AB-8 resin performed great in separating and purifying polyphenols from areca flower tea. The polyphenols after purification was used for the later cell experiment.
Determination compositions of phenolic compounds The total phenolic content of the areca flower extract was measured following the method of Cheng et al. (2011). LC-20A HPLC (Tokyo, Japan) equipped with a binary pump delivery system was used for determining the phenolic composition. The AFPE were dried via rotary evaporation and redissolved using methanol, finally kept in dark after filtered through a 0.45 µm membrane until HPLC analysis. Phenolic acid compositions in the methanol solution were analyzed using reverse-phase HPLC with an Agilent ZORBAX SB-C18 column (4.6×250 mm, 5 µm). A linear gradient elution program was applied to separate the phenolic acids with a mobile phase including solvent A (acetic acid/H2O, 3:97, v/v) and solvent B (methanol). The solvent gradient for the separation was: 0 – 6 min, 10% B changing to 30% B; 6 – 40 min, 30% B changing to 70% B; 40 – 50 min, 70% B changing to 95% B; and 50 – 60 min, 95% B). Sample of 40 µL was injected, and the flow rate was 1 mL/min, and the column temperature was 30°C. Phenolic acids were measured at a wavelength of 280 nm. Identification of phenols was achieved by comparing the retention time of peaks in AFPE to the peaks of eight standard compounds. Quantitative analysis was based on the peak area by comparing with peak area of the standard compounds.
Cell culture 3T3-L1 cell line used in the experiment was purchased from the Institute of Biochemistry and Cell Biology (Shanghai, China). 3T3-L1 cells were maintained in DMEM high glucose medium supplemented with 10% fetal bovine serum in a humid atmosphere of 5% (v/v) CO2 and 95% (v/v) air at 37°C. Cells were treated with trypsin solution after reaching 70–80% confluence and cells cultured less than 6 passages were only used in this study.
Adipocyte differentiation Adipogenic differentiation was undergo as previously method with some modifications (Yang, et al., 2015). When the cells reached 100% confluency (0 d), they were stimulated for 2 d with induction medium containing DMEM high glucose medium with 10% FBS, 0.5 mM isobutylmethylxanthine, 0.25 µm dexamethasone and 10 µg/mL insulin. After 2 d, the medium was replaced with DMEM high glucose medium containing insulin (10 µg/mL) and 10% FBS for another 2 d. Finally, medium switched to the DMEM medium with 10% FBS for 4 d and the medium was changed every other day. For examining the effects of AFPE on adipocyte differentiation, 3T3-L1 preadipocytes were incubated with AFPE (50 – 200 µg/mL) from day 0 and day 8. Resveratrol (20 µg/mL) was used as a positive control. Then the cells were harvested for determining of lipid accumulation, triglyceride content and the expressions of adipocyte differentiation-related protein.
Cytotoxicity assay 3T3-L1 preadipocytes were induced to differentiate as described above. The cytotoxicity effect of AFPE was measured using an LDH cytotoxicity detection kit (Roche Applied Science, USA). At day 4 or 8, cytotoxicity was examined by LDH assays. LDH activity was measured according to the manufacturer's protocol, in culture supernatants and cell lysates to evaluate cytotoxicity.
Cell viability assay MTT viability assay was used for evaluating the cell viability. 3T3-L1 preadipocytes were plated into 96-well plates at a density of 1× 10⁴ cells/well in 200 µL of medium and cultured overnight. AFPE (50 – 200 µg/mL), dissolved in culture media, was added to each well and the cells were incubated for 48 h, with untreated cells as a control. After incubating, 20 µL MTT (5 mg/mL) reagents was added and incubated for 4 h at 37°C. Then MTT-formanzan crystals were solubilized with DMSO (150 µL/well), and the absorbance was determined at 570 nm using an ELISA plate Reader (Thermo Scientific, USA).
Oil-red O staining and quantification 3T3-L1 preadipocytes were planted at a density of 105 cells/well into 24-well plates and adipocyte differentiation was induced according to the method above for 8 d (Lee et al., 2015; Ishibashi et al., 2016). After this period, cells in culture plates were washed with phosphate-buffered saline twice and then fixed with 10% neutral formalin for 30 min at room temperature. Following this, formalin was removed and 0.3% oil-red O working solution (w/v, 60% isopropanol, 40% water) was added to each well for 1 h at room temperature, and then rinsed several times with water and air dried. The lipid droplets stained with oil-red O were observed and representative images were photographed. The oil-red O in triglyceride droplets was eluted with 100% isopropanol (1 mL) in order to quantitative analysis and absorbance was determined at OD510 nm. Results were expressed as percentage of Oil Red O stained material compared to control.
Measurement of triglyceride (TG) content The cell extracts were collected after a treatment period of 8 d as described above. The mature adipocytes were allowed to wash twice with PBS, collected using a cell scraper. Cell collections were subject to repeat freezing and thawing for three times. The supernatants were assayed for TG content after centrifugation at 12,000 g for 5 min at 4°C with the manufacturer's protocol. The total protein content was determined by Bradford method.
On the ELISA plate, blank control group, standard sample group (different concentrations, 2 – 32 nmol/L) and the test sample group were set up. 50 µL sample of interest was added, and plate was incubated at 37°C for 30 min, then liquid was discarded completely. Each well was filled with washing buffer and repeated washing for 5 times. Enzyme standard reagent 50 µL (except the blank well) was added, and plate was incubated at 37°C for 30 min and washed for 5 times. After adding chromogenic agent A 50 µL and chromogenic agent B 50 µL and blending by gently shaking, ELISA plate was incubated at 37°C for 10 min in the dark, then 50 µL terminated buffer was added to each well. Absorbance was determined immediately at OD 450 nm. Standard curve and regression equation was obtained and the concentrations of the samples were calculated according to the regression equation. Results were expressed as mg of TG per mg of cellular protein.
Measurement of leptin secretion 3T3-L1 cells were planted in 24-well plates and cells were incubated with or without the indicated concentrations of AFPE (50 – 200 µg/mL) after adipocyte differentiation induced for 8 d as described above. The culture supernatant was collected for a quantitative determination at 0, 2, 4 and 8 d. The media of the cells were centrifuged for 3 min at 12,000 rpm, and the supernatants were collected. The leptin levels in cell culture supernatants were measured using a mouse leptin ELISA kit in the light of manufacturer's instructions, and the operating procedures were similar with measurement of TG content. A standard curve was obtained in the range of leptin from 50 – 800 pg/mL. The leptin concentration was calculated from the standard curve.
Measurement of LPL, PPARγ and C/EBPα expression 3T3-L1 cells were inoculated in 6-well plates at a volume of 2 mL and harvested after 8 d of adipocyte differentiation as described above. For quantitative analysis, the total protein of cells was obtained on the last day following the method described above. The content of lipoprotein lipase (LPL), PPARγ and C/EBPα were detected using mouse LPL ELISA kit, mouse PPARγ ELISA kit, and mouse C/EBPα ELISA kit following the manufacturer's instructions. The operating procedures were similar with measurement of TG content.
Statistical analysis Statistical analysis of the data was done with SPSS statistical analysis software. Results were expressed as means ± standard deviation from three independent replicates. One-way ANOVA followed by Duncan's multiple-range test was used to assess the differences between the individual groups. Differences were considered significant when P < 0.05.
Results
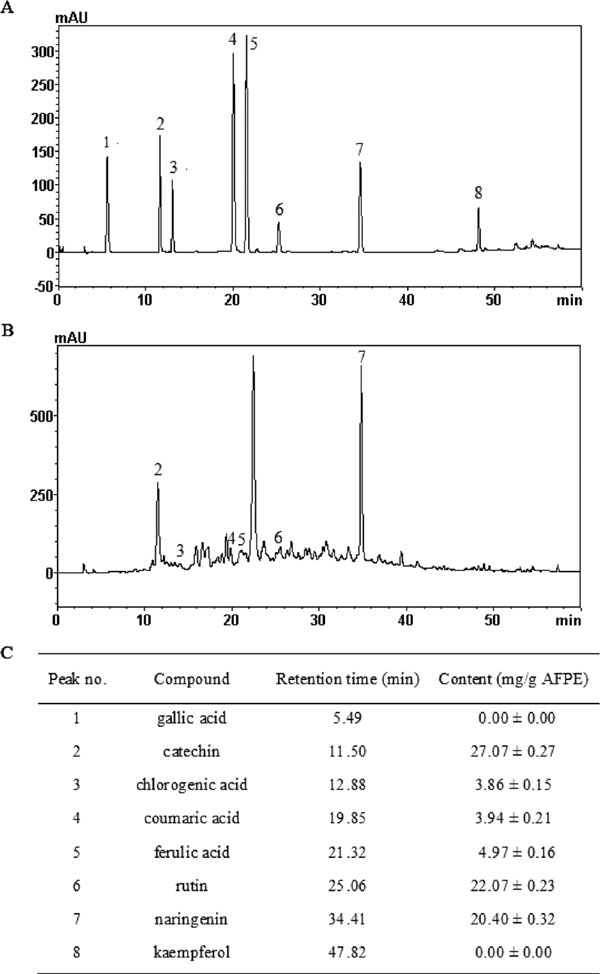
Identification of active components in AFPE by using HPLC The HPLC chromatography of standard and AFPE were showed in Fig.1A and B. Fig.1B showed three major peaks and some minor peaks. These peaks were identified according to compare the retention times of various standards. The active components were catechin, rutin, naringenin, ferulic acid, coumaric acid, chlorogenic acid, as well as unknown components without standards. Detailed chemical information on the compounds was presented in Fig.1C. The contents of catechin, rutin, naringenin in AFPE were estimated to be 27.07 ± 0.27, 22.07 ± 0.23 and 20.40 ± 0.32 mg/g AFPE, respectively.
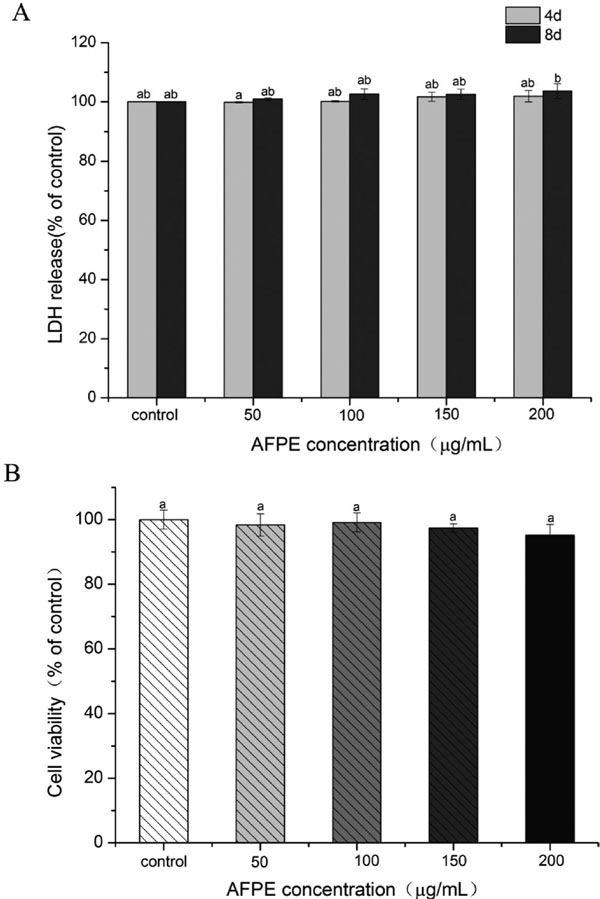
Effect of AFPE on 3T3-L1 cytotoxicity and cell viability To assess any cytotoxic effects of AFPE, cytotoxicity in 3T3-L1 preadipocyte were examined by LDH assays. Results showed that AFPE did not cause cytotoxicity at 4 d and 8 d during differentiation (Fig.2A). In order to assess the effects of AFPE on cell proliferation of 3T3-L1 preadipocyte, cells were treated with or without AFPE at different concentrations (50 – 200 µg/mL) for 48 h. Then the cell viability was measured by MTT assay (Fig.2B). It was obvious that AFPE concentrations at 50 – 200 µg/mL could not significantly decrease the cell viability of 3T3-L1 preadipocytes. However, cell viability was decreased when concentrations of AFPE up to 400 µg/mL (data not shown). Our results indicated that AFPE did not exhibit any obvious toxicity on 3T3-L1 preadipocytes at the tested concentration.
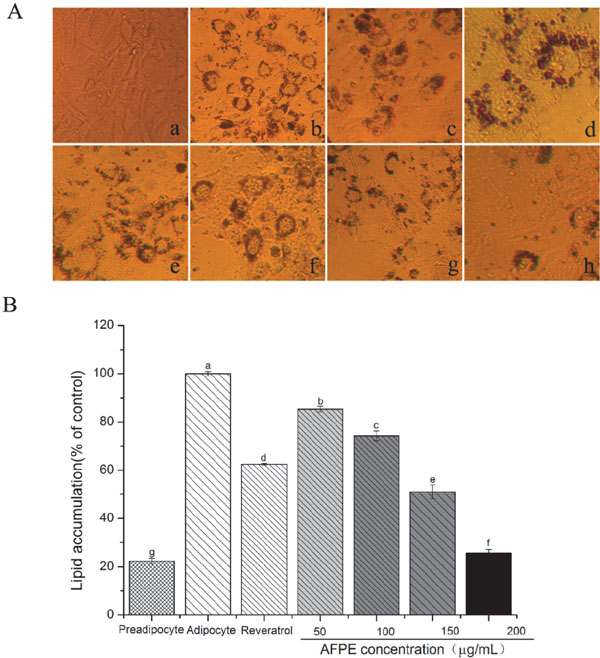
Effects of AFPE on differentiation from preadipocytes to adipocytes To investigate the effects of AFPE on differentiation, oil-red O staining was conducted after induction of differentiation for 8 d. When adipogenic stimulation started, 3T3-L1 preadipocytes gradually rounded, formed small oil droplets that coalesced into larger oil droplets, and finally differentiated into ring-like mature adipocytes (as shown in Fig.3Aa–d). After induction, completely differentiation was observed in control group, and in AFPE treated groups, the stained area for Oil-red O was significantly decreased (Fig.3Ae–h). Quantitative analysis (data shown in Fig.3B) of oil-red O staining also displayed that the AFPE treatment had a greater inhibitory effect on lipid accumulations in a concentration-dependent manner compared with the control group. The accumulation of lipid in AFPE treatment groups was decreased to 85.36 ± 1.12%, 74.25 ± 2.01%, 51.06 ± 2.89% and 25.62 ± 1.46%, at concentration of 50, 100, 150 and 200 µg/mL, respectively. It is well known that resveratrol can exert anti-obesity effects by inhibiting differentiation of 3T3-L1 preadipocytes (Lasa et al., 2012; Yang et al., 2008; Aguirre et al., 2014). Thus, resveratrol was used as a positive control. Results showed that the accumulation of lipid after resveratrol (20 µg/mL) was 62.49 ± 0.39% of control group.
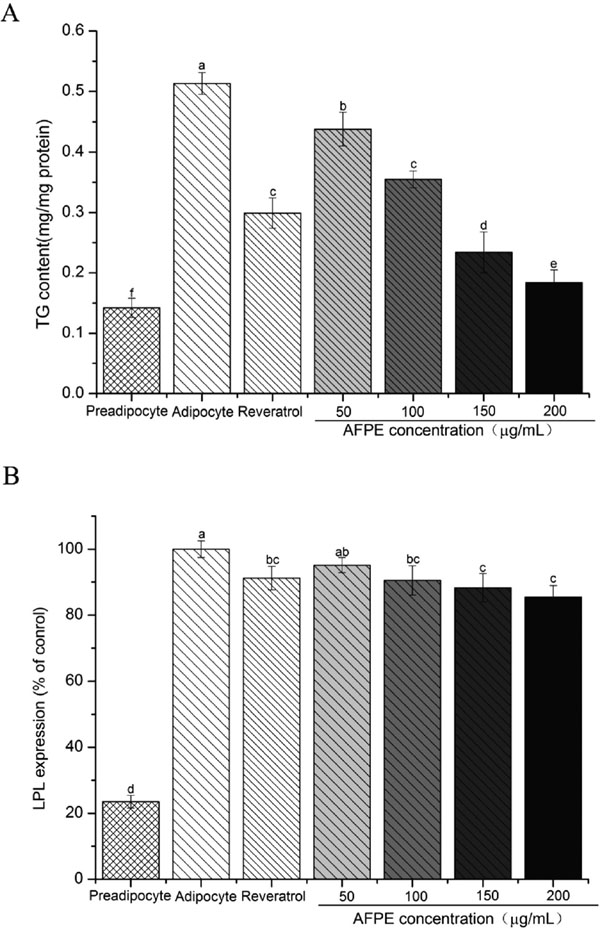
Effects of AFPE on intracellular TG content in 3T3-L1 Adipocytes As shown in Fig.4A, the accumulation of TG was significantly reduced in a dose-dependent manner of groups incubated with AFPE. The TG content in adipocytes cells was reduced to 35.86% of control cells with the treatment of 200 µg/mL of AFPE, showed the highest inhibitory effect of triglyceride accumulation. After the resveratrol (20 µg/mL) treated, TG content reduced to 58.28% of compared to control. The TG content was coincided with the increased lipid accumulation. These results supported the anti-adiposity potential of AFPE in mature adipocytes.
Effects of AFPE on leptin secretion Differentiating 3T3-L1 preadipocytes treated with AFPE could result in a dose-dependent decrease of leptin release into the culture medium. Significant reduction was found in 3T3-L1 cells treated with AFPE at concentration of 50 – 200 µg/mL (P < 0.01), compared to control cells. During the intermediate stage (day 4), 150 and 200 µg/mL AFPE treated induced an approximately 44.99% and 32.11% decrease in the secretion of leptin (P < 0.01). In later stage of differentiation of adipocytes, the expression of leptin was markedly suppressed up to 42.75% and 20.18% by 150 and 200 µg/mL AFPE treated. It was better than the positive control (resveratrol, 20 µg/mL) on the decrease of leptin secretion. From these results, it was suggested that AFPE inhibited the secretion of leptin associated with both stage of adipogenesis.
Effects of AFPE on the modulation of adipocyte differentiation-related protein The results shown in Fig.4B and Fig.5 suggested that there was a significant decrease in the expression of LPL, PPARγ and C/EBPα in 3T3-L1 preadipocytes when induced to differentiate by AFPE in dose-dependent manner. It was evident from the data shown in Fig.4B that there was a small decrease in the expression of LPL. However, a significant was noted on the decrease in expression levels of PPARγ and C/EBPα (P < 0.05) (Fig.5). These results reconfirmed that AFPE have effective inhibitory on the differentiation of 3T3-L1 preadipocytes.
Discussion
3T3-L1 preadipocytes are used widely to research functions and lipid metabolism of adipocytes after differentiation induced with a hormone cocktail, which will turn them into mature adipocytes with characteristics of growth, metabolism, and fat accumulation mature adipocytes (Zhang et al., 2014). Adipocytes differentiation and fat accumulation are strongly associated with the occurrence and development of obesity. Hence, a number of scientists believed adipocytes could be used as a therapeutic target for obesity and obesity-related diseases. However, effective, safe, natural anti-obesity drugs that can improve energy imbalance and lipid metabolism are urgently required.
Treating obesity with the currently available drugs is usually associated with serious negative effects (Kowalska et al., 2015). Therefore, new studies focus attentions on some food component on negative side effects for the prevention and therapy of obesity. Many medicinal plants and their extracts have been used as dietary supplements because of their beneficial effects on health. In particular, polyphenols, a major group of plant metabolites, have been demonstrated to exhibit many beneficial properties, such as antioxidant, antimicrobial, antitumor, antihypertensive, anti-mutagenic, anti-thrombotic, anti-inflammatory, anti-diabetic and anti-obesity activities (Habtemariam and Varghese, 2014; Liu et al., 2013; Marin et al., 2015; Peng et al., 2005; Rodrigo et al., 2012; Sun et al., 2012; Tan et al., 2015; Xu et al., 2012; Yi et al., 2015). An increasing number of phenolic compounds have been observed to fight obesity in vitro or in vivo studies (Chang et al., 2016; Ko et al., 2015). These natural phenolics are considered to be associated with fewer side effects as they are commonly distributed in foodstuffs and natural herbs. It seems that it is very needed to interpret the mechanisms by which phenolic compounds could improve the functions of adipocyte. Thus, this study investigated the effect of areca flower tea polyphenol extract (AFPE) on differentiation of 3T3-L1 preadipocytes.
Using HPLC, we demonstrated that the phenolic compounds of AFPE contained several major compounds, including catechin, rutin and naringenin (Fig.1). These constituents were illustrated to be effective in suppressing adipocyte differentiation. Choi et al. (2006) reported the effects of catechin, rutin, naringin, p-coumaric acid and chlorogenic acid on suppressing adipocyte differentiation in 3T3-L1 cells, most of them inhibited adipocyte development from preadipocytes to a certain degree. Although catechin inhibited adipocyte differentiation, it was not significant (P > 0.05). It was noted that rutin was the most effective in inhibiting adipogenic development in preadipocytes, and results revealed that mRNA expression of adipogenic transcription factors such as PPARγ and C/EBPα in 3T3-L1 cells were significantly down regulated after rutin (0.5 mg/mL) treatment. The previous study also discovered that naringenin (25 µg/mL) resulted in a substantial inhibition of lipid accumulation and inhibited adipogenesis by blocking the induction of PPARγ, aP2, STAT5A and adiponectin expression (Richard et al., 2013). Kang et al. (2013) pointed out that p-Coumaric acid may have anti-adipogenesis effects by suppressing expression of adipogenic transcriptional factors during the late phase of adipogenesis. It was also noted that chlorogenic acid and caffeine reduced fat accumulation and body weight gain through regulating the activities and mRNA and protein expression levels of hepatic lipid metabolism-related enzymes, meanwhile, these effects are stronger than those exerted by chlorogenic acid and caffeine individually (Zheng et al., 2014). As mentioned above, AFPE contributing to the anti-adipogenic effect would be due to the multiple bioactive compounds.
Results from our LDH and MTT experiments showed that AFPE at 50 – 200 µg/mL have no significant toxicity on 3T3-L1 preadipocytes (Fig.2). In addition, the findings of the present study suggested that AFPE suppressed the ability of the 3T3-L1 preadipocyte cell to undergo adipocyte differentiation in vitro. Fig.3 and Fig.4 depicted the significantly anti-adipogenic effect on 3T3-L1 preadipocytes differentiated. The accumulation of lipid in AFPE treatment groups was decreased to 85.36 ± 1.12%, 74.25 ± 2.01%, 51.06 ± 2.89% and 25.62 ± 1.46% (Fig.3B), respectively, at the concentration of 50, 100, 150 and 200 µg/mL. Additionally, the accumulation of TG was significantly reduced in a dose-dependent manner after treated with different concentration of AFPE (Fig.4A). Lipid metabolism in adipocytes is controlled by multiple factors. Since AFPE decreased lipid accumulation and TG content during differentiation from 3T3-L1 preadipocytes into adipocytes, the study of examining whether AFPE affected the lipogenesis was performed.
Adipose tissue has the ability to secrete plenty of adipocytokines, including adiponectin and leptin, which associated with the development of adipocytes. Leptin is a multifunctional protein and it plays an important role in the regulation of body energy. From previously studies, we knew lipid accumulation in maturing adipocytes was significantly reduced by the secretion of leptin, demonstrating an inhibitory effect of leptin on adipogenesis (Kowalska et al., 2015). Lee et al. (2011) reported that silk protein hydrolysate suppressed fat accumulation through directly up-regulation of leptin during differentiation of 3T3-L1 preadipocytes. However, kowalska et al. confirmed that lyophilized cranberries inhibit lipid metabolism with a decreased leptin gene expression (Kowalska et al., 2015). In our study, the effect of AFPE on regulation of the leptin secretion during differentiation from 3T3-L1 preadipocytes into adipocytes was examined. An obvious down-regulation of leptin secretion was observed when cells differentiated in the presence of AFPE (Table 1). Leptin is secreted almost exclusively by adipocytes, so the secretion level of leptin associated with the development of adipocytes.
Table 1.
Effects of different AFPE concentrations on leptin secretion during differentiation of 3T3-L1 preadipocytes
| Group |
Leptin secretion (pg/mL) |
| 2 d |
4 d |
8 d |
| control |
58.12 ± 0.17a |
113.17 ± 0.15a |
180.18 ± 0.26a |
| Positive control |
41.03 ± 0.24d |
75.46 ± 0.21d |
92.71 ± 0.23d |
| AFPE 50 µg/mL |
51.73 ± 0.09b |
90.57 ± 0.13b |
135.68 ± 0.17b |
| AFPE 100 µg/mL |
43.34 ± 0.18c |
81.40 ± 0.09c |
119.99 ± 0.08c |
| AFPE 150 µg/mL |
36.27 ± 0.21e |
50.92 ± 0.24e |
77.02 ± 0.14e |
| AFPE 200 µg/mL |
35. 04 ± 0.06f |
36.34 ± 0.57f |
36.37 ± 0.23f |
3T3-L1 preadipocytes were treated without (control) or with AFPE (50 – 200 µg/mL) during adipogenesis and induced differentiation for 8 d. Positive control: resveratrol (20 µg/mL). All data represent as means ± SD of three independent experiments. Mean values with different letters were determined to be significantly different by one-way ANOVA followed by Duncan's test (P < 0.05).
LPL has an important function in the decomposition of lipids into fatty acids and monoacylglycerol. In the previous studies, it was reported that LPL expression increased in the process of 3T3-L1 preadipocyte differentiation, meanwhile adipocytes fat deposits increased, revealing a direct correlation between LPL expression of adipocyte and lipid accumulation (Gonzales and Orlando, 2007; Kowalska et al., 2015). The LPL levels of adipocytes were measured as an index of lipid accumulation in this study, and ELISA experiment results demonstrated that AFPE reduced LPL expression of 3T3-L1 adipocytes in a concentration-dependent manner. Down-regulation of LPL expression by AFPE evinces suppression of 3T3-L1 preadipocytes differentiated into mature adipocytes and inhibition of lipogenesis, resulting in reduced fat accumulation. The differentiation and development of preadipocytes to mature adipocytes is an ordered sequential process regulated by a variety of proteins, which can adjust the expression of adipocyte-specific genes in various time point of differentiation. PPARγ and C/EBPα have been well recognized to function together in activating adipocyte genes and consequently leading to adipocyte differentiation.
Emerging evidence demonstrates that PPARγ activation increases the rate and level of adipocyte differentiation in 3T3-L1 (Staels and Fruchart, 2005). PPARγ is considered as a master regulator of adipogenesis and also required at the differentiated state (Rosen and MacDougald, 2006), since it induces various adipocyte-specific genes which correlates with lipid accumulation and fatty acid metabolism (Lee et al., 2015). Many study found that activation of PPARγ induce the expression of fatty acid binding protein, fatty acid translocase and lipoprotein lipase (Noh et al., 2013). In previous study, it has been proved that some compounds enhance adipogenesis through PPARγ activation. However, other studies reported that some compounds can be as inhibitor of PPARγ in adipogenesis. C/EBP family members are involved in adipogenic induction and C/EBPα is responsible for the maintenance of PPARγ expression and functions to transactivate the promoters of various adipocyte genes, such as GLUT4, SCD1, leptin, and the insulin receptor (Tan et al., 2015). In the current study, exposing 3T3-L1 cells to AFPE was found to restrain the expression of PPARγ and C/EBPα significantly in a concentration-dependent manner (P < 0.01), confirmed that AFPE is a major active compound exhibiting anti-obesity activity.
Collectively, the current data presented in this study provided for the first time a basis for understanding the effects of AFPE on modulating the function of adipocyte. Therefore, AFPE could be suggested as valuable ingredients of functional food products programmed for prevention and therapy of obesity and obesity-related metabolic diseases.
Acknowledgments This work was supported by the grants from the Natural Science Foundation of Hainan Province (No.314146) and Central Public-interest Scientific Institution Basal Research Fund for Chinese Academy of Tropical Agricultural Sciences (No.1630152017017).
References
- Aguirre, L., Fernández-Quintela, A., Arias, N., and Portillo, M.P. (2014). Resveratrol: anti-obesity mechanisms of action. Molecules, 19, 18632-18655.
- Buran, T.J., Sandhu, A.K., Li, Z., Rock, C.R., Yang, W.W., and Gu, L. (2014). Adsorption/desorption characteristics and separation of anthocyanins and polyphenols from blueberries using macroporous adsorbent resins. J. Food Eng., 128, 167-173.
- Chang, Y.C., Yang, M.Y., Chen, S.C., and Wang, C.J. (2016). Mulberry leaf polyphenol extract improves obesity by inducing adipocyte apoptosis and inhibiting preadipocyte differentiation and hepatic lipogenesis. J. Funct. Foods, 21, 249-262.
- Chen, Q.P., Wu, X.Q., Liu, L.L., and Shen, J.F. (2014). Polyphenol-rich extracts from Oiltea camellia prevent weight gain in obese mice fed a high-fat diet and slowed the accumulation of triacylglycerols in 3T3-L1 adipocytes. J. Funct. Foods, 9, 148-155.
- Chen, S., Li, Z., Li, W., Shan, Z., and Zhu, W. (2011). Resveratrol inhibits cell differentiation in 3T3-L1 adipocytes via activation of AMPK. Can. J. Physiol. Pharm., 89, 793-799.
- Cheng, F., Chen, W., Huang, Y., Zhang, C., Shen, Y., Hai, H., Zheng, Y., Tang, M., Zhao, S., and Liu, J. (2011). Protective effect of areca inflorescence extract on hydrogen peroxide-induced oxidative damage to human serum albumin. Food Res. Int., 44, 98-102.
- Cho, A.S., Jeon, S.M., Kim, M.J., Yeo, J., Seo, K.I., Choi, M.S., and Lee, M.K. (2010). Chlorogenic acid exhibits anti-obesity property and improves lipid metabolism in high-fat diet-induced-obese mice. Food Chem. Toxicol., 48, 937-943.
- Choi, I., Park, Y., Choi, H., and Lee, E. H. (2006). Anti-adipogenic activity of rutin in 3T3-L1 cells and mice fed with high-fat diet. Biofactors, 26, 273-281.
- Choi, S.K., Park, S., Jang, S., Cho, H.H., Lee, S., You, S., Kim, S.H., and Moon, H.S. (2016). Cascade regulation of PPARγ2 and C/EBPα signaling pathways by celastrol impairs adipocyte differentiation and stimulates lipolysis in 3T3-L1 adipocytes. Metabolism, 65, 646-654.
- Furuyashiki, T., Nagayasu, H., Aoki, Y., Bessho, H., Hashimoto, T., Kanazawa, K., and Ashida, H. (2004). Tea catechin suppresses adipocyte differentiation accompanied by down-regulation of PPARgamma2 and C/EBPalpha in 3T3-L1 cells. Biosci. Biotech. Biochem., 68, 2353-2359.
- Gonzales, A.M. and Orlando, R.A. (2007). Role of adipocyte-derived lipoprotein lipase in adipocyte hypertrophy. Nutr. Metab., 4, 1-9.
- Gregoire, F.M. (2001). Adipocyte differentiation: from fibroblast to endocrine cell. Exp. Biol. Med., 226, 997-1002.
- Habtemariam, S. and Varghese, G.K. (2014). The antidiabetic therapeutic potential of dietary polyphenols. Curr. Pharm. Biotechnol., 15, 391-400.
- Hsu, C.L. and Yen, G.C. (2007). Effects of flavonoids and phenolic acids on the inhibition of adipogenesis in 3T3-L1 adipocytes. J. Agric. Food Chem., 55, 8404-8410.
- Ishibashi, K., Nehashi, K., Oshima, T., Ohkura, N., and Atsumi, G.I. (2016). Differentiation with elaidate tends to impair insulin-dependent glucose uptake and GLUT4 translocation in 3T3-L1 adipocytes. Int. J. Food Sci. Nutr., 67, 99-110.
- Jeon, J.K., Lee, J., and Imm, J.Y. (2014). Effects of laccase-catalyzed rutin polymer fraction on adipogenesis inhibition in 3T3-L1 adipocytes. Process Biochem., 49, 1189-1195.
- Kang, S.W., Kang, S.I., Shin, H.S., Yoon, S.A., Kim, J.H., Ko, H.C., and Kim, S.J. (2013). Sasa quelpaertensis Nakai extract and its constituent p-coumaric acid inhibit adipogenesis in 3T3-L1 cells through activation of the AMPK pathway. Food Chem. Toxicol., 59, 380-385.
- Ko, H.J., Lo, C.Y., Wang, B.J., Chiou, R.Y.Y., and Lin, S.M. (2015). Theaflavin-3,3′-digallate, a black tea polyphenol, stimulates lipolysis associated with the induction of mitochondrial uncoupling proteins and AMPK-FoxO3A-MnSOD pathway in 3T3-L1 adipocytes. J. Funct. Foods, 17, 271-282.
- Kopelman, P.G. (2000). Obesity as a medical problem. Nature, 404, 635-643.
- Kowalska, K., Olejnik, A., Rychlik, J., and Grajek, W. (2015). Cranberries (Oxycoccus quadripetalus) inhibit lipid metabolism and modulate leptin and adiponectin secretion in 3T3-L1 adipocytes. Food Chem., 185, 383-388.
- Lasa, A., Schweiger, M., Kotzbeck, P., Churruca, I., Simón, E., Zechner, R., and Portillo, M. (2012). Resveratrol regulates lipolysis via adipose triglyceride lipase. J. Nutr. Biochem., 23, 379-384.
- Lee, D., Park, H.Y., Kim, S., Park, Y., Bang, M.H., and Imm, J.Y. (2015). Anti-adipogenic effect of oat hull extract containing tricin on 3T3-L1 adipocytes. Process Biochem., 50, 2314-2321.
- Lee, H.S., Lee, H.J., and Suh, H.J. (2011). Silk protein hydrolysate increases glucose uptake through up-regulation of GLUT 4 and reduces the expression of leptin in 3T3-L1 fibroblast. Nutr. Res., 31, 937-943.
- Liao, C.C., Ou, T.T., Huang, H.P., and Wang, C.J. (2014). The inhibition of oleic acid induced hepatic lipogenesis and the promotion of lipolysis by caffeic acid via up-regulation of AMP-activated kinase. J. Sci. Food Agr., 94, 1154-1162.
- Lin, E.S. and Li, C.C. (2010). Evaluation of superoxide radical scavenging capacity and reducing power of areca flower extracts. J. Med. Plants Res., 4, 975-981.
- Liu, C.X., Lin, Z.X., Lu, Z., Wang, Y.M., and Bao, Y.L. (2013). Antitumor and scavenging radicals activities of some polyphenols related to dehydroabietylamine derivatives. J. Asian. Nat. Prod. Res., 15, 819-827.
- Liu, Q., Shin, E., Ahn, M.J., Hwang, B.Y., and Lee, M.K. (2011). Anti-adipogenic activity of acer tegmentosum and its constituent, catechin in 3T3-L1 Cells. Nat. Prod. Sci., 17, 212-215.
- Marin, L., Miguelez, E.M., Villar, C.J., and Lombo, F. (2015). Bioavailability of dietary polyphenols and gut microbiota metabolism: antimicrobial properties. Biomed Res. Int., http:dx.doi.org/10.1155/2015/905215.
- Noh, J.R., Kim, Y.H., Hwang, J.H., Gang, G.T., Yeo, S.H., Kim, K.S., Oh, W.K., Ly, S.Y., Lee, I.K., and Lee, C.H. (2013). Scoparone inhibits adipocyte differentiation through down-regulation of peroxisome proliferators-activated receptor γ in 3T3-L1 preadipocytes. Food Chem., 141, 723-730.
- Ogawa, T., Tabata, H., Katsube, T., Ohta, Y., Yamasaki, Y., Yamasaki, M., and Shiwaku, K. (2010). Suppressive effect of hot water extract of wasabi (Wasabia japonica Matsum.) leaves on the differentiation of 3T3-L1 preadipocytes. Food Chem., 118, 239-244.
- Peng, N., Clark, J.T., Prasain, J., Kim, H., White, C.R., and Wyss, J.M. (2005). Antihypertensive and cognitive effects of grape polyphenols in estrogen-depleted, female, spontaneously hypertensive rats. Am. J. Physiol. 289, R771-775.
- Richard, A.J., Amini-Vaughan, Z., Ribnicky, D.M., and Stephens, J.M. (2013). Naringenin inhibits adipogenesis and reduces insulin sensitivity and adiponectin expression in adipocytes. J. Evidence-Based Complementary. Altern. Med. http://dx.doi.org/10.1155/2013/549750.
- Rodrigo, R., Gil, D., Miranda-Merchak, A., and Kalantzidis, G. (2012). Antihypertensive role of polyphenols. Adv. Clin. Chem., 58, 225-254.
- Spalding, K.L., Arner, E., Westermark, P.O., Bernard, S., Buchholz, B.A., Bergmann, O., Blomqvist, L., Hoffstedt, J., Näslund, E., Britton, T., Concha, H., Hassan, M., Rydén, M., Frisén, J., and Arner, P. (2008). Dynamics of fat cell turnover in humans. Nature, 453, 783-787.
- Spiegelman, B.M. and Flier, J.S. (2001). Obesity and the regulation of energy balance. Cell, 104, 531-543.
- Staels, B. and Fruchart, J.C. (2005). Therapeutic roles of peroxisome proliferator-activated receptor agonists. Diabetes, 54, 2460-2470.
- Sun, T., Chen, Q.Y., Wu, L.J., Yao, X.M., and Sun, X.J. (2012). Antitumor and antimetastatic activities of grape skin polyphenols in a murine model of breast cancer. Food Chem. Toxicol., 50, 3462-3467.
- Tan, H.Y., Tse, I.M.Y., Li, E.T.S., and Wang, M. (2015). Inhibitory effects of oxyresveratrol and cyanomaclurin on adipogenesis of 3T3-L1 cells. J. Funct. Foods, 15, 207-216.
- Wang, S., Xu, Q., Shu, G., Wang, L., Gao, P., Xi, Q., Zhang, Y., Jiang, Q., and Zhu, X. (2015). N-Oleoyl glycine, a lipoamino acid, stimulates adipogenesis associated with activation of CB1 receptor and Akt signaling pathway in 3T3-L1 adipocyte. Biochem. Biophys. Res. Commun., 466, 438-443.
- Wu, T., Jiang, Z., Yin, J., Long, H., and Zheng, X. (2016). Anti-obesity effects of artificial planting blueberry (Vaccinium ashei) anthocyanin in high-fat diet-treated mice. Int. J. Food Sci. Nutr., 67, 257-264.
- Xu, H.L., Kitajima, C., Ito, H., Miyazaki, T., Baba, M., Okuyama, T., and Okada, Y. (2012). Antidiabetic effect of polyphenols from brown alga Ecklonia kurome in genetically diabetic KK-A(y) mice. Pharm. Biol., 50, 393-400.
- Yang, J.Y., Della-Fera, M.A., Rayalam, S., Ambati, S., Hartzell, D.L., Park, H.J., and Baile, C.A. (2008). Enhanced inhibition of adipogenesis and induction of apoptosis in 3T3-L1 adipocytes with combinations of resveratrol and quercetin. Life Sci., 82, 1032-1039.
- Yang, Y., Qiao, L., Zhang, X., Wu, Z., and Weng, P. (2015). Effect of methylated tea catechins from Chinese oolong tea on the proliferation and differentiation of 3T3-L1 preadipocyte. Fitoterapia, 104, 45-49.
- Yi, J., Wang, Z., Bai, H., Yu, X., Jing, J., and Zuo, L. (2015). Optimization of Purification, Identification and Evaluation of the in Vitro Antitumor Activity of Polyphenols from Pinus Koraiensis Pinecones. Molecules, 20, 10450-10467.
- Zhang, F., Yu, H.N., Cui, X.M., Wang, Z.C., Shen, S.R., and Das, U.N. (2014). Effect of yellow capsicum extract on proliferation and differentiation of 3T3-L1 preadipocytes. Nutrition, 30, 319-325.
- Zhang, W.M., Li, B., Han, L., and Zhang, H.D. (2009). Antioxidant activities of extracts from areca (Areca catectu L.) flower, husk and seed. African. J. Biotechnol., 8, 3887-3892.
- Zheng, G., Qiu, Y., Zhang Q.F., and Li, D. (2014). Chlorogenic acid and caffeine in combination inhibit fat accumulation by regulating hepatic lipid metabolism-related enzymes in mice. Br. J. Nutr., 112, 1034-1040.