Abstract
Wheat bran has a high dietary fiber content. In this study, we investigated the effects of short-term intake of wheat bran on intestinal environment in a murine model. Mice were fed with AIN-93G for 1 week, followed by experimental diets containing wheat bran with an average particle size of 53 µm (powdered) or 350 µm (granulated) for 1 additional week. During a 4-week period (twice-repeated feeding cycles), the ratio of bacteria belonging to the families Prevotellaceae and S24-7 increased in murine feces after intake of both particle-size diets. Furthermore, the amount of short fatty acids, particularly butyric acid, and cecal immunoglobulin A were significantly increased in the powdered wheat bran group, probably by the changes in intestinal microbiota composition. These findings may potentially explain many of the health benefits through the alteration of intestinal microbiota, even after short-term intake of wheat bran.
Introduction
Wheat bran is a by-product of wheat production and accounts for about 25% of grain weight (Reisinger et al., 2013). However, most wheat bran is used as livestock feed; therefore, more valuable utilization in food products for humans is desirable. Wheat bran contains high levels of dietary fiber, including lignin, cellulose, arabinoxylan (pentosan) and other non-starch polysaccharides (Zhao and Dong, 2016). High-fiber foods such as cereal bran are known to provide human health benefits by changing intestinal microbiota (Kontula et al. 1998; Sheflin et al., 2016; Ou et al., 2016). Because dietary fiber is resistant to digestive enzymes, it reaches the distal intestine and is used as an energy source for intestinal microbiota (Gibson et al., 1995).
Short-chain fatty acids (SCFAs) are essential substances for peristalsis and contribute a variety of beneficial effects on host health. Specific intestinal bacteria ferment dietary fiber and produce SCFAs, mainly acetic acid, propionic acid and butyric acid (Cummings and Bingham, 1987). Acetic acid improves intestinal defense mediated by epithelial cells (Fukuda et al., 2011). Propionic acid and butyric acid promote the differentiation of regulatory T cells and interleukin (IL) 10-producing T cells (Arpaia et al., 2013; Feng et al., 2015). SCFAs also stimulate two gut hormones, glucagon-like peptide 1 (GLP-1) and peptide YY (PYY), released from enteroendocrine L cells through the activation of free fatty acid reporter 2 (FFAR2) (Lin et al., 2012). GLP-1 induces the postprandial release of insulin from pancreatic β-cells (Farilla et al., 2003). PYY suppresses appetite and prevents bulimia. These two hormones are considered to be targets for the treatment of insulin-resistant type 2 diabetes and/or amelioration of obesity (Batterham et al., 2002; Batterham et al., 2003).
Secretary immunoglobulin A (IgA) is the most abundant antibody for the mucosal immune system and plays a key role in alteration of intestinal microbiota (Kawamoto et al., 2014). IgA secreted in the gastrointestinal tract protects the intestinal epithelium from enteric pathogens and toxic agents such as cholera toxin to reduce the risk (Macpherson et al., 2001; Macpherson et al., 2008), while IgA may be utilized for the colonization of certain resident bacteria in the intestinal microbiota by IgA binding (Kawamoto et al., 2014). IgA secretion has also been correlated with SCFA production in rat cecum by intake of fructooligosaccharide for 4 and 8 weeks (Yamamoto et al., 2016). Accordingly, dietary fiber is of significance for the maintenance of intestinal homeostasis due to the production of SCFAs, gut hormones and secretory IgA through bacterial fermentation.
It has been reported that long-term intake of wheat bran induces SCFA production and inhibits colon carcinogenesis in mice (for 33 weeks), and reduces the risk of diabetes in rats (16 weeks) (Takahashi et al., 1999; Numan and Rabah, 2015). Other studies have shown that SCFA production is increased in vitro by fermentation of fecal bacteria using wheat bran with smaller-size particle (90 µm of diameter) rather than larger-size particle (500 µm) (Dziedzic et al., 2016), but no such production was observed in the cases of particle sizes of 551 µm and 1,239 µm in vitro (Stewart and Slavin, 2009). However, the benefits of short-term intake of wheat bran and the in vivo effects of particle-size differences remain unclear. In this study, we investigated changes in the intestinal environment (microbiota composition, SCFA production, gut-hormone expression, and IgA secretion) by 1-week feeding (twice-repeated cycles) with wheat bran of different particle sizes.
Materials and Methods
Sample preparation Particle sizes D50 = 53 µm (powdered) and D50 = 350 µm (granulated) of wheat bran (D50: value of particle diameter at 50% in the cumulative distribution) were prepared using a rotor mill to reduce particle size at Nisshin Pharma Inc. (Tokyo, Japan).
Experimental diets The composition of diets is shown in Table 1. For preparation of diets with powdered wheat bran (PWB) and granulated wheat bran (GWB), cellulose that was included in AIN-93G was replaced with wheat bran containing the same amount of fibers. Concentrations of carbohydrate, protein and fat in the diets were matched by reducing the amount of corn starch, milk casein and soybean oil in PWB and GWB diets. Prepared experimental diets were stored at 4°C.
Table 1.
Composition of test diets and nutritional composition of wheat bran.
| Ingredient |
AIN-93G |
PWB |
GWB |
| g/100 g diet |
| Corn Starch |
39.7 |
33.3 |
33.3 |
| Milk Casein |
20.0 |
16.8 |
16.8 |
| Alpha-modified Corn Starch |
13.2 |
13.2 |
13.2 |
| Sucrose |
10.0 |
10.0 |
10.0 |
| Soybean Oil |
7.0 |
5.7 |
5.7 |
| Cellulose |
5.0 |
0.0 |
0.0 |
| Mineral Mix(AIN-93M-MX) |
3.5 |
3.5 |
3.5 |
| Vitamin Mix(AIN-93VX) |
1.0 |
1.0 |
1.0 |
| L-Cytine |
0.3 |
0.3 |
0.3 |
| Choline Bitartarate |
0.3 |
0.3 |
0.3 |
| t-Butylhydroquinone |
0.0014 |
0.0014 |
0.0014 |
| 53 µm Wheat bran |
0.0 |
16.0 |
0.0 |
| 350 µ Wheat bran |
0.0 |
0.0 |
16.0 |
| Total |
100.0 |
100.0 |
100.0 |
| Nutritional composition of wheat bran |
| g/100 g wheat bran |
| Fiber |
31.3 |
|
|
| Carbohydrate |
31.5 |
|
|
| Protein |
19.9 |
|
|
| Lipid |
7.6 |
|
|
| Ash |
4.6 |
|
|
| Water |
5.1 |
|
|
Mice Eight-week-old male Balb/c mice were purchased from CLEA Japan (Tokyo, Japan). Mice were housed individually in ventilated cages and had free access to water and food. The room in which mice were kept was maintained under the control condition of temperature (23 ± 2°C), humidity (50 ± 10%), and a 12-h light:dark cycle. All animal experiments conformed to the guidelines of the Animal Research Committee of the University of Shizuoka, and all efforts were made to minimize animal suffering. Experimental procedures were approved by the Animal Research Committee of the University of Shizuoka (Approval # 145060).
Experimental design Experimental design is shown in Fig. 1. After 1 week of acclimatization, mice were randomly divided into three groups: Control group (Cont, n=5), powdered wheat bran group (PWB, n=5), granulated wheat bran group (GWB, n=6, one more mouse was used than other groups because of the likelihood of dietary consumptive variations due to larger particles). Control group was given AIN-93G though the experimental period for 4 weeks. During this period, PWB and GWB groups were fed with AIN-93G in the first week, and were fed with the experimental diets in the second week to evaluate the effects of wheat bran intake. Then, the wheat bran-treated groups were fed with AIN-93G in the third week to confirm whether such effects are maintained or reverted to first week levels. Subsequently, the PWB and GWB groups were fed with experimental diets again in the final week to evaluate whether the re-intake in the fourth week is effective, as in the case of the second week. Dietary consumption and body weight of each mouse were measured daily during the experimental period. Feces of individual mice were collected immediately after defecation on the final day of each week (week 1 to week 4). Fresh feces were used for analysis of SCFA production. The remaining fecal samples in individual mice were frozen at −80°C for analysis of microbiota composition. After the experimental period, the ascending colon (2 cm) was obtained using dissection scissors and immediately (without freezing) used for analysis of gut-hormone mRNA expression. Cecal contents were collected and kept at −80°C for IgA assay.

DNA extraction from murine feces Fecal samples (50 mg) were dissolved in Buffer ATL (Qiagen, Hilden, Germany) and homogenized with 5-mm zirconia beads (TOMY Seiko, Tokyo, Japan) at 4,000 rpm for 5 s using a bead cell disrupter (TOMY Micro Smash MS-100, TOMY Seiko). Then, DNA was extracted using QIAamp Fast DNA Stool Mini Kit (Qiagen).
16S rDNA amplification Primers for 16S rDNA amplification were prepared based on sequences according to the Ion Xpress barcode adapters (Thermo Fisher Scientific) (Table 2). These primers include either of the two adaptor sequences at their 5′-end. The forward adaptors further link to unique Tag barcodes consisting of 10 bases to distinguish multiple samples. A partial 16S rDNA (V2 region) using specific primer pairs was amplified from fecal DNA. PCR conditions used were 5 min at 95°C, followed by 40 cycles of 30 s at 94°C, 30 s at 50°C, and 1 min at 68°C. Amplified V2 fragments of 16S rDNA were purified using the Wizard SV Gel and PCR Clean-Up System (Promega, Madison, Wisconsin, USA).
Table 2.
Primers used in this study.
| 16S rDNA primer |
|
Sequence (5′-3′) |
| Adaptor |
Barcode |
Target |
| V2 region barcode 1 |
Forward |
CCATCTCATCCCTGCGTGTCTCCGACTCAG |
TCCTCGAATCGAT |
AGYGGCGRACGGGTGAGTAA |
| V2 region barcode2 |
Forward |
CCATCTCATCCCTGCGTGTCTCCGACTCAG |
TAGGTGGTTCGAT |
AGYGGCGRACGGGTGAGTAA |
| V2 region barcode3 |
Forward |
CCATCTCATCCCTGCGTGTCTCCGACTCAG |
TCTAACGGACGAT |
AGYGGCGRACGGGTGAGTAA |
| V2 region barcode4 |
ForwardF |
CCATCTCATCCCTGCGTGTCTCCGACTCAG |
TTGGAGTGTCGAT |
AGYGGCGRACGGGTGAGTAA |
| V2 region barcode5 |
Forward |
CCATCTCATCCCTGCGTGTCTCCGACTCAG |
TCTAGAGGTCGAT |
AGYGGCGRACGGGTGAGTAA |
| V2 region barcode6 |
Forward |
CCATCTCATCCCTGCGTGTCTCCGACTCAG |
TCTGGATGACGAT |
AGYGGCGRACGGGTGAGTAA |
| V2 region barcode7 |
Forward |
CCATCTCATCCCTGCGTGTCTCCGACTCAG |
TCTATTCGTCGAT |
AGYGGCGRACGGGTGAGTAA |
| V2 region barcode8 |
Forward |
CCATCTCATCCCTGCGTGTCTCCGACTCAG |
AGGCAATTGCGAT |
AGYGGCGRACGGGTGAGTAA |
| V2 region barcode9 |
Forward |
CCATCTCATCCCTGCGTGTCTCCGACTCAG |
TTAGTCGGACGAT |
AGYGGCGRACGGGTGAGTAA |
| V2 region barcode10 |
Forward |
CCATCTCATCCCTGCGTGTCTCCGACTCAG |
CAGATCCATCGAT |
AGYGGCGRACGGGTGAGTAA |
| V2 region |
Reverse |
CCTCTCTATGGGCAGTCGGTGAT |
|
TGCTGCCTCCCGTAGGAGT |
| Gene |
|
Sequence (5′-3′) |
|
References |
| β-actin |
Forward |
TGACAGGATGCAGAAGGAGA |
|
Osawa et al. 2011 |
| Reverse |
GCTGGAAGGTGGACAGTGAG |
| PYY |
Forward |
TTCACAGACGACAGCGACA |
|
Bär et al. 2014 |
| Reverse |
CACCACTGGTCCAAACCTTC |
| GLP-1 |
Forward |
TTGCCTTTGTGATGGACGAA |
|
Salatore et al. 2015 |
| Reverse |
AGGAAGTGAAGGAGAGTTCTGTGAA |
Ion Torrent PGM sequencing Purified amplicons were adjusted to 26 pM by dilution with nuclease—free water. Emulsion PCR was performed to create amplicon libraries using Ion Chef 200 Template Kit v2 DL (Thermo Fisher Scientific) according to the manufacturer's instructions. Sequencing of the amplicon libraries was carried out on 314 chips using the Ion Torrent PGM system and Ion Sequencing 200 Kit (Thermo Fisher Scientific) in accordance with the supplier's protocol. After sequencing, data were directly uploaded from Ion Torrent Suite Software to Ion Reporter Software (Thermo Fisher Scientific). The uploaded data were filtered with the following conditions; read length filter: 150<; minimum alignment coverage: 90<; and read abundance filter: 10<. Genomic reads were aligned using two databases, Greengenes v13.5 (Lawrence Berkeley National Laboratory, Berkeley, CA, USA) and MicroSEQ 16S Reference Library v2013.1 (Thermo Fisher Scientific). The respective bacteria in the phylum or family were identified by such database searches and the ratios of phylum or family represent as a percentage.
GC/MS SCFAs (acetic acid, propionic acid and butyric acid) in feces were measured using an Agilent 6850 gas chromatograph with a 5975C mass spectrometric detector coupled to a 7697A head space sampler (Agilent Technologies, Santa Clara, CA, USA). Briefly, 50 mg of fresh feces was added to a vial (without extraction of SCFAs) and directly heated at 100°C for 60 min by the head space sampler. Next, 1 µL of gas phase from the heated feces in the vial was automatically injected into the DB-WAX column (Agilent Technologies). The flow rate of the carrier gas (He) was 1.1 mL/min, the injector temperature was 250°C. The initial oven temperature was 35°C for 5 min and then rose to 250°C/min. The identification of SCFAs was performed based on 2011 mass spectral library in the National Institute of Standards and Technology (Gaithersburg, MD, USA). Peak areas were integrated by the Agilent G1701EA MSD Productivity Chem Station (Agilent Technologies) and the concentration of SCFAs was calculated by comparing their peak areas with standards.
Real-time RT-PCR Total RNA was extracted from the murine ascending colon (2 cm) using NucleoSpin RNA II (Takara Bio, Otsu, Japan), and was converted into cDNA using PrimeScrip RT Master Mix (Takara Bio). Relative quantification was performed by real-time PCR using a SYBR Premix Ex Taq II (Takara Bio) and specific primers (shown in Table 2) with the Thermal Cycler Dice Real Time System (Takara Bio). The mRNA expression levels of targets were normalized using that of β-actin as an internal control. Amplification and melting curve data were collected and analyzed using Thermal Cycler Dice Real Time System Single Software ver. 5.00 (Takara Bio).
ELISA The sample solution of cecal content (25% [w/v]) was prepared with phosphate buffered saline (PBS) including protease inhibitors (complete protease inhibitor cocktail; Roche, Indiana, IN, USA), and was vortexed vigorously until cecal content was completely suspended. Then, the solution was centrifuged at 16,000 × g for 10 min at 4°C, and the supernatant was collected into fresh tubes and further centrifuged at 16,000 × g for 10 min at 4°C. The IgA concentration in the final supernatant was measured using Mouse IgA ELISA quantitation kit (Bethyl Laboratories, Montgomery, TX, USA). The ELISA plate was measured at 450 nm on a multi-mode microplate reader (Molecular Devices Japan, Tokyo, Japan).
Statistical analysis Statistical analysis was performed using IBM SPSS statistics ver. 20 software (IBM Corporation Armonk, NY, USA). Multiple comparisons were analyzed using one-way ANOVA, followed by Tukey's multiple comparison test or using Kruskal–Wallis test followed by Mann-Whitney's U test with Bonferroni post-hoc test. Differences were considered significant at p < 0.05. Data were expressed as means ± standard error (SEM).
Results
Dietary consumption and change rate in body weight Among mice in the Control, PWB and GWB groups, the dietary consumption and the change rate of body weight were not significantly different during the experimental period for 4 weeks (Fig. 2).

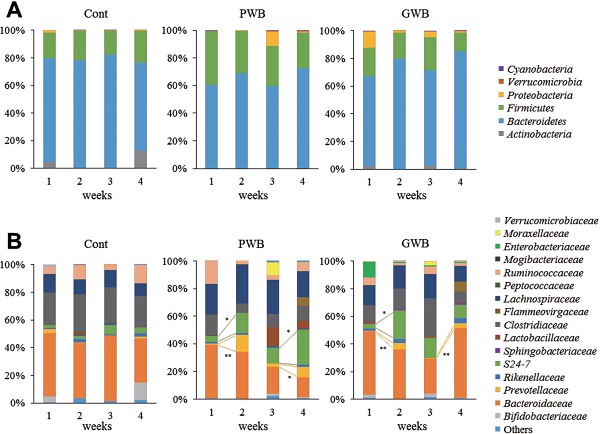
Effects of wheat bran intake on fecal microbiota composition To investigate the effects of short-term intake of wheat bran on intestinal microbiota, we analyzed the fecal microbiota from mice using next-generation sequencing based on 16S rDNA. In week 1 (prior to intake of the experimental diets), the phyla Firmicutes and Bacteroidetes accounted for a large proportion of the fecal microbiota in all murine groups. In week 2 (first period of the experimental diet intake), the ratio of Bacteroidetes increased in PWB and GWB groups when compared to week 1 (Fig. 3A). To confirm whether the microbiota composition in week 2 is maintained or reverts to that in week 1, the wheat bran-treated groups were fed again with the control diet in week 3. The ratios of Bacteroidetes in both the PWB and GWB groups in week 3 decreased to a similar degree as that in week 1. Subsequently, PWB and GWB groups were fed with the experimental diet in week 4 to investigate whether the ratios of Bacteroidetes increase again by re-intake. As expected, these ratios in the two wheat bran-treated groups rose in week 4. In particular, the ratios of the families Prevotellaceae and S24-7 in the phylum Bacteroidetes were increased in both PWB and GWB groups in week 2 and week 4 (Fig. 3B).
Effects of wheat bran intake on intestinal SCFAs production SCFAs are metabolite products of colonic fermentation by enteric bacteria. There are some reports on the positive correlations between SCFA production and ratio of Prevotellaceae in experiments with dietary fiber, such as non-starch polysaccharides (Ivarsson et al., 2014, Heinritz et al., 2016). Hence, three SCFAs (acetic acid, propionic acid, and butyric acid), were measured using GC/MS. Linear calibration curves of each SCFA (acetic acid and propionic acid, R2 = 0.99; butyric acid, R2 = 0.96) were obtained from the peak areas of SCFA standard solutions. Fecal contents of three SCFAs after week 2 and week 4 (the experimental diet periods) were higher than those after week 1 and week 3 (prior to the experimental diet period and an interval, respectively) in both the PWB and GWB groups (Table 3). Acetic acid concentration in the feces of both wheat bran-treated groups after week 2 and week 4 was high when compared to the control group. In week 2, particularly the concentration levels of acetic acid in both treated groups were significantly higher than that of the control group. The concentration of propionic acid in the PWB group was significantly higher than that in the GWB and control groups after week 2 and week 4. In butyric acid production, the concentration in the PWB group was significantly higher than that in the GWB and control groups after week 2 and week 4.
Table 3.
Effects of wheat bran on the production of SCFAs (µmol/g feces)
*.
| week 1 |
Cont |
PWB |
GWB |
| Acetic acid |
1.96 ± 0.60 |
4.65 ± 2.19 |
1.06 ± 0.33 |
| Propionic acid |
0.41 ± 0.11 |
0.49 ± 0.21 |
0.18 ± 0.03 |
| Butyric acid |
0.15 ± 0.08 |
0.31 ± 0.17 |
0.04 ± 0.01 |
| week 2 |
| Acetic acid |
0.61 ± 0.07 |
12.15 ± 0.52a |
7.30 ± 2.59b |
| Propionic acid |
0.14 ± 0.04 |
1.07 ± 0.18a |
0.49 ± 0.13c |
| Butyric acid |
0.34 ± 0.27 |
1.62 ± 0.59a |
0.25 ± 0.10c |
| week 3 |
| Acetic acid |
0.51 ± 0.18 |
2.91 ± 2.22 |
0.85 ± 0.39 |
| Propionic acid |
0.10 ± 0.03 |
0.17 ± 0.04 |
0.10 ± 0.02 |
| Butyric acid |
0.15 ± 0.08 |
0.23 ± 0.03 |
0.14 ± 0.04 |
| week 4 |
| Acetic acid |
0.67 ± 0.18 |
5.14 ± 1.51 |
4.25 ± 2.30 |
| Propionic acid |
0.18 ± 0.03 |
0.80 ± 0.15a |
0.35 ± 0.09c |
| Butyric acid |
0.07 ± 0.05 |
1.72 ± 0.57a |
0.24 ± 0.12c |
* As shown in
Fig. 1, all mice were fed with AIN-93G in week 1 and week 3. PWB and GWB groups were fed with experimental diets in week 2 and week 4. Data are indicated as means ± SEM. Statistical analysis was performed using the one-way ANOVA followed by Tukey's multiple comparison test (
p < 0.05). Values with different letters are significantly different (a, Cont
vs PWB; b, Cont vs GWB; c, PWB
vs GWB). Cont, Control group (n = 5); PWB, powdered wheat bran group (n = 5); GWB, granulated wheat bran group (n = 6).
Effects of wheat bran intake on colonic mRNA expression of SCFA-induced gut hormones It is known that SCFAs induce two gut hormones; GLP-1 and PYY (Lin et al., 2012). Accordingly, we next analyzed the mRNA expression of these two hormones in murine colonic tissue collected on the final day of week 4. GLP-1 mRNA expression tended to be upregulated by intake of wheat bran, regardless of the particle size (Fig. 4A), but no differences in PYY mRNA expression were seen among the three groups (Fig. 4B).
Effects of wheat bran intake on IgA secretion in the cecum To evaluate the effects of changes in intestinal microbiota due to wheat bran intake on IgA secretion, we examined IgA levels in cecal contents collected from mice on the final day of week 4. IgA concentrations in cecal contents of PWB and GWB groups were significantly higher and tended to be higher than in the control group, respectively (Fig. 5).
Discussion
High dietary fiber intake is reported to increase the phylum Bacteroidetes in the intestine of mammals such as mouse, pig and human (Miyazato et al., 2016; Magistrelli et al., 2016; Sheflin et al., 2016). Previous studies have shown that 8-week intake of whole-grain wheat increases the ratio of Bacteroidetes at the phylum level and Prevotella at the genus level in human (Vitaglione et al., 2015), and that SCFA production in mice is elevated by long-term intake (4 weeks) of whole wheat and wheat bran (Garcia-Mazcorro et al., 2016; Takahashi et al., 1999). In this study, the ratio of the phylum Bacteroidetes and SCFA production in murine feces were increased, even in the short term, by wheat bran intake. In Bacteroidetes, the ratios of the families Prevotellaceae and S24-7 were increased. It has been reported that the genus Prevotella in the family Prevotellaceae efficiently ferments non-starch polysaccharides (Ivarsson et al., 2014). Wheat bran contains high levels of non-starch polysaccharides such as hemicellulose, arabinoxylan and lignin. Therefore, the increase in Prevotellaceae ratio in this study might be due to such polysaccharides. Prevotellaceae is known to include SCFA-producing bacteria (Heinritz et al., 2016) and to have its own genetic capacity for production of SCFAs from polysaccharide through fermentation (Frese et al., 2015). Indeed, Paraprevotella clara and P. xylaniphila in the family Prevotellaceae, which have been isolated from human feces, are known to produce acetic acid (Morotomi et al., 2009). The family S24-7 in the phylum Bacteroidetes has not been well-characterized to date, and the ratio of these bacteria was reported to be decreased by high-fat feeding in mice (Evans et al., 2014).
It has been reported that several human diseases are associated with changes in intestinal microbiota. In particular, the ratios of Prevotellaceae, including the genus Prevotella, increased in hepatitis C infection (Aly et al., 2016), HIV infection (Ling et al., 2016), alcoholic cirrhosis (Engen et al., 2015), and non-alcoholic fatty liver disease (Michail et al., 2015), whereas the ratios decreased in rheumatoid arthritis (Sandhya et al., 2016), type 2 diabetes (Sato et al., 2014), and Parkinson's disease (Unger et al., 2016). In the case of Parkinson's disease, SCFA production and the ratio of Prevotellaceae have been reported to decrease in patient feces. Hence, the increase of Prevotellaceae associated with SCFA production, as in this study, may reduce the risk of diseases such as Parkinson's disease, although the relationship between increased Prevotellaceae and the risk of other diseases remains uncertain.
The concentrations of carbohydrate, protein and fat in experimental diets in this study matched those in the control diet, due to reductions in the amount of corn starch, milk casein and soybean oil, but wheat bran includes specific storage proteins such as prolamins and glutenin. It is unclear how much the experimental diet including the composite of such storage proteins (gluten) influenced the changes in intestinal microbiota, even on short-term intake, although other investigators reported that the low incidence of type 1 diabetes due to long-term intake with gluten-free diets in mice might be associated with changes in intestinal microbiota (Marietta et al., 2013).
Powdered wheat bran with a small size particle rather than a granulated preparation with a large size particle produced larger amounts of SCFAs, particularly butyric acid, in this study. It has been reported that the fermentability of wheat flour depends on milling conditions and its matrix (Jha et al., 2012). Therefore, powdered wheat bran rather than granulated wheat bran may be effectively fermented by SCFA-producing bacteria among murine intestinal microbiota.
In acetic acid production, concentration levels in the feces of the PWB and GWB groups were significantly higher than in the control group in week 2, but not in week 4. The reason for this discrepancy may be the increase in acetate absorption as an energy source in the colon in week 4 rather than in week 2. Indeed, it has been reported that intake of pectin, a dietary fiber, increases to absorb acetate through the up-regulation of expression of monocarboxylate transporter 1 (MCT1) in the rat colon (Kirat et al., 2009). MCT1 expression was also likely up-regulated by wheat bran intake in week 2 in this study. The up-regulated MCT1 levels in the colon maintained and enhanced the acetate absorption in week 4 to a greater degree than in week 2. Hence, the detectable quantity of acetic acid from murine feces in week 4 was lower than that in week 2.
Dietary fiber induces the production of gut hormones such as GLP-1 and PYY through FFAR2 (den Besten et al., 2015; Psichas et al., 2015; Tolhurst et al., 2012). Our study showed that the PWB and GWB groups tended to increase expression of GLP-1 mRNA regardless of particle size of wheat bran, as compared with the control group, whereas there were no differences in the expression of PYY mRNA among the groups. Similarly, the intake of gurgam induces the expression of only GLP-1 mRNA, but not PYY mRNA (den Besten et al., 2015). In contrast, the functional fiber PolyGlycoplex (α-D-glucurono-α-D-manno-β-D-manno-β-D-gluco, α-L-gulurono-β-D mannurono, β-D-gluco-β-, D-mannan, a natural polysaccharide complex supplied by InovoBiologic Inc.) increases PYY alone in the blood plasma (Reimer et al., 2010). The production of GLP-1 and PYY might depend on the types of dietary fiber, although the detailed mechanism of such different effects in the variation of dietary fiber is unclear. Because wheat bran intake is likely to show beneficial effects on the host glucose metabolism through upregulation of the GLP-1 mRNA expression in this study, further study is necessary to confirm the increase in GLP-1 at the protein level in the blood plasma.
Intake of wheat bran of both particle sizes raised the amount of IgA in cecum, particularly powdered wheat bran with smaller size particles. Butyric acid production also increased with powdered wheat bran intake as mentioned above; therefore, intake may induce IgA secretion through SCFA production. Indeed, butyric acid that was induced by resistant starch intake enhances the production and secretion of IgA (Miyazato et al., 2016). Furthermore, fructooligosaccharides increase fecal SCFAs (acetic acid and butyric acid) and IgA (Yamamoto et al., 2013). Hence, the production of SCFAs, particularly butyric acid, may be associated with IgA secretion in the intestine, although the detailed mechanism is unclear.
Specific intestinal bacteria directly induce IgA production (Kawamoto et al., 2014; Yanagibashi et al., 2013). For instance, Bacteroides spp. activate IgA production to develop IgA-producing precursor B cells in germ-free mice (Yanagibashi et al., 2013). Clostridium spp. lead to IgA production efficiently through the activation of forkhead box protein 3 (Foxp3)-positive T cells to maintain the diversity and balance of intestinal microbiota (Kawamoto et al., 2014). S24-7 is also known to strongly induce T cell-dependent immune response and promote IgA production (Bunker et al., 2015). Hence, the rise of S24-7 ratio may play a key role in IgA secretion.
Conclusion
This study demonstrated that wheat bran intake, even in the short term, altered fecal microbiota, induced SCFA production, and increased the amount of IgA in murine cecum. SCFAs in colon might be produced more efficiently by the intake of powdered wheat bran with small size particle, probably through fermentation by Prevotellaceae. Wheat bran intake might also reduce the risk of some diseases associated with decreases in Prevotellaceae in the intestine, although the risk of other diseases induced by increases in Prevotellaceae should be considered. Thus, the findings in this study may potentially explain many of the health benefits of altering the intestinal microbiota.
References
- Aly, A.M., Adel, A., El-Gendy, A.O., Essam, T.M., and Aziz, R.K. (2016). Gut microbiome alterations in patients with stage 4 hepatitis C. Gut Pathog., 8, 42.
- Arpaia, N., Campbell, C., Fan, X., Dikiy, S., van der Veeken, J., deRoos, P., Liu, H., Cross, J.R., Pfeffer, K., Coffer, P.J., and Rudensky, A.Y. (2013). Metabolites produced by commensal bacteria promote peripheral regulatory T-cell generation. Nature, 504, 451-455.
- Bär, F., Föh, B., Pagel, R., Schröder, T., Schlichting, H., Hirose, M., Lemcke, S., Klinger, A., König, P., Karsten, C.M., Büning, J., Lehnert, H., Fellermann, K., Ibrahim, S.M., and Sina, C. (2014). Carboxypeptidase E modulates intestinal immune homeostasis and protects against experimental colitis in mice. PLoS One, 9, e102347.
- Batterham, R.L., Cowley, M.A., Small, C.J., Herzog, H., Cohen, M.A., Dakin, C.L., Wren, A.M., Brynes, A.E., Low, M.J., Ghatei, M.A., Cone, R.D., and Bloom, S.R. (2002). Gut hormone PYY(3-36) physiologically inhibits food intake. Nature, 418, 650-654.
- Batterham, R.L., Cohen, M.A., Ellis, S.M., Le, Roux, C.W., Withers, D.J., Frost, G.S., Ghatei, M.A., and Bloom, S.R. (2003). Inhibition of food intake in obese subjects by peptide YY3-36. N. Engl. J. Med., 349, 941-948.
- Bunker, J.J., Flynn, T.M., Koval, J.C., Shaw, D.G., Meisel, M., McDonald, B.D., Ishizuka, I.E., Dent, A.L., Wilson, P.C., Jabri, B., Antonopoulos, D.A., and Bendelac, A. (2015). Innate and adaptive humoral responses coat distinct commensal cacteria with immunoglobulin A. Immunity. 43, 541-553.
- Cummings, J.H. and Bingham, S.A. (1987). Dietary fibre, fermentation and large bowel cancer. Cancer Surv., 6, 601-621.
- den Besten, G., Gerding, A., van Dijk, T.H., Ciapaite, J., Bleeker, A., van Eunen, K., Havinga, R., Groen, A.K., Reijngoud, D.J., and Bakker, B.M. (2015). Protection against the metabolic syndrome by guar gum-derived short-chain fatty acids depends on peroxisome proliferator-activated receptor γ and glucagon-like peptide-1. PLoS One, 10, e0136364.
- Dziedzic, K., Szwengiel, A., Górecka, D., Gujska, E., Kaczkowska, J., Drożdżyńska, A., and Walkowiak, J. (2016). Effect of wheat dietary fiber particle size during digestion in vitro on bile acid, faecal bacteria and short-chain fatty acid content. Plant Foods Hum. Nutr. 71, 151-157.
- Engen, P.A., Green, S.J., Voigt, R.M., Forsyth, C.B., and Keshavarzian, A. (2015). The Gastrointestinal Microbiome: Alcohol Effects on the Composition of Intestinal Microbiota. Alcohol Res., 37, 223-236.
- Evans, C.C., LePard, K. J., Kwak, J.W., Stancukas, M.C., Laskowski, S., Dougherty, J., Moulton, L., Glawe, A., Wang, Y., Leone, V., Antonopoulos, D.A., Smith, D., Chang, E.B., and Ciancio, M.J. (2014). Exercise prevents weight gain and alters the gut microbiota in a mouse model of high fat diet-induced obesity. PLoS One. 9, e92193.
- Farilla, L., Bulotta, A., Hirshberg, B., Li Calzi, S., Khoury, N., Noushmehr, H., Bertolotto, C., Di Mario, U., Harlan, D.M., and Perfetti, R. (2003). Glucagon-like peptide 1 inhibits cell apoptosis and improves glucose responsiveness of freshly isolated human islets. Endocrinology, 144, 5149-5158.
- Feng, Y., van der Veeken, J., Shugay, M., Putintseva, E.V., Osmanbeyoglu, H.U., Dikiy, S., Hoyos, B.E., Moltedo, B., Hemmers, S., Treuting, P., Leslie, C.S., Chudakov, D.M., and Rudensky, A.Y. (2015). A mechanism for expansion of regulatory T-cell repertoire and its role in self-tolerance. Nature, 528, 132-136.
- Frese, S.A., Parker, K., Calvert, C.C., and Mills, D.A. (2015). Diet shapes the gut microbiome of pigs during nursing and weaning. Microbiome, 3, 28.
- Fukuda, S., Toh, H., Hase, K., Oshima, K., Nakanishi, Y., Yoshimura, K., Tobe, T., Clarke, J.M., Topping, D.L., Suzuki, T., Taylor, T.D., Itoh, K., Kikuchi, J., Morita, H., Hattori, M., and Ohno, H. (2011). Bifidobacteria can protect from enteropathogenic infection through production of acetate. Nature, 469, 543-547.
- Garcia-Mazcorro, J.F., Ivanov, I., Mills, D.A., and Noratto, G. (2016). Influence of whole-wheat consumption on fecal microbial community structure of obese diabetic mice. PeerJ. 4, e1702.
- Gibson, G.R., Beatty, E.R., Wang, X., and Cummings, J.H. (1995). Selective stimulation of bifidobacteria in the human colon by oligofructose and inulin. Gastroenterology. 108, 975-982.
- Heinritz, S.N., Weiss, E., Eklund, M., Aumiller, T., Louis, S., Rings, A., Messner, S., Camarinha-Silva, A. Seifert, J., Bischoff, S.C., and Mosenthin, R. (2016). Intestinal microbiota and microbial metabolites are changed in a pig model fed a high-fat/low-fiber or a low-fat/high-fiber diet. PLoS One, 11, e0154329.
- Ivarsson, E., Roos, S., Liu, H.Y., and Lindberg, J.E. (2014). Fermentable non-starch polysaccharides increase the abundance of Bacteroides-Prevotella-Porphyromonas in ileal microbial community of growing pigs. Animal., 8, 1777-1787.
- Jha, R., Owusu-Asiedu, A., Simmins, P.H., Pharazyn, A., and Zijlstra, R.T. (2012). Degradation and fermentation characteristics of wheat coproducts from flour milling in the pig intestine studied in vitro. J. Anim. Sci., 4, 173-175.
- Kawamoto, S., Maruya, M., Kato, L.M., Suda, W., Atarashi, K., Doi, Y., Tsutsui, Y., Qin, H., Honda, K., Okada, T., Hattori, M., and Fagarasan, S. (2014). Foxp3(+) T cells regulate immunoglobulin a selection and facilitate diversification of bacterial species responsible for immune homeostasis. Immunity. 41, 152-165.
- Kirat, D., Kondo, K., Shimada, R., and Kato, S. (2009). Dietary pectin upregulates monocaboxylate transporter 1 in the rat gastrointestinal tract. Exp Physiol. 94, 422-433.
- Kontula, P., Jaskari, J., Nollet, L., De Smet, I., von Wright, A., Poutanen, K., and Mattila-Sandholm, T.(1998). The colonization of a simulator of the human intestinal microbial ecosystem by a probiotic strain fed on a fermented oat bran product: effects on the gastrointestinal microbiota. Appl. Microbiol. Biotechnol., 50, 246-252.
- Lin, H.V., Frassetto, A., Kowalik, E.J. Jr., Nawrocki, A.R., Lu, M.M., Kosinski, J.R., Hubert, J.A., Szeto, D., Yao, X., Forrest, G., and Marsh, D.J. (2012). Butyrate and propionate protect against diet-induced obesity and regulate gut hormones via free fatty acid receptor 3-independent mechanisms. PLoS One, 7, e35240.
- Ling, Z., Jin, C., Xie, T., Cheng, Y., Li, L., and Wu, N. (2016). Alterations in the Fecal Microbiota of Patients with HIV-1 Infection: An Observational Study in A Chinese Population. Sci. Rep., 6, 30673.
- Marietta, E.V., Gomez, A.M., Yeoman, C., Tilahun, A.Y., Clark, C.R., Luckey, D.H., Murray, J.A., White, B.A., Kudva, Y.C., and Rajagopalan, G. (2013). Low incidence of spontaneous type 1 diabetes in non-obese diabetic mice raised on gluten-free diets is associated with changes in the intestinal microbiome. PLoS One, 8, e78687.
- Michail, S., Lin, M., Frey, M.R., Fanter, R., Paliy, O., Hilbush, B., and Reo, N.V. (2015). Altered gut microbial energy and metabolism in children with non-alcoholic fatty liver disease. FEMS Microbiol. Ecol., 91, 1-9.
- Morotomi, M., Nagai, F., Sakon, H., and Tanaka, R. (2009). Paraprevotella clara gen. nov., sp. nov., and Paraprevotella xylaniphila sp. nov., members of the family ‘Prevotellaceae’ isolated from human faeces. Int. J. Syst. Evol. Microbiol., 59, 1895-1900.
- Numan. A.M. and Rabah, T.H. (2015). The effect of dietary wheat bran on sucrose-induced changes of serum glucose and lipids in rats. Nutr. Hosp. 32, 1636-1644.
- Macpherson, A.J., Hunziker, L., McCoy, K., and Lamarre, A. (2001). IgA responses in the intestinal mucosa against pathogenic and non-pathogenic microorganisms. Microbes Infect., 3, 1021-1035.
- Macpherson, A.J., McCoy, K.D., Johansen, F.E., and Brandtzaeg, P. (2008). The immune geography of IgA induction and function. Mucosal Immunol., 1, 11-22.
- Magistrelli, D., Zanchi, R., Malagutti, L., Galassi, G., Canzi, E., and Rosi F. (2016). Effects of cocoa husk feeding on the composition of swine intestinal microbiota. J. Agric. Food Chem. 64, 2046-2052.
- Miyazato, S., Kishimoto, Y., Takahashi, K., Kaminogawa, S., and Hosono, A. (2016). Continuous intake of resistant maltodextrin enhanced intestinal immune response through changes in the intestinal environment in mice. Biosci. Microbiota, Food Health, 35, 1-7
- Osawa, T., Tsuchida, R., Muramatsu, M., Yuasa, Y., and Shibuya, M. (2011). Human glioblastoma cells exposed to long-term hypoxia and nutrient starvation stimulated induction of secondary T-cell leukemia in mice. Blood Cancer J. 1, e6.
- Ou, J.Y., Huang, J.Q., Song, Y., Yao, S.W., Peng, X.C., Wang, M.F., and Ou, S.Y. (2016). Feruloylated oligosaccharides from maize bran modulated the gut microbiota in rats. Plant Foods Hum. Nutr., 71, 123-128.
- Psichas, A., Sleeth, M.L., Murphy, K.G., Brooks, L., Bewick, G.A., Hanyaloglu, A.C., Ghatei, M.A., Bloom, S.R., and Frost, G. (2015). The short chain fatty acid propionate stimulates GLP-1 and PYY secretion via free fatty acid receptor 2 in rodents. Int. J. Obes., 39, 424-429.
- Reimer, R.A., Pelletier, X., Carabin, I.G., Lyon, M., Gahler, R., Parnell, J.A., and Wood, S. (2010). Increased plasma PYY levels following supplementation with the functional fiber PolyGlycopleX in healthy adults. Eur. J. Clin. Nutr., 64, 1186-1191.
- Reisinger, M., Tirpanalan, O., Prückler, M., Huber, F., Kneifel W., and Novalin, S. (2013). Wheat bran biorefinery-a detailed investigation on hydrothermal and enzymatic treatment. Bioresour. Technol. 144, 179-185.
- Salvatore, P., Mascali, L.G., Urbano, F., Filippello, A., Malaguarnera, R., Calanna, S., Rabuazzo, A.M., and Purrello, F. (2014). Chronic exposure to GLP-1 increases GLP-1 synthesis and release in a pancreatic alpha cell line (α-TC1): evidence of a direct effect of GLP-1 on pancreatic alpha cells. PLoS One, 9, e90093.
- Sandhya, P., Danda, D., Sharma, D., and Scaria, V. (2016). Does the buck stop with the bugs?: an overview of microbial dysbiosis in rheumatoid arthritis. Int. J. Rheum. Dis., 19, 8-20.
- Sato, J., Kanazawa, A., Ikeda, F., Yoshihara, T., Goto, H., Abe, H., Komiya, K., Kawaguchi, M., Shimizu, T., Ogihara, T., Tamura, Y., Sakurai, Y., Yamamoto, R., Mita, T., Fujitani, Y., Fukuda, H., Nomoto, K., Takahashi, T., Asahara, T., Hirose, T., Nagata, S., Yamashiro, Y., Watada, H. (2014). Gut dysbiosis and detection of “live gut bacteria” in blood of Japanese patients with type 2 diabetes. Diabetes Care, 37, 2343-2350.
- Sheflin, A.M., Borresen, E.C., Kirkwood, J.S., Boot, C.M., Whitney, A.K., Lu, S., Brown, R.J., Broeckling, C.D., Ryan, E.P., and Weir, T.L. (2016). Dietary supplementation with rice bran or navy bean alters gut bacterial metabolism in colorectal cancer survivors. Mol. Nutr. Food. Res., 10.002/mnfr.201500905.
- Stewart, M.L. and Slavin, J.L. (2009). Particle size and fraction of wheat bran influence short-chain fatty acid production in vitro. Br. J. Nutr. 102, 1404-1407.
- Takahashi, T., Satou, M., Watanabe, N., Sakaitani, Y., Takagi, A., Uchida, K., Ikeda, M., Moriyama, R., Matsumoto, K., and Morotomi, M. (1999). Inhibitory effect of microfibril wheat bran on azoxymethane-induced colon carcinogenesis in CF1 mice. Cancer Lett., 141, 139-146.
- Tolhurst, G., Heffron, H., Lam, Y.S., Parker, H.E., Habib, A.M., Diakogiannaki, E., Cameron, J., Grosse, J., Reimann, F., and Gribble, F.M. (2012). Short-chain fatty acids stimulate glucagon-like peptide-1 secretion via the G-protein-coupled receptor FFAR2. Diabetes, 61, 364-371.
- Unger, M.M., Spiegel, J., Dillmann, K.U., Grundmann, D., Philippeit, H., Bürmann, J., Faßbender, K., Schwiertz, A., and Schäfer, K.H. (2016). Short chain fatty acids and gut microbiota differ between patients with Parkinson's disease and age-matched controls. Parkinsonism Relat. Disord. 32, 66-72.
- Vitaglione, P., Mennella, I., Ferracane, R., Rivellese, A.A., Giacco, R., Ercolini, D., Gibbons, S.M., La Storia, A., Gilbert, J. A., Jonnalagadda, S., Thielecke, F., Gallo, M.A., Scalfi, L., and Fogliano, V. (2015). Whole-grain wheat consumption reduces inflammation in a randomized controlled trial on overweight and obese subjects with unhealthy dietary and lifestyle behaviors: role of polyphenols bound to cereal dietary fiber. Am. J. Clin. Nutr. 101, 251-261.
- Yanagibashi, T, Hosono, A, Oyama, A, Tsuda, M, Suzuki, A, Hachimura, S, Takahashi, Y, Momose, Y., Itoh, K., Hirayama, K., Takahashi, K., and Kaminogawa, S. (2013). IgA production in the large intestine is modulated by a different mechanism than in the small intestine: Bacteroides acidifaciens promotes IgA production in the large intestine by inducing germinal center formation and increasing the number of IgA+ B cells. Immunobiology, 218, 645-651.
- Yamamoto, Y., Takahahi, T., To, M., Nakagawa, Y., Hayashi, T., Shimizu, T., Kamata, Y., Saruta, J., and Tsukinoki, K. (2016). The salivary IgA flow rate is increased by high concentrations of short-chain fatty acids in the cecum of rats ingesting fructooligosaccharides. Nutrients, 8, 500; 10.390/nu8080500
- Zhao, X. and Dong, C. (2016). Extracting xylooligosaccharides in wheat bran by screening and cellulase assisted enzymatic hydrolysis. Int. J. Biol. Macromol. 92, 748-752.

