Original papers
Effects of Extrusion on Physicochemical Properties of Oat Polysaccharides and Its Improvement in Flour Dough Extensibility and Gumminess
2018 年 24 巻 1 号 p. 145-150
詳細
2018 年 24 巻 1 号 p. 145-150
This work evaluated the influence of extrusion on the physicochemical properties of oat polysaccharides and its improvement in flour dough quality. Solubility, solvent retention capacity, and water binding capacity of extruded oat bran polysaccharides (EOPs) were effectively improved when compared to normal oat bran polysaccharides (NOPS), whereas the gelation temperature markedly decreased. The EOP solution revealed strong viscoelasticity. Moreover, the extensibility and gumminess of EOP-added dough were significantly improved when compared to blank dough. Therefore, EOPs are highly potential for use as new functional ingredients in food.
The effect of dietary fiber on the maintenance and improvement of human health has attracted considerable scientific interest in recent decades (Koh et al., 2016). Oat polysaccharide is a valuable functional dietary fiber that has a number of industrial, nutritional, and health benefits (Borneo et al., 2012; Ekström et al., 2017). Moreover, oat polysaccharides may be used as a thickening agent in food technology because they form viscous solutions and high viscosity gels at low concentrations (de Souza et al., 2015; Wood, 2007). These benefits have led to the development of high-fiber food containing oat polysaccharides (Brennan et al., 2007). Nevertheless, the applications of oat polysaccharides are still limited due to their poor processing adaptability (Izydorczyk et al., 2005; Yao et al., 2011). Thus, knowledge about the effects of food processing technology on the physicochemical properties of oat polysaccharides must be improved.
Extrusion is a type of food processing technology that involves material crushing, mixing, heating, sterilizing, and enzyme inactivation (Ti et al., 2015). Various popular products, such as snack foods and breakfast cereals, are manufactured via extrusion (Brennan et al., 2013). Extrusion of cereal-based products has several advantages over other common processing methods, which include low costs, rapid production speeds, high productivity, versatility, unique product shapes, and enhanced energy savings (Kumar et al., 2016).
Dough, a complex blend of water, cereal flour, and other ingredients, passes through various operational units before flour products are produced (Blake et al., 2015). The rheological behavior of dough is a major determinant of its performance during mechanical handling and governs the overall baking process (Ahmed et al., 2015). The characteristics of flour, such as how much water it absorbs to achieve optimum dough consistency and the resulting stability of dough during mixing, are important measures of its quality (Girard et al., 2016). The present study aimed to investigate the influence of extrusion on the physicochemical and functional properties of oat (Avena nuda L.) polysaccharides, as well as evaluate the improvement in quality of extruded oat polysaccharide (EOP)-added dough.
Preparation of oat polysaccharides Oat bran was extruded with a DS56-X co-rotating, self-wiping twin-screw extruder (Jinan Saixin Machinery Co., Jinan, China), and a length/diameter ratio of 25 at 157°C, 10% water addition, and 10 rpm screw speed. Then the polysaccharides from extruded oat brans were extracted according to Zhang et al. (2009) with slight modification. In brief, 30 g of untreated or extruded oat brans was extracted with 120 mL of 75% (v/v) ethanol and then refluxed at 80°C for 10 min to inactivate endogenous β-glucanase and remove pigments. Subsequently, the residues of oat bran were dried in air and extracted twice with distilled water at 60°C for 1.5 h. The mixture was centrifuged at 3000 ×g for 15 min. All supernatants were combined and hydrolyzed with α-amylase (25,000 U/mL) at 90°C for 15 min and β-amylase (100,000 U/g) at 60°C and pH 4.5 for 10 min to remove starch. The supernatants were centrifuged at 4000 ×g for 15 min and then concentrated to 10% of the original volume under vacuum pressure. The pH of the solutions was adjusted to 4.5, and the samples were left to stand at 4°C for 4 h to remove protein. Subsequently, the samples were centrifuged at 4000 ×g for 15 min and precipitated by adding four times their volume of 95% (v/v) ethanol at 4°C overnight. The mixture was filtered and vacuum freeze-dried. All samples were prepared in triplicate for each extraction.
Thermal properties of oat polysaccharides The thermal properties of the polysaccharides were analyzed using a differential scanning calorimeter (DSC; DSC-60plus, Shimadzu, Japan). The prepared samples were weighed, and 2 mg was placed in an aluminum pan with distilled water [0%, 50%, and 75% (w/w)]. The pans were then hermetically sealed. After 24 h of equilibration at room temperature, the samples were heated at a rate of 10°C/min over 30°C–250°C using an empty reference pan. The following gelatinization temperature parameters were calculated: onset temperature (To), peak temperature (Tp), ending temperature (Te), and enthalpy of gelatinization (ΔHgel).
Microrheological measurements Microrheological measurements were performed with a Rheolaser Lab Diffusing Wave Spectroscopy instrument (Formulaction, France). This microrheology analyzer uses the multi-speckle diffusing wave spectroscopy principle of measurement, which measures the particles' Brownian motion depending on the viscoelastic structure of samples. This technique sends a coherent laser beam into samples, leading to interfering waves that create a speckle pattern captured with a video camera detector. The variations in this speckle image are directly linked to the particles' Brownian motion, speed, and explored distance. Microrheology enables the measurement of the evolution of viscosity and elasticity. Such measurements were performed at rest, and no mechanical stress was applied to the samples. NOP and EOP were dissolved in deionized water at the desired concentrations (1%, 3%, and 5%). The dispersion was then placed into a measuring bottle to ensure that no air bubbles formed. The samples were heated from 20°C to 80°C.
Solvent retention capacity (SRC) SRC, defined as the weight of the solvent held by the NOP and EOP, was measured using the AACC (1999) method. The results were expressed as milliliter per gram of dry oat polysaccharide powder. Four solvents (water, 1% sucrose, 1% sodium chloride, and 1% lactate acid) were each used to determine four SRC values.
Solubility The sample solution was prepared by independently dispersing NOP and EOP in distilled water to obtain a saturated solution. The evaporating dish was weighed after drying to ensure a constant weight. The 1 mL samples obtained from the pre-weighed evaporating dishes were determined by heating in a hot air oven at 105°C to obtain a constant weight. The solubility of each sample was expressed as the weight of the polysaccharide in 100 mL of saturated solution.
Rheology of wheat flour dough DoughLAB (Perten, Sweden) is a flexible dough rheometer with conventional z-arm mixing action and automated water addition. It determines flour water absorption (WA), dough development time, and other dough mixing parameters. High-speed mixing rheology of flour using doughLAB followed the AACC International Method 54-70. After NOP and EOP (0, 0.5%, 1.0%, 1.5%, and 2.0%) were added to wheat flour, the samples were mixed in a mixing bowl to determine the rheology of wheat flour dough.
Tensile properties and texture profile analysis (TPA) Dough was prepared with added amounts of NOP and EOP. The dough was then proofed for 2 h at 25°C. The tensile properties were measured using a texture analyzer (Model TA-XT2 Texture Analysis, Stable Micro Systems, England) equipped with an A/KIE probe. For tensile measurements, the dough was cut into strips.
A P/36R probe was used to determine the texture of the dough. The conditions of the texture analyzer were as follows: pre-test speed, 2.0 mm/s; test speed, 1.0 mm/s; post-test speed, 1.0 mm/s; distance, 10.0 mm; and trigger force, 10 g. For TPA measurements, the dough was molded into a cylinder (12 mm × 25 mm).
Thermal properties of dough To investigate the influence of oat polysaccharides on the dough, the thermal properties of the dough were determined by DSC (DSC-60plus, Shimadzu, Japan). Exactly 8 mg of the dough was weighed in an aluminum pan, which was then hermetically sealed. The experimental conditions adopted were the same as those in the measurement of oat polysaccharides.
Statistical analysis The results are expressed as mean ± standard deviation (SD). The significance of treatment effects was analyzed using Duncan's multiple range tests after SPSS one-way ANOVA (SPSS PASW Statistic 19.0, SPSS Inc. Chicago, IL, USA). P < 0.05 was considered significant.
Thermal properties DSC plays an important role in studying the thermodynamic properties of the gelation of polysaccharides. Gelation of β-glucan involves the formation of a network structure through interchain segment association and aggregated junction zones (Lazaridou et al., 2007). Endothermic peaks during gel/sol transition from DSC measurements indicate the melting of structural domains.
The thermal properties of NOP and EOP were investigated and compared to determine their differences. With the increase in water content, the peak temperature of both NOP and EOP decreased. In particular, EOP had a lower peak temperature (Tp = 164.69°C ± 1.96°C) than NOP (Tp = 181.80°C ± 1.85°C; Table 1), probably because EOP had lower stability than NOP. The long polysaccharide chain and large molecular weight of EOP demonstrated a greater amplitude of thermal motion, which led to the collapse of the configuration.
| Item | β-glucans % | Protein % | Moisture content % | Onset Temperature To/°C | Peak Temperature Tp /°C | Ending Temperature Te /°C | Enthalpy ΔH J/g |
|---|---|---|---|---|---|---|---|
| NOP | 0 | 180.49 ± 1.69a | 181.80 ± 1.85a | 185.61 ± 1.24a | 60.23 ± 2.05a | ||
| 81.35 | 1.66 | 50 | 145.49 ± 2.99b | 152.90 ± 2.83b | 162.97 ± 2.72b | 593.46 ± 72.14b | |
| 75 | 126.38 ± 1.67c | 141.45 ± 3.38c | 152.58 ± 2.10c | 802.79 ± 8.58c | |||
| EOP | 0 | 162.98 ± 2.45d | 164.69 ± 1.96d | 167.85 ± 2.23b | 67.58 ± 5.70a | ||
| 82.11 | 1.40 | 50 | 124.85 ± 3.69c | 140.36 ± 6.22c | 151.83 ± 7.63c | 621.19 ± 37.30b | |
| 75 | 115.19 ± 10.18e | 124.31 ± 12.32e | 134.91 ± 11.40d | 1053.92 ± 91.89d |
Microrheological results The macroscopic viscosity index (Fig. 1a) corresponds to the inverse of the slope of the mean square distance (MSD) in a linear scale. The MSD profiles of the oat polysaccharide solution increased linearly with time, which indicated that the solution had no viscoelasticity (Xu et al., 2007). Accordingly, all oat polysaccharide solutions were viscoelastic. The MSD curves initially moved from a shorter to a longer displacement, which meant that viscosity increased. However, this change also suggested an increase in the elasticity when the curves first moved from a longer to a shorter displacement (Tisserand et al., 2012).
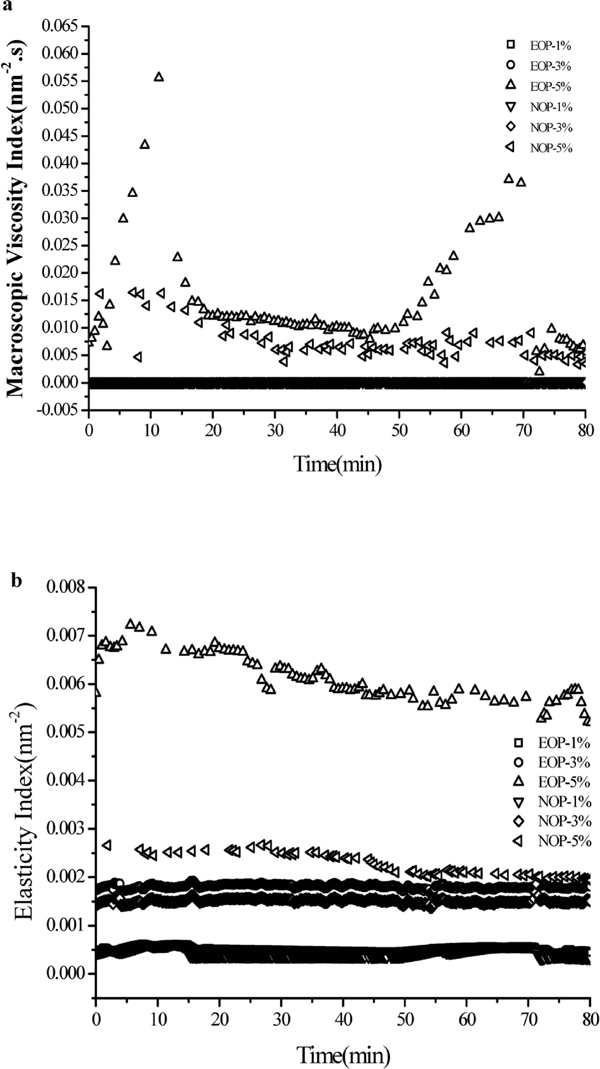
Macroscopic viscosity and elasticity index of oat polysaccharide. (a) Macroscopic viscosity index of oat polysaccharides; (b) Elasticity Index of oat polysaccharide solution
SRC and solubility of oat polysaccharides The SRC results of NOP and EOP indicated that oat polysaccharides presented different SRCs in several solvents. The SRC for distilled water, sodium chloride, sucrose, and lactic acid varied from 2.73 mL/g to 3.65 mL/g, 3.17 mL/g to 4.16 mL/g, 2.39 mL/g to 3.57 mL/g, and 1.77 mL/g to 3.36 mL/g, respectively. In general, the quality of food production was maintained. Therefore, NOP and EOP could be used as stabilizers and anti-syneresis ingredients in jams, jellies, marmalades, and cereal foods (Ahmad et al., 2010).
The solubility of oat polysaccharide is important because it influences its application in food production. The results suggested that EOP had better dissolving ability than NOP (Table 2). According to our previous investigation, β-1,3/β-1,4 improved after extrusion (Zhang et al., 2009). Lazaridou et al. (2003) also reported that structural features play an important role in solubility.
| Samples | Solvent Retention Capacity (mL/g) | Solubility (g/100mL) | |||
|---|---|---|---|---|---|
| Distilled water | 1.0%NaCI solution | 1.0% sucrose solution | 1.0% lactic acid solution | ||
| NOP | 2.73 ± 0.12a | 3.17 ± 0.07a | 2.39 ± 0.06a | 1.77 ± 0.04a | 2.00 ± 0.11a |
| EOP | 3.65 ± 0.05b | 4.17 ± 0.15b | 3.57 ± 0.09b | 3.36 ± 0.11b | 2.57 ± 0.06b |
Farinographic and thermal properties of wheat flour dough Table 3 shows that the farinographic properties of NOP- and EOP-added wheat flour dough were determine. Increasing the substitution level of wheat flour by NOP or EOP increased the WA capabilities of the composite flours to achieve a dough consistency of 500 BU. Fiber binds high amounts of water, which increases WA (Rieder et al., 2012). The development and stability times decreased with increasing amounts of NOP and EOP, thereby confirming the findings of a previous study (Cavallero et al., 2002). However, these results were in contrast to those reported by Skendi et al (2010). This disparity is probably related to the difference in the molecular weight, SRC, solubility, and concentration range of polysaccharides. A short flour mixing time would benefit the commercial process, and the characteristics of composite flours could save energy in industrial production. Softening significantly increased with the addition of oat polysaccharides. Although DT and ST decreased, the extensibility and texture profile of the dough was not influenced, as shown in Table 3.
| Properties | Blank | NOP | EOP | ||||
|---|---|---|---|---|---|---|---|
| 0.5% | 1.0% | 2.0% | 0.5% | 1.0% | 2.0% | ||
| Farinographic properties | |||||||
| Water Absorption% | 64.7 ± 0.4a | 65.7 ± 0.1b | 66.0 ± 0.3b | 66.7 ± 0.4c | 65.5 ± 0.1b | 66.0 ± 0.2b | 66.9 ± 0.5c |
| Development Time (min) | 3.8 ± 0.2a | 3.7 ± 0.1a | 3.0 ± 0.1bc | 2.6 ± 0.9be | 3.5 ± 0.2ac | 3.0 ± 0.1bc | 2.2 ± 0.1de |
| Stability (min) | 7.9 ± 0.7a | 4.9 ± 0.3b | 4.7 ± 0.2b | 3.8 ± 0.6ce | 4.5 ± 0.2be | 4.1 ± 0.1be | 3.8 ± 0.9de |
| Softening (BU) | 88.7 ± 2.8a | 137.2 ± 6.2b | 152.7 ± 3.1b | 198.0 ± 24.5ce | 147.7 ± 5.6be | 180.3 ± 4.6be | 199.1 ± 39.8de |
| Tensile properties | |||||||
| Max Tensile force/g | 48.05 ± 1.73a | 50.34 ± 1.04a | 54.04 ± 1.75b | 56.14 ± 1.64b | 49.20 ± 1.79a | 54.46 ± 2.53b | 60.04 ± 0.92c |
| Stretching distance /mm | 19.88 ± 1.87a | 23.87 ± 6.63ad | 27.64 ± 9.46ac | 31.73 ± 1.79bcd | 25.11 ± 4.00ade | 26.25 ± 2.72ad | 33.18 ± 2.45bce |
| Textural properties | |||||||
| Springiness | 0.28 ± 0.01a | 0.29 ± 0.04a | 0.29 ± 0.01a | 0.29 ± 0.01a | 0.30 ± 0.01a | 0.29 ± 0.01a | 0.30 ± 0.01a |
| Firmness | 0.93 ± 0.08a | 0.79 ± 0.03bc | 0.76 ± 0.08bc | 0.71 ± 0.03bc | 0.82 ± 0.02ac | 0.75 ± 0.01bc | 0.72 ± 0.02bc |
| Cohesiveness | 0.29 ± 0.02a | 0.29 ± 0.01a | 0.26 ± 0.04a | 0.27 ± 0.04a | 0.26 ± 0.02a | 0.24 ± 0.03a | 0.25 ± 0.01a |
| Resilience | 0.05 ± 0.002a | 0.04 ± 0.002a | 0.04 ± 0.004a | 0.05 ± 0.001a | 0.04 ± 0.004a | 0.04 ± 0.002a | 0.04 ± 0.001a |
| Gumminess | 0.27 ± 0.01a | 0.29 ± 0.01ac | 0.31 ± 0.01be | 0.34 ± 0.01d | 0.28 ± 0.01a | 0.30 ± 0.01bc | 0.32 ± 0.01e |
| Chewiness | 0.076 ± 0.002a | 0.077 ± 0.001a | 0.078 ± 0.008a | 0.081 ± 0.007a | 0.078 ± 0.001a | 0.080 ± 0.005a | 0.082 ± 0.005a |
| Thermal properties | |||||||
| Melting temperature (°C) | 171.43 ± 0.46a | 183.02 ± 0.11b | 181.16 ± 0.57bf | 177.87 ± 1.59cg | 183.15 ± 0.99b | 179.96 ± 0.45dfg | 176.15 ± 0.49eg |
Oat polysaccharides significantly influenced the thermodynamic properties of the dough. The addition of oat polysaccharides above 0.5% resulted in a progressive decrease in the melting temperature. Moreover, the melting temperature of NOP- or EOP-added dough was higher than that of blank dough. Gluten likely combined with oat polysaccharides to form a relatively stable mesh structure.
Dough extensibility and TPA The extensibility of oat polysaccharide-incorporated dough is presented in Table 3. The maximum tensile force of oat polysaccharide-incorporated dough was significantly higher than that of blank dough (48.05 g). Furthermore, the stretching distance became longer with the increase in oat polysaccharides. The extensibility of 2% EOP-added dough was best among all the samples. The extensibility of the composite dough increased gradually with increasing levels of oat polysaccharides, which could be due to the interaction of polysaccharides with wheat in the gluten network.
According to the results of textural analysis (Table 3), the addition of NOP and EOP (0.5%, 1.0%, and 2.0%) did not significantly influence the springiness, cohesiveness, resilience, and chewiness of the dough. However, the gumminess of the dough significantly improved. Furthermore, the firmness of the dough decreased with increasing amounts of NOP and EOP.
The extensibility of individual or composite wheat flour has become one of the most important quality assessment tools for cereal-based products because of its perceived relevance to baking performance and the various correlations that have been inferred and assumed (Ahmed et al., 2015). Our results indicated that oat polysaccharides could change the extensibility and texture profile of the dough.
In summary, extrusion exerted a positive effect on polysaccharide yield and influenced the physicochemical properties of normal oat polysaccharides. The solubility and water binding capacity of EOPs significantly improved, whereas the gelation temperature decreased. Moreover, EOPs improved the processing adaptability of the dough, which indicates their important role in the high-fiber food industry.
Acknowledgements Financial support from the Special Fund for Agroscientific Research in the Public Interest (201303071), Innovation of modern Agricultural Project (F17RO2), Foundation (SPZX005) of Engineering Research Center of Food Biotechnology, Ministry of Education, and Foundation (XNC002) of Tianjin University of Science and Technology, Institute for New Rural Development, Tianjin, China, is gratefully acknowledged.