Abstract
Apigenin is a bioactive ingredient found in many vegetables and herbs, especially parsley (Petroselinum crispum L.). It was successfully extracted at high yields from parsley leaves using supercritical carbon dioxide (SCCO2) without co-solvent. A strong correlation was especially apparent at high SCCO2 density. The amount of extracted apigenin was well correlated with the difference in solubility parameters between the solvent (SCCO2) and the solute (apigenin). A lower energy requirement for extraction resulted in a greater amount of extracted apigenin. Various pre-treatments of parsley leaves (particle size, drying method and hot-water soaking of the samples) were examined to maximize the amount of extracted apigenin. Soaking in hot-water and then freeze-drying of parsley leaves was an optimal pre-treatment to realize the maximum amount of extracted apigenin.
Introduction
The physiological functions and health benefits of herbs and their constituents have attracted attention in food science and plant harvest research. For example, polyphenols have a wide range of physiological effects and can be extracted from a broad variety of plants (Wong et al., 2016; Mandalari et al., 2016). Apigenin is a bioactive ingredient found in many vegetables and herbs, especially parsley (Petroselinum crispum L.). Parsley is widely cultivated and employed as a culinary herb for garnishing and seasoning (Sozzi and Vicente, 2004). The major components of parsley are flavones, flavonols and essential oils. The flavones apigenin, myricetin, apiin and luteolin are contained in parsley (Justesen and Knuthsen, 2001). Apigenin and apiin are reported to exhibit anti-inflammatory (Tago et al., 2011) and anti-cancer properties in human health (Siddique et al., 2007; Shukla and Gupta, 2010). Apiin is a glycoside of apigenin. According to the Log P scale, apigenin is more hydrophobic than apiin; the Log P value reported for apigenin is 2.01 i), compared to 0.72 ii) for apiin. This difference is attributable to the hydrophilic glycoside chain contained in the molecular structure of apiin. Log P is commonly used as an indicator of hydrophobicity, and was first introduced by Laane et al. (1987).
Supercritical carbon dioxide (SCCO2) was proposed as an alternative solvent to hydrocarbon compounds. It is considered to be a green solvent owing to its non-toxicity to humans, and is also non-flammable and inexpensive (Leitner, 2002). In pioneering work performed in the food industry, caffeine (Lentz et al., 1986) was successfully extracted by SCCO2 to produce non-caffeinated beverages. Previous investigations on the extraction of bioactive components using SCCO2 have indicated an increasing trend in its application. For example, β-carotene was extracted from Aloe barbadensis using SCCO2 in the temperature range 313 – 333 K and the pressure range 10 – 40 MPa. The largest amount of β-carotene was obtained from the leaf skin of A. barbadensis at 333 K and 29 MPa (Bashipour and Ghoreishi, 2012). Three types of phenolic content (caffeine, catechin, and epicatechin) were extracted from guaraná (Paullinia cupana) seed by SCCO2 with ethanol, methanol or a 1:1 mixture (ethanol: methanol; v/v) as co-solvent. The largest total phenolic content was obtained at 313 K and 30 MPa with the ethanol and methanol mixture; the total phenolic content was 105.76 mg-equivalent pyrogallol·(g-seeds)−1 (Marques et al., 2016). Artepillin C was extracted from Baccharis dracunculifolia using SCCO2 at 323 K and 30 MPa for 120 min. The amount of extracted artepillin C was 4.65 ± 0.71 mg·(g-leaves)−1 (Julia et al., 2017). However, extraction of apigenin from parsley using SCCO2 has not yet been investigated.
Pre-treatment of bioresource samples is key to increasing the extraction yield of bioactive components. This is an essential process because of the very small amounts of bioactive components contained within the cellular structures of plants and seeds, or the internal organs of animals. Rapid gas decomposition (Gaspar et al., 2001), mechanical shear stress (Ivanovic et al., 2013), ultrasound irradiation (Vidović et al., 2014) and microwave radiation (Carla et al., 2016) have been employed as pre-treatment techniques to enhance the extraction yield from bioresources. All of these methods are based on physical disruption of the plant body.
The present study investigated the extraction of apigenin from parsley leaves using SCCO2. The correlation between the amount of extracted apigenin and the energy required for extraction was examined based on the solubility parameters of SCCO2 and apigenin. Further, pre-treatment of parsley leaves, particle size and soaking of the samples in hot-water were examined to maximize the amount of extracted apigenin.
Materials and Methods
Materials The parsley (P. crispum L.) employed in this study was harvested in Chiba prefecture, Japan. The stalks were removed, and the leaves were used as the bioresource sample for apigenin extraction. Apigenin (97%) was purchased from Sigma-Aldrich Co., LLC (MO, USA) and used to prepare a calibration curve. Safranin was purchased from Wako Pure Chemical Industries, Ltd (Osaka, Japan) and used as a pigment to investigate the cellular structure of parsley by optical microscopy. Paraffin wax II60 (melting point 330 to 333 K) was used in the preparation of microscope slides using a plastic mold (Tissue-Tec; 2 cm × 3 cm). Sample sections for microscopic measurement were prepared using a microtome TTM-200 apparatus (Sakura Finetek Japan Co., Ltd., Tokyo, Japan).
Preparation of parsley samples Raw parsley leaves were dried under hot-air at 343 K for 4 h and then crushed using a mill mixer (FM-50-Y; Sun Co., Ltd., Osaka, Japan). The size distribution of the dried parsley particles was measured using laser diffraction scattering (SALD-300V; Shimadzu Co., Kyoto, Japan). Distilled water was used as a solvent to disperse the parsley powder for the measurement. The optical data were analyzed using SALD-300V-WJA1 ver. 1.20 software (Shimadzu Co.,), and the size distribution of the parsley powder was determined. Powdered parsley with particle sizes ranging from 150 to 250 µm was mainly employed for SCCO2 extraction.
SCCO2 extraction of apigenin The experimental apparatus used for SCCO2 extraction of apigenin is shown in Fig. 1. The extraction vessel was made from stainless steel SUS316 (Taiatu Techno Co., Ltd., Tokyo, Japan). Details of the extraction vessel dimensions are presented in Fig. 2. The inner diameter of the extraction vessel was 0.7 cm and the axial length was 7 cm. The vacant volume of the extraction vessel was 2.7 cm3. Extraction was performed as follows: carbon dioxide was fed from a bomb and was chilled to 277 K to change it to the liquid state.

Fig. 1.
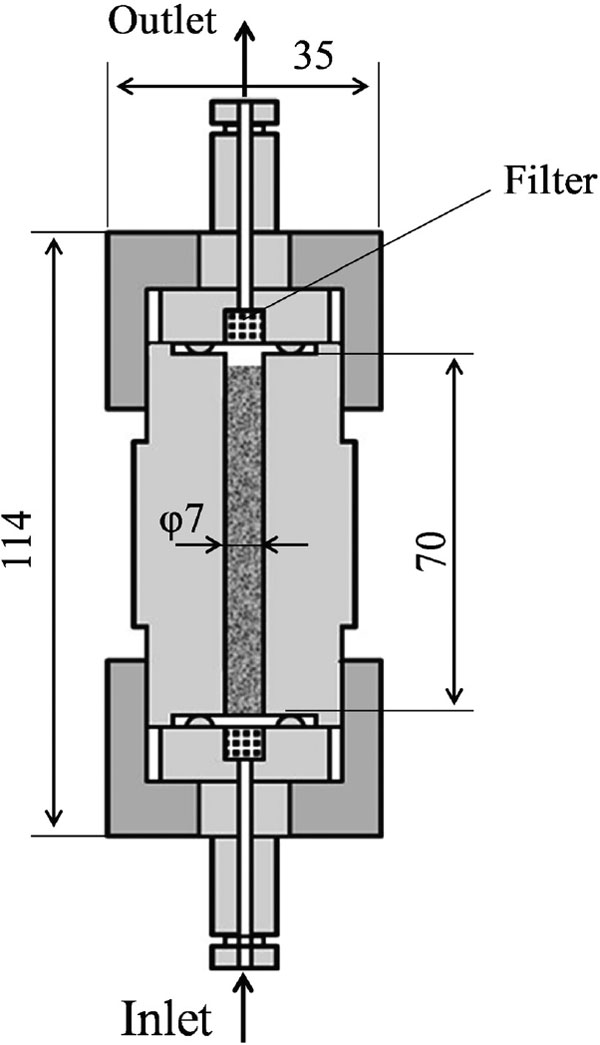
Fig. 2.
The critical temperature (Tc) and critical pressure (Pc) of carbon dioxide are 304.1 K and 7.3 MPa, respectively. The carbon dioxide was preliminarily pressurized to the desired level by a back pressure valve. When valve-1 was opened, the carbon dioxide was introduced into the extraction vessel. The extraction vessel was immersed in a thermo-controlled water bath to attain the desired temperature (303 – 323 K). The pressure in the extraction vessel was checked using a monitoring gauge. When the pressure attained the desired level, valve-1 was closed and the extraction was initiated. The extraction period in this work (batch mode) was set to 30 min based on the results of our preliminary experiments.
At the end of the extraction, valve-2 was opened and the carbon dioxide containing the extracted apigenin was injected into an ethanol trap. The amount of extracted apigenin in ethanol was measured using high performance liquid chromatography (HPLC). Extraction was repeatedly carried out in at least triplicate. The experimental data are expressed as arithmetic mean values. The error bars in the figures represent standard deviation. The variance was consistently in the range of 10% throughout the study. The volume of carbon dioxide in the extraction vessel was evaluated from the volume of carbon dioxide purged, which was determined by a volumetric flow meter (Wet Gas Meter Model: W-NK; Shinagawa Co., Ltd., Tokyo, Japan). Calculation of the molar quantity of carbon dioxide was based on the temperature and atmospheric pressure measured on the day.
Quantitative analysis of apigenin The amount of extracted apigenin was measured using HPLC in conjunction with a manual sample injector (Model 7725 Rheodyne; JASCO Co., Ltd., Tokyo, Japan) and an intelligent UV/VIS detector UV-970 (JASCO Co., Ltd.). The output from the HPLC system was automatically analyzed by ChromNAV (ver. 1.12A2) software (JASCO Co., Ltd.). A calibration curve used to determine apigenin concentration was constructed using pure apigenin (97%) and apiin (95%). The wavelength of the detector was set at 269 nm (apigenin) or 267 nm (apiin). The HPLC column was a COSMOSIL Cholester (4.6 mm i.d. × 250 mm length) from Nacalai Tesque, Inc. (Kyoto, Japan). The column was packed with silica gel C-18 as the hydrophobic stationary phase. The column oven was operated at 313 K.
The mobile phase was composed of two different solutions (A and B). Solution A was composed of distilled water (Wako Pure Chemical Industries, Ltd.) and phosphate buffer (pH 2.5, 0.1 M; Nacalai Tesque, Inc.) (4:1, v/v). Solution B was acetonitrile (99.5%) (Wako Pure Chemical Industries, Ltd.). Solutions A and B were mixed at a ratio of 2:3 (v/v) and employed to measure the extracted apigenin. To measure apiin, solutions A and B were mixed at a ratio of 4:1 (v/v). The flow rate of the mixed mobile phase was 1 mL min−1 and regulated using an intelligent HPLC pump PU-980 (JASCO Co. Ltd.).
Optical microscopy The parsley leaves were dehydrated stepwise using various concentrations of ethanol (50 to 100%) and then paraffin embedded using a plastic mold. The embedded sample was set on a microtome stage and then sliced into thin (5 µm) sections. The paraffin in the sample sections was removed by soaking in hot xylene at 343 K for 30 min. The sample sections were then soaked in 1 wt% safranin aqueous solution for 10 min at room temperature. The dyed sample sections were washed with ethanol. The micro-structure of the dyed parsley leaves was examined using an optical microscope (BX51; Olympus Co., Tokyo, Japan).
Scanning electron microscopy A TM-1000 scanning electron microscope (SEM; Hitachi Ltd., Tokyo, Japan) was employed to examine the cellular structure of dried parsley leaves prepared by vacuum freeze-drying at 198 K and 3.5 Pa for 24 h.
Results and Discussion
Amount of extracted apigenin Fig. 3 shows chromatograms for apigenin (A) and apiin (B) measured by HPLC. In the chromatograms, pure apigenin and apiin are shown as solid blue lines, while the extracted apigenin and apiin from parsley leaves using SCCO2 (313 K, 20 MPa) are shown as solid red lines. The peaks were identified as 1. ethanol, 2. apigenin, 3. unknown, and 4. apiin. Apiin was not detected following SCCO2 extraction. It appeared to be negligibly small. Therefore, apigenin extraction was the main focus of this work.

Fig. 3.
In this paper, the amount of extracted apigenin was indicated as mol of apigenin extracted per unit gram of dried parsley leaves and unit mol of SCCO2, as expressed by Eq. (1).
This depicts the extraction capacity of unit mol of SCCO2 to the number of mol of apigenin without co-solvent under the unit mass of dried natural resources (parsley leaves).
Effect of particle size Fig. 4 shows the effect of particle size of the dried parsley powder on the amount of apigenin extracted with SCCO2 at 313 K and 15 MPa. The amount extracted increased dramatically with decreasing particle size up to 200 µm, after which little change was observed. The change was particularly steep between 200 and 385 µm.

Fig. 4.
The specific surface area of a sample is theoretically proportional to the reciprocal of the particle size. The dependence of the amount extracted on particle size did not obey the theoretical trend. It was extremely large in the size range of 200 to 385 µm. This range corresponds with the cross-sectional thickness of the parsley leaves, as shown in Fig. 5 (1). The cross-sectional cellular structure of parsley leaves was particularly degraded in this range; therefore, the amount of apigenin extracted from parsley leaves was strongly enhanced. Fig. 5 (2) shows a SEM image of the detailed structure of raw parsley leaves following vacuum freeze-drying at 198 K and 3.5 Pa for 24 h.

Fig. 5.
Effect of pressure and temperature Fig. 6 shows the effect of pressure on the amount of apigenin extracted from hot-air dried samples. The temperature of SCCO2 ranged from 303 to 323 K. The amount of extracted apigenin increased with increasing pressure. The amount of extracted apigenin at 313 K and 10 MPa was 2.20 × 10⁻⁸ mol-apigenin·(g-dried sample)−1·(mol-SCCO2)−1, which was 9.4 fold higher than that of raw parsley. In comparison, the amount extracted from raw parsley was 2.33 × 10⁻⁹ mol-apigenin·(g-dried sample)−1·(mol-SCCO2)−1 at SCCO2 conditions of 313 K and 10 MPa. In a previous examination, a similar trend of amount extracted in relation to SCCO2 pressure was reported. The amount of extracted phenol was increased with increasing SCCO2 pressure (Feng and Meier, 2015).

Fig. 6.
In contrast, the condition of 303 K and 10 MPa was a subcritical temperature. This was recognized as supercritical quasi-condition. The amount of extracted apigenin in this condition deviated from the general trend in supercritical conditions. Specifically, it was larger than that of supercritical conditions.
Fig. 7 presents the effect of temperature on the amount of apigenin extracted from hot-air dried samples at a SCCO2 pressure range from 10 to 20 MPa. The amount of extracted apigenin in SCCO2 decreased with increasing temperature. The amounts of extracted lycopene and β-carotene exhibited a similar trend with temperature (Machmudah et al., 2012). The amount extracted under a supercritical quasi-condition (303 K, 10 MPa) was apparently larger compared to the extrapolated value of supercritical conditions. The efficacy of the supercritical quasi-condition will be examined in a future investigation.

Fig. 7.
Effect of SCCO2 density Pressure and temperature were the main factors regulating the density of SCCO2. The mass-based density (ρ) of SCCO2 was calculated according to Bender's formula (Eq. 2) (Bender, 1970).
The correlation between the amount of extracted apigenin and SCCO2 molar-based density (ρSCF) is presented in Fig. 8. The amount of extracted apigenin increased with increasing SCCO2 density. A strong correlation was especially noted at high SCCO2 density; the higher the SCCO2 density, the greater the extraction capacity. A previous report noted a remarkable correlation between the high density of SCCO2 and the solubility of all-trans retinoic acid in SCCO2 (Rosa et al., 2015).

Fig. 8.
Correlation between the amount of extracted apigenin and the solubility parameter of SCCO2 The solubility parameter depends on the molar-based density of SCCO2, according to Giddings' study presented in Eq. (3) (Giddings et al., 1968).
In general, the solubility parameter indicates the hydrophilic-hydrophobic properties of a solvent. The difference in solubility parameters between a solvent and solute (ρSCCO2 − δA) was reported as a dominant factor in determining solubility (Barton, 1975). A small difference in the solubility parameters of a solvent (δSCCO2) and the target component (δA) results in high solubility. This is because these conditions lead to a minimization of the energy required for solubilization, as calculated using Eq. 4.
Solubility parameters of apigenin and apiin were calculated by the group contribution method (Fedors, 1974) using Eq. (5). The molecular structure of apigenin and apiin was divided into individual chemical groups, as presented in Table 1. The result showed that the solubility parameter of apigenin was 31.9 (J·cm−3)0.5, and that for apiin was estimated to be 32.3 (J·cm−3)0.5. This data is summarized in Table 2. Solubility parameters were calculated based on 298 K.
Table 2.
| Component |
T [K] |
P [MPa] |
δ[J·cm−3)0.5]
Calculated value according to Giddings et al. (1968) |
|
303 (30°C) |
8 |
13.6 |
|
308 (35°C) |
10 |
12.5 |
|
|
12 |
13.5 |
|
|
15 |
14.3 |
|
|
20 |
14.3 |
|
313 (40°C) |
10 |
11.0 |
|
|
12 |
12.6 |
| CO2 |
|
14 |
13.4 |
|
|
15 |
13.7 |
|
|
20 |
14.7 |
|
318 (45°C) |
10 |
8.77 |
|
|
12 |
11.5 |
|
|
15 |
13.0 |
|
|
20 |
15.2 |
|
323 (50°C) |
10 |
6.88 |
|
Calculated value according to group contribution method (Fedors, 1974) |
Calculated value according to regular solution (Hildebrand et al., 1970) |
| Apigenin |
31.9 |
22.0 ± 0.6 |
| Apiin |
32.3 |
20.9± 0.4 |
The calculated solubility parameter of apigenin was lower than that of apiin. This indicates that apigenin is more hydrophobic than apiin. This difference is attributable to the absence of a glycoside chain in the molecular structure of apigenin.
Fig. 9 shows the correlation between the amount of extracted apigenin and the square of the difference in solubility parameters between SCCO2 and apigenin. In this paper, δSCCO2 was individually employed at a supercritical condition. The δA was conveniently employed at 298 K constant.

Fig. 9.
As a reference, the calculated energy required for extraction (ΔE) is indicated in the right hand side ordinate of Fig. 9. When the difference in solubility parameters was small, this resulted in a lower energy requirement for extraction. Thus, a larger amount of extracted apigenin was realized. The amount of extracted apigenin increased logarithmically with decreasing energy required for extraction.
As another approach, the solubility parameters of apigenin and apiin were estimated according to hypothetical thermodynamic Eq. (6), which is based on the theory of regular solutions (Hildebrand et al., 1970).
Here, the enthalpy of vaporization at 298 K of apigenin i) and apiin ii) were 83.8 ± 3.0 and 143.6 ± 3.0 KJ·mol−1, respectively, and the molar volumes at 298 K of apigenin i) and apiin ii) were 174.6 ± 3.0 and 322.9 ± 3.0 cm3·mol−1, respectively. As a result, the solubility parameter of apigenin was 22.0 ± 0.6 (J·cm−3)0.5, and that for apiin was estimated to be 20.9 ± 0.4 (J·cm−3)0.5. These are also summarized in Table 2.
Based on this theory, the larger solubility parameter of apigenin indicated that it is more hydrophilic than apiin. This is in contrast to the result obtained by Fedors' method. The estimation of solubility parameter has been a controversial subject, especially for natural bio-products. In this study, the authors concurred with Fedors' method.
Effective pre-treatment to maximize extracted apigenin. In the industrial extraction of functional food components, the use of effective pre-treatments to maximize apigenin extraction is vital. As a pre-treatment, raw parsley was soaked in hot-water at 353 K for 10 min, and then the boiled parsley was frozen. Subsequently, the parsley was dried in a vacuum freeze-dryer at 198 K and 3.5 Pa for 24 h. The powdered parsley 150 to 250 µm in particle size was employed for SCCO2 extraction.
Fig. 10 shows a comparison of pre-treatments on the amount of extracted apigenin. The data were obtained under conditions of 313 K and 10 MPa in SCCO2. The amount extracted following combination pre-treatment was 1.03 × 10⁻⁷ mol-apigenin·(g-dried sample)−1·(mol-SCCO2)−1, which was 45-fold higher than direct extraction from raw parsley leaves. The yield attained was 40% of that extracted using methanol; the amount extracted using methanol (333 K, 30 min) was 2.63 × 10⁻⁷ mol-apigenin·(g-dried sample)−1·(mol-SCCO2)−1. The pre-treatment combination of hot-water soaking and then vacuum freeze-drying achieved the maximum amount extracted apigenin from parsley leaves using SCCO2 without co-solvent.

Fig. 10.
Fig. 11 (1) shows an optical microscopic image of the cross-sectional cellular structure of parsley leaves after soaking in hot-water (353 K, 10 min) and then vacuum freeze-drying. The pre-treated cellular structure was entirely degraded, and large cavities appeared throughout the parsley leaves.

Fig. 11.
Fig. 11 (2) presents the detailed structure of parsley leaves after pre-treatment with hot-water soaking and vacuum freeze-drying. The cellular structure of the parsley leaves was fully degraded by the combination pre-treatment. This enabled apigenin to be easily released from parsley leaves. The amount of extracted apigenin was maximized by complete degradation of the cellular structure of the parsley leaves.
Conclusion
The amount of extracted apigenin from parsley leaves using SCCO2 was explained in terms of the difference in the solubility parameters of SCCO2 and apigenin. Moreover, the amount extracted was maximized following use of an effective pre-treatment. The amount of extracted apigenin increased remarkably with decreasing particle size of the parsley leaves. Notably, it was not linearly proportional to the specific area of the parsley powder. The highest amount extracted was obtained at a parsley powder size of 200 µm. This corresponded well with the cross-sectional thickness of the parsley leaves. The amount of extracted apigenin increased with increasing pressure, but decreased with increasing temperature. The density of SCCO2 strongly affected the amount of extracted apigenin. The amount of extracted apigenin correlated well with differences in the solubility parameters between SCCO2 and apigenin. When the parsley leaves were soaked in hot-water (353 K) for 10 min and then vacuum freeze-dried, the amount of extracted apigenin was 1.03 × 10⁻⁷ mol-apigenin·(g-dried sample)−1·(mol-SCCO2)−1, which is 45 fold higher than direct extraction from raw parsley. This represent an optimal pre-treatment to realize the maximum amount of apigenin extracted from parsley leaves using SCCO2. Optical microscopy and SEM images confirmed that the parsley tissue was degraded and large cavities formed in the cellular structure of the leaves. The complete degradation of the cellular structure of parsley leaves was demonstrated to be a very important factor in SCCO2 extraction.
Acknowledgement The authors sincerely thank Dr. Kei Tao of Nihon University for providing technical assistance with SEM imaging.
Nomenclature
dm
Mean size of sample [µm], presented in Fig. 4. This is arithmetic mean of upper limit size and lower limit size of sample in size classification [µm].
Ex
Amount of extracted apigenin from parsley leaves [mol-apigenin·(g-dried sample)−1·(mol-SCCO2)−1]
fSCCO2
Volumetric fraction of solvent in Eq. (4) [-]
n1–
n20
Constants in Bender's equation [-]
Log P
Hydrophobic scale of solvent proposed by Laane et al. (1987). [-]
Log P of apigenin was quoted from the internet site i), Log P of apiin was quoted from the internet site ii).
P
Pressure [MPa]
Pc
Critical pressure of CO2 [MPa]
R
Gas constant for carbon dioxide used in Bender's Eq., 0.188 [kJ·K−1·(kg-SCCO2)−1]
Rt
Retention time [min]
T
Temperature [K]
Tc
Critical temperature of CO2 [K]
Ti
ith power of temperature used in Bender's Eq. [Ki]
V
Molar volume of atom or group [cm3·mol−1]
VA
Molar volume of target component in Eq. (6) [cm3·mol−1]
δA
Solubility parameter of target component [(J·cm−3)0.5]
δSCCO2
Solubility parameter of SCCO2 [(J·cm−3)0.5]
ρ
Mass-based density of SCCO2 in Bender's Eq. [g-SCCO2·m−3]
ρSCF
Molar-based density of SCCO2 recalculated mass-based density [mol-SCCO2·m−3] This was applied in Giddings' Eq.
ρliq
Molar-based density of CO2 at boiling point [mol-SCCO2·m−3]
This was applied in Giddings' Eq.
φ
Inner diameter of extraction vessel [mm]
Δ
E
Required energy for extraction [J·mol−1]
Δ
EV
Energy of vaporization in Fedors' method [J·mol−1]
Δ
H
Enthalpy of vaporization of target components [J·mol−1]
ΣΔ
EV
Sum of energy of vaporization of each atom group in Fedors' Eq. [J·mol−1]
Σ
V
Sum of molar volume of atom or group in Fedors' Eq. [cm3·mol−1]
Abbreviations
HPLC
High performance liquid chromatography
SCCO
2
Supercritical carbon dioxide
SEM
Scanning electron microscope
References
- Barton, A.F.M. (1975). Solubility parameters. Chem. Rev., 75, 731-753.
- Bashipour, F. and Ghoreishi, S.M. (2012). Experimental optimization of supercritical extraction of β-carotene from Aloe barbadensis Miller via genetic algorithm. J. Supercrit. Fluids, 72, 312-319.
- Bender, E. (1970). Equations of state exactly representing the phase behavior of pure substances. Symposium on Thermophys. Prop., New York. pp. 227-235.
- Carla, D.P., Deborha, D., and Andrea, N. (2016). Microwave pretreatment of Moringa oleifera seed: Effect on oil obtained by pilot-scale supercritical carbon dioxide extraction and soxhlet apparatus. J. Supercrit. Fluids, 107, 38-43.
- Fedors, R.F. (1974). A method for estimating both the solubility parameters and molar volume of liquids. Polym. Eng. Sci., 14, 147-154.
- Feng, Y. and Meier, D. (2015). Extraction of value-added chemicals from pyrolysis liquids with supercritical carbon dioxide. J. Anal. Appl. Pyrol., 113, 174-185.
- Gaspar, F., Santos, R., and King, M.B. (2001). Disruption of glandular trichomes with compressed CO2: alternative matrix pre-treatment for CO2 extraction of essential oils. J. Supercrit. Fluids, 21, 11-22.
- Giddings, J.C., Myers, M.N., Mclaren, L., and Keller, R.A. (1968). High-pressure gas chromatography of nonvolatile species. Science, 162, 67-73.
- Hildebrand, J.H., Prausnitz, J.M., and Scott, R.L. (1970). Themodynamic relations. In “Regular and Related Solutions: the Solubility of Gases, Liquids, and Solids.” E-Publishing Van Nostrand Reinhold Co., New York, pp.9-27.
- Ivanovic, J., Meyer, F., Misic, D., Asanin, J., Jaeger, P., Zizovic, I., and Eggers, R. (2013). Influence of different pre-treatment methods on isolation of extracts with strong antibacterial activity from lichen Usnea barbata using carbon dioxide as a solvent. J. Supercrit. Fluids, 76, 1-9.
- Julia, T.P., Ilza, M.O.S., Mary, A.F., and Fernando, A.C. (2017). Selective fractionation of supercritical extracts from leaves of Baccharis dracunculifolia. J. Supercrit. Fluids, 127, 62-70.
- Justesen, U., and Knuthsen, P. (2001). Composition of flavonoids in fresh herbs and calculation of flavonoid intake by use of herbs in traditional Danish dishes. Food Chem., 73, 245-250.
- Laane, C., Boeren, S., Vos, K., and Veeger, C. (1987). Rules for optimization of biocatalysis in organic solvents. Biotechnol. Bioeng., 30, 81-87.
- Leitner, W. (2002). Supercritical carbon dioxide as a green reaction medium for catalysis. Acc. Chem. Res., 35, 746-756.
- Lentz, H., Gehrig, M., and Schulmeyer, J. (1986). Dynamic solubility measurements of caffeine in carbon dioxide and in carbon dioxide saturates with water. Physica B + C, 139–140, 70-72.
- Machmudah, S., Winardi, S., Sasaki, M., Goto, M., Kusumoto, N., and Hayakawa, K. (2012). Lycopene extraction from tomato peel by-product containing tomato seed using supercritical carbon dioxide. J. Food Eng., 108, 290-296.
- Mandalari, G., Vardakou, M., Faulks, R., Bisignano, C., Martorana, M., Smeriglio, A., and Trombetta, D. (2016). Food matrix effects of polyphenol bioaccessibility from almond skin during simulated human digestion. Nutrients, 8, 568-585.
- Marques, L.L.M., Panizzon, G.P., Aguiar, B.A.A., Simionato, A.S., Cardozo-Filho, L., Andrade, G., de Oliveira, A.G., Guedes, T.A., and Mello, J.C.P.D. (2016). Guaraná (Paullinia cupana) seeds: Selective supercritical extraction of phenolic compounds. Food Chem., 212, 703-711.
- Rosa, B.S.A., Marceneiro, S., Braga, E.M.M., and Dias, M.A.A, de Sousa, C.H. (2015). Solubility of all-trans retinoic acid in supercritical carbon dioxide. J. Supercrit. Fluids, 98, 70-78.
- Sozzi, G.O. and Vicente, A.R. (2004). Capers and caperberries. In “Handbook of Herbs and Spices 2nd,” ed. by Peter, K.V. E-Publishing Inc, England, pp. 230-256.
- Shukla, S. and Gupta, S. (2010). Apigenin and cancer chemoprevention, In “Bioactive Foods in Promoting Health Fruits and Vegetables,” ed. by Ronald, R.W. Victor, R. E-Publishing Elsevier Inc., United Kingdom, pp. 663-689.
- Siddique, Y.H., Beg, T., and Afzal, T. (2007). Antigenotoxic effect of apigenin against anti-cancerous drugs. Toxicol. in Vitro, 22, 625-631.
- Tago, M., Nakamura, K., Tago, K., Mashino, T., and Kasahara, T. (2011). Anti-inflammatory activity of structurally related flavonoids, apigenin, luteolin and fisetin. Int. Immunopharmacol., 11, 1150-1159.
- Vidović, S., Zeković, Z., Marošanović, B., Todorović, M.P., and Vladić, J. (2014). Influence of pre-treatments on yield, chemical composition and antioxidant activity of Satureja montana extracts obtained by supercritical carbon dioxide. J. Supercrit. Fluids, 95, 468-473.
- Wong, X., Carrasco-Pozo, C., Escobar, E., Navarrete, P., Blachier, F., Andriamihaja, M., Lan, A., Tomé, D., Cires, J.M., and Pastene, E. (2016). Deleterious effect of p-resol on human colonic epithelial cells prevented by proanthocyanidin-containing polyphenol extracts from fruits and proanthocyanidin bacterial metabolites. J. Agric. Food Chem., 64, 3574-3583.
- i) http://www.chemspider.com/Chemical-Structure.4444100.html?rid=5de1add3-dd8c-4fb2-b626-bc259177b9a. (April. 14, 2014).
- ii) http://www.chemspider.com/Chemical-Structure.4444321. html?rid=641b9a73-7b06-4f7e-93b2-45096658cbee (April. 14, 2014).


;%0A%09%09%09newWindow.document.open();%0A%09%09%09newWindow.document.write('<img src=%22./Graphics/24_63_12.jpg%22>');%0A%09%09%09newWindow.document.close();%0A%09%09)
