Abstract
Wheat starch biosynthesis is influenced by the Wx gene, which may also affect the quality and characteristics of flour and food. In this study, eight near-isogenic Wx wheat lines were bred and used as test materials for analysis of the content and biosynthesis dynamics of starch, and the changes in flour and dry noodle qualities were evaluated. The results showed that the contents and accumulation rates of amylose, amylopectin, and total starch initially increased and then decreased at 20 d after anthesis. Additionally, the three Wx genes examined in this study had varying effects on the amylose content and accumulation rate, in the order of Wx-B1 > Wx-A1 > Wx-D1. Wx genes had only minor effects on amylopectin biosynthesis. Lack of Wx gene expression was expected to affect the physiochemical properties of wheat flour, with the Wx-B1 gene exhibiting the most dramatic effects. Almost all properties except taste, stickiness, and total score of dry noodles decreased following silencing of the Wx-B1 and Wx-D1 genes. Dry noodle qualities deteriorated to different degrees after silencing of one, two, or three Wx genes, and almost no amylose biosynthesis and very poor dry noodle quality were observed in wheat lacking all three Wx genes.
Introduction
Starch is the major component in wheat (Triticum aestivum L.) kernels. Wheat starch normally contains 20–30% amylose, with the remaining starch content comprised of amylopectin. Amylose content plays an important role in the quality of wheat flour, affecting the texture, stability, and viscosity of processed foods. Granule-bound starch synthase (GBSS), a key enzyme involved in the biosynthesis of amylose, is encoded by waxy (Wx) genes. Because of its role in amylose biosynthesis, GBSS also influences the texture and quality of wheat flour. Wx genes include Wx-A1, Wx-B1, and Wx-D1, which are located on chromosomes 7AS, 4AL, and 7DS, respectively, and mutations in or silencing of one or more Wx genes can cause reduction in endosperm amylose content (Anisworth et al., 1993; Nakamura et al., 1993; Sun et al., 1998; Yamamori and Endo, 1996).
Some researchers have studied the amylose synthesis ability of different Wx proteins and the effects of silencing or mutation of different Wx proteins on amylose synthesis. For example, Miura and colleagues (Mirua et al., 1994; 1999; 2002) found that the presence of a regulator gene that suppresses the activities of Wx genes and the absence of the Wx-B1 gene or substitution with the corresponding null allele causes dramatic reductions in amylose synthesis. While amylose content is not expected to be increased by double dosages of chromosomes 7A, 4A, and 7D, upregulation of Wx proteins is observed in the context of tetrasomic chromosomes. A more comprehensive study of the correlation between amylose content and starch viscosity properties was carried out using near-isogenic Wx wheat lines (Bhattacharya et al., 2002; Zhao et al., 1998). Nakamura et al. (1995) indicated that there were no significant differences in protein content in eight near-isogenic Wx wheat lines. As compared to the normal line, lower falling number, glucose yield, and ethanol yield and higher grain protein content were observed in double-null (WxBD) and triple-null (WxABD) near-isogenic lines, indicating the strong involvement of alleles encoded at Wx-B1 and Wx-D1 loci in grain composition (Gadonna-widehem et al., 2012). Moreover, waxy wheat starch contains a smaller proportion of B-type granules, larger average granule diameter, and higher degree of crystallinity than normal wheat starch; these differences result in higher gelatinization temperature, transition enthalpy, peak viscosity, breakdown, and swelling power and lower peak viscosity temperature and final viscosity, suggesting that waxy wheat starch has greater resistance to retrogradation during cooling and higher water-holding capacity under dry conditions (Zhang et al., 2013; 2014). Several studies have shown that waxy wheat behaves differently from wild-type and partial-waxy wheat in terms of physicochemical characteristics. Waxy wheat flours exhibits low falling numbers that are independent of α-amylase levels and lower setback, pasting, and peak temperatures than normal and partial-waxy wheat flour (Graybosch et al., 2000; Kim et al., 2003; Park et al., 2001; Sharma et al., 2002). In addition, waxy wheat flour exhibits higher breakdown, peak viscosity, gelatinization temperature, protein content, water absorption, SDS-sedimentation volume, starch damage, swelling power, and alkaline water retention capacity as well as a greater degree of crystallization and an absence of amylose-lipid complex compared with nonwaxy wheat (Chakraborty et al., 2004; Guo et al., 2003; Morita et al., 2002; Park and Baik, 2004; Sasaki et al., 2004). Furthermore, waxy wheat starches show greater refrigeration and freeze-thaw stabilities than nonwaxy starches (Abdel-Aal et al., 2002). Thus, it is clear that Wx genes have substantial effects on the texture and qualities of wheat flour.
Dry noodles are widely consumed in China and can be influenced by the physicochemical properties of wheat flour. Both grain hardness and water absorption are negatively related to the color, appearance, smoothness, and taste of cooked dry noodles (Liu et al., 2003). Flour ash content and polyphenol oxidase (PPO) have moderate negative effects on noodle color, while protein content is negatively associated with the appearance and smoothness of noodles. The associations of dry noodle score with SDS-sedimentation volume, stability time, and maximum resistance can be fit to a quadratic regression model, and the peak viscosity and breakdown contribute positively to dry noodle qualities (He et al., 2004). Importantly, waxy flour has little or no amylose in its starches; thus, amylose content will be decreased when waxy flour is added to normal wheat flours. Some studies have described the production of noodles made with waxy flour blends. For example, adding 20–30% waxy flour to wild-type flour improves the quality of white salted noodles, and the optimal amylose content has been reported to be 21–24% (Noda et al., 2001). White salted noodles produced from blends of regular and waxy wheat flours become softer as the proportion of waxy wheat flour is increased, even when the protein content of the flour blend is increased. Moreover, the amylose content of starch is positively correlated with hardness and negatively correlated with cohesiveness of cooked white salted noodles (Park and Baik, 2004, Baik et al., 2003). Noodles prepared from waxy wheat flour exhibit the shortest cooking time, demonstrating the influence of starch amylose content on cooking time in noodles (Noda et al., 2001), and have a higher compressive force than nonwaxy noodles when the strain is greater than 80%, indicating that waxy wheat noodles are soft but difficult to cut through completely (Sasaki et al., 2004).
In this study, we aimed to analyze the influence and function of all Wx genes. To this end, nonwaxy wheat Ningmai 14 and waxy wheat Wx 9 were hybridized and continuously backcrossed, generating near-isogenic Wx wheat lines by marker-assisted selection. The effects of various Wx genes on wheat starch biosynthesis and the quality of wheat flours and dry noodles were investigated. Our results provide important insights into the effects of Wx genes on starch quality, agronomic traits, wheat flour properties, and food quality in winter wheat and may facilitate further studies and applications of Wx genes in wheat.
Materials and Methods
Wheat samples The waxy wheat line Yangfan 9, provided by Professor Shunhe Cheng, Lixiahe Agricultural Research Institute, Jiangsu Province, lacking the Wx-A1, Wx-B1 and Wx-D1 proteins, was used as the waxy gene donor. The wild-type wheat genotype, Ningmai 14, was used as the recurrent parent to create sets of NILs with null alleles at one, two, or all three Wx loci. Both Ningmai 14 and Yangfan 9 are hard red wheat cultivars with medium gluten content and good agronomic traits. The eight near-isogenic Wx wheat lines with the Ningmai 14 background were developed after seven backcross generations with an individual heterozygous plant at three Wx loci. Individual plants from backcross progenies were selected by microscopic examination after pollen staining with 0.07% I2-KI; plants with one-eighth yellow pollens and seven-eighths black pollens were used as male parents, while plants with all black pollens were eliminated. The BC7F2 populations were obtained by individual plant selfing of BC7F1; the absence of the waxy protein at various loci was confirmed by sodium dodecyl sulfate polyacrylamide gel electrophoresis (SDS-PAGE, for Wx-A1) and agarose gel electrophoresis (AGE, for Wx-B1 and Wx-D1) (Table 1) (Kim et al., 2003).
Table 1.
Wx gene primer table
| Primer name |
Allele |
Primer sequence (5′→3′) |
Expected amplified product |
| 1 |
Wx-A1 |
CCAAAGCAAAGCAGGAAACC |
Wx-A1a 336bp |
|
|
TACCTCGGAGATGACGCTGG |
Wx-A1b 317bp |
| 2 |
Wx-B1 |
GCTACCTCAAGAGCAACT |
Wx-B1a 187bp |
|
|
TTGAGCTGCGCGAAGTCGTC |
Wx-B1b - |
| 3 |
Wx-D1 |
ACAGGATCTCTCCTGGAAG |
Wx-D1a 840bp |
|
|
GCAAGGAAAATAGTGAAGC |
Wx-D1b 260bp |
The results of agarose gel electrophoresis showed that the Wx-A1 and Wx-D1 genes were codominant, whereas the Wx-B1 gene was dominant. 336 bp (lanes 9, 10 and 11) and 317 bp (lanes 1, 2, 3, and 4) for Wx-A1 (Figure 1), 840 bp (lanes 1, 2, 3, and 4) and 260 bp (lanes 9, 10, 11, and 12) for Wx-D1 (Figure 3) were indicated dominant and recessive respectively. 259 bp and 217 bp (lanes 1, 2, 3, 4, and 5) were indicated recessive, that 259 bp, 217 bp, and 187 bp were homozygous or heterozygous dominant (Figure 2), which should be confirmed through separate offspring. Eight genotypes are shown in Table 2.
Table 2.
Eight genotypes of near-isogenic
Wx lines of wheat
| Genotype |
Absence of three Wx genes |
|
Wx-A1 |
Wx-B1 |
Wx-D1 |
| Wild type |
+ |
+ |
+ |
| WxA |
− |
+ |
+ |
| WxB |
+ |
− |
+ |
| WxD |
+ |
+ |
− |
| WxAB |
− |
− |
+ |
| WxAD |
− |
+ |
− |
| WxBD |
+ |
− |
− |
| WxABD |
− |
− |
− |
During the 2013-10 cropping seasons, the derived genotypes were grown in a randomized block design with two replicates, at the research station of Yunnan Agricultural University, Yunnan Province. Each plot consisted of 10 rows (2.0 m long, 0.25 m apart). Field management was according to local practices, and all samples were free of sprouting. Wheat ears were marked the same day from the blossoming. Five ears from each line were sampled 10, 20, 30, and 40 d after anthesis, and four central spikelets of each ear were stripped and frozen with liquid nitrogen for the analysis of grain starch. Wheat was milled into flour by a Buhler laboratory mill 3 months after harvest, and dry noodles were produced 3 weeks after milling.
Biosynthesis dynamics of total starch, amylose, and amylopectin Amylose and total starch contents were determined as described by AACC 61-03 and 76-13 with minor modifications (AACC 2000). Amylopectin content was calculated as the difference between total starch and amylose contents. Content was expressed as the percentage of dry weight, and the biosynthesis rate was expressed as the percentage of total content each d.
Analysis of flour characteristics Zeleny sedimentation value, falling number, moisture, protein content, gluten content, amylose content, farinograph parameters, and pasting properties were determined by AACC 56-60, 44-15A, 56-81B, 46-13, 38-12, 61-03, 54-21, and 61-02 (AACC 2000), respectively. Minolta (CR-410), a colorimeter, was used for determination of L* (whiteness), a* (red and green color), and b* (yellow color) of wheat flour.
Production of dry noodles For production of noodles, 33 mL water was added to 100 g flour (14%mb), mixed by hand for 5 min, and rested for 10 min. The dough was then passed through the rolls of a noodle machine with a 3-mm gap, folded, and passed through the sheeting rolls two more times. The dough was passed through gap five times to create sheetings that measured 3.0, 2.5, 2.0, 1.5, and 1.0 mm thick. The sheets were then cut into strips measuring 1 mm in width. Noodles were hung at room temperature and 45% RH for 3 d until dried. No dry noodles broke in all samples.
Noodle cooking and evaluations Noodles were cooked in 500 mL boiling distilled water for 8 min with gentle stirring to prevent sticking to the bottom of the pan during cooking. After cooking, the noodles were cooled by immediate immersion into running tap water (20°C) for 10 s. The color, appearance, hardness, stickiness, elasticity, smoothness, and taste of cooked noodles were scored by trained individuals, with 20, 10, 10, 15, 15, 20, and 10 being the highest scores for the above parameters, respectively. The total noodle score was obtained by taking the sum of these points.
Statistical analyses All experiments were performed three times for each sample. Analyses of variance (ANOVA) and least square differences (LSD) analyses were performed for all traits with the Statistical Analysis System 9.0 software (SAS 9.0). The level of significance was defined at P < 0.05 for all data analyses.
Results
Biosynthesis dynamics of total starch, amylose, and amylopectin The different genotypes exhibited significant differences in the content and biosynthesis rates of amylose and total starch but not amylopectin (Table 3). Moreover, the content and biosynthesis rates of total starch, amylose, and amylopectin varied significantly according to the number of d after anthesis.
Table 3.
Variance analysis of content and biosynthesis rate of total starch, amylose and amylopectin (
F value)
| Source of Variation |
df |
Amylose content |
Amylopectin content |
Total starch content |
Biosynthesis rate of amylose |
Biosynthesis rate of amylopectin |
Biosynthesis rate of total starch |
| Genotypes |
7 |
12.3* |
0.895 |
14.9* |
3.39* |
0.169 |
1.00* |
| Days after anthesis |
3 |
44.0* |
993* |
642* |
24.4* |
185* |
146* |
* indicate difference at
P < 0.05.
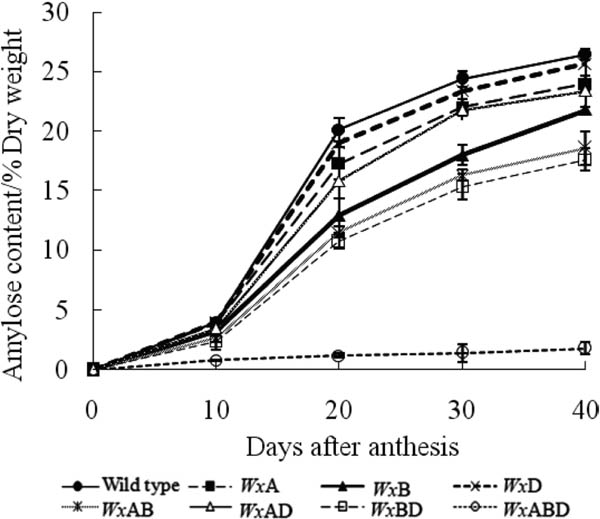
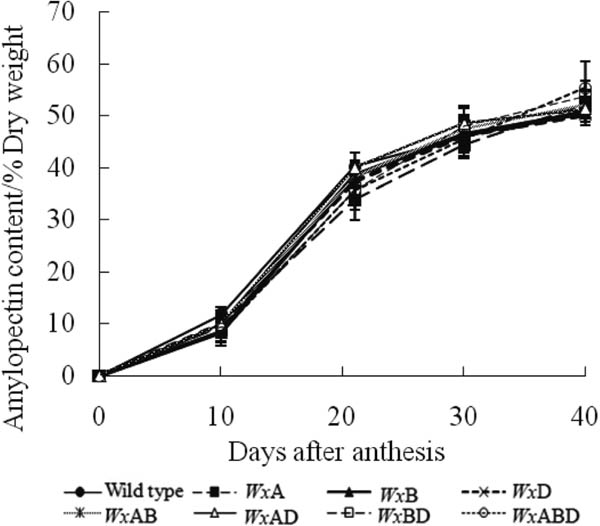
Contents of amylose (Figure 4), amylopectin (Figure 5), and total starch (Figure 6) increased in all Wx genotypes, except WxABD, which exhibited almost no amylose biosynthesis throughout the study. There were no significant differences in amylopectin contents among all Wx genotypes on the same day after anthesis. However, lack of the Wx gene decreased the biosynthesis of amylose content in wheat, with decreases in the order of Wx-B1 > Wx-A1 > Wx-D1. The wild-type wheat exhibited the highest amylose content when compared with the Wx mutants on the same day after anthesis.

The biosynthesis rates of amylose (Figure 7), amylopectin (Figure 8), and total starch (Figure 9) increased gradually for the first 10 days after anthesis and then increased rapidly to a peak from 10 to 20 d after anthesis. Subsequently, the biosynthesis rates decreased sharply from 20 to 30 d after anthesis, with a gradual decline thereafter. However, there were no significant differences in amylose biosynthesis for WxABD resulting from the loss of synthesis ability. The biosynthesis rates of amylopectin and total starch were the same for all Wx genotypes except for the total starch biosynthesis of WxABD, which decreased due to the impaired amylose biosynthesis ability. The amylose biosynthesis rate was significantly different among the various Wx genotypes; that of the wild type was far higher than those of other genotypes, particularly when high amounts of amylose were synthesized by 20–30 d after anthesis. The effects of the three Wx genes on the amylose biosynthesis rate followed the order of Wx-B1 > Wx-A1 > Wx-D1.

Physicochemical properties of wheat flour As shown in Table 4, the amylose contents of NILs varied from 0.6% in genotype WxABD to 24.1% in the wild-type genotype in the Ningmai 14 background. The wild-type genotype had the highest amylose content, followed by single null genotypes, double null genotypes, and the waxy genotype. From double null genotypes, the genotype WxAD showed significantly higher amylose content than the other two genotypes, and genotype WxBD had the lowest content. From single null genotypes, the genotype WxB had higher amylose content than the other two genotypes. Furthermore, WxABD, the waxy genotype, had the highest sedimentation value and lowest falling number, a* value, and b* value. The protein content of wild-type wheat was lesser than those of most all other genotypes except for WxA and WxAB.
Table 4.
Physicochemical properties of near-isogenic wheat line flour
| Genotype |
Wet gluten content/% |
Falling number/s |
Sedimentation value/mL |
Protein content/% |
Amylose content/% |
L* value |
a* value |
b* value |
| Wild type |
45.4 ab |
568 bc |
64.5 c |
12.5 d |
24.1 a |
93.6 a |
−0.94 b |
7.29 bc |
| WxA |
42.9 cd |
442 d |
56.0 d |
12.1 d |
22.9 b |
93.7 a |
−0.97 b |
7.22 c |
| WxB |
40.4 ef |
522 c |
44.0 e |
14.3 a |
22.1 c |
93.1 a |
−1.14 a |
7.99 a |
| WxD |
45.9 a |
827 a |
68.3 bc |
12.6 cd |
23.3 b |
93.8 a |
−0.86 b |
7.04 cd |
| WxAB |
40.5 ef |
487 d |
56.5 d |
12.4 cd |
18.5 e |
94.1 a |
−0.89 b |
6.67 ef |
| WxAD |
39.9 f |
285 e |
70.0 ab |
13.1 b |
20.3 d |
93.9 a |
−1.10 a |
6.91 de |
| WxBD |
39.6 f |
546 bc |
63.5 c |
13.0 b |
16.2 f |
93.4 a |
−1.11 a |
8.03 a |
| WxABD |
41.3 de |
85 f |
74.3 a |
13.8 ab |
0.600 g |
93.1 a |
−0.73 c |
6.30 f |
Values followed by the same letters in the same column are not significantly different at P < 0.05.
Pasting properties of near-isogenic Wx wheat lines are shown in Table 5. The peak viscosity and trough viscosity increased when the Wx-B1 gene was disrupted, but decreased when the Wx-D1 gene was disrupted; however, disruption of the Wx-A1 gene did not significantly affect these two indicators. Breakdown increased in genotypes lacking one or two Wx genes, but sharply decreased in the genotype lacking all three Wx genes. Thus, lack of only one Wx gene decreased the final viscosity and setback. The peak viscosity, trough viscosity, breakdown, setback, and peak time of WxABD, the waxy wheat line, were significantly lower than those of the other genotypes. Additionally, the pasting temperature increased in the absence of the Wx-A1 gene. There were no significant differences in peak time among all Wx genotypes, with the exception of WxABD.
Table 5.
Pasting properties of near-isogenic
Wx wheat lines
| Genotype |
Peak Viscosity / mPas |
Trough Viscosity / mPas |
Breakdown / mPas |
Final Viscosity / mPas |
Setback / mPas |
Peak time / min |
Pasting Temperature /°C |
| Wild type |
2841 c |
1828 b |
1013 d |
3177 a |
1349 a |
6.27 a |
61.9 c |
| WxA |
2928 b |
1824 b |
1104 c |
3030 c |
1206 b |
6.27 a |
62.3 bc |
| WxB |
3186 a |
1977.5 a |
1209 b |
3106 b |
1129 c |
6.33 a |
61.8 c |
| WxD |
2883 bc |
1671 cd |
1213 b |
2683 de |
1012 d |
6.27 a |
63.1 ab |
| WxAB |
3155 a |
1765 c |
1390 a |
2760 de |
995 e |
6.17 a |
63.2 ab |
| WxAD |
2516 d |
1467 e |
1049 d |
2376 f |
909 e |
6.13 a |
63.7 a |
| WxBD |
2816 c |
1645 d |
1172 c |
2651 e |
1006 d |
6.24 a |
62.8 b |
| WxABD |
1479 e |
880 f |
599 e |
1455 g |
575 f |
4.64 b |
63.7 a |
Values followed by the same letters in the same column are not significantly different at P < 0.05.
The farinograph parameters of near-isogenic Wx wheat lines are shown in Table 6. Lack of Wx-B1 and Wx-D1 increased the water absorption of wheat flour. Although lack of the Wx-A1 gene did not increase water absorption, lack of all three genes resulted in a sharp increase in this parameter. The water absorption, development time, and tolerance index of WxABD were significantly higher than those of all other genotypes; however, the stability time was the lowest in this mutant. The break time, development time, farinograph quality number, and tolerance index increased, and the stability time decreased in the absence of the Wx-B1 gene.
Table 6.
Farinograph parameters of near-isogenic
Wx wheat lines
| Genotype |
Water absorption/mL |
Development time/min |
Stability time/min |
Break time/min |
Farinograph quality number |
Tolerance index/BU |
| Wild type |
63.8 de |
1.9 de |
3.0 bc |
6.7 bc |
51.3 f |
51.2 e |
| WxA |
61.2 e |
1.8 ef |
3.7 a |
7.3 a |
75.6 a |
37.9 f |
| WxB |
67.6 bc |
2.1 cd |
2.6 d |
6.9 b |
68.1 bc |
61.3 d |
| WxD |
66.1 cd |
2.2 c |
2.9 c |
6.4 cd |
66.5 cd |
77.1 b |
| WxAB |
64.7 d |
1.7 fg |
3.1 b |
6.8 bc |
55.7 ef |
46.6 e |
| WxAD |
67.3 bc |
1.6 g |
2.3 e |
4.5 f |
46.2 g |
63.4 d |
| WxBD |
68.9 b |
2.5 b |
2.8 cd |
6.2 d |
63.3 d |
72.9 c |
| WxABD |
75.1 a |
3.5 a |
1.7 f |
5.4 e |
53.2 ef |
121.0 a |
Values followed by the same letters in the same column are not significantly different at P < 0.05.
The correlation between farinograph properties, amylase content, and other physicochemical properties of wheat flour is shown in Table 7. Water absorption showed a significant negative correlation with wet gluten content, peak viscosity, trough viscosity, peak time, protein content, final viscosity, and setback. Development time showed a significant negative correlation with peak viscosity, trough viscosity, breakdown, wet gluten content, and peak time. Stability time showed a significant positive correlation with peak viscosity, trough viscosity, setback, and peak time and negative correlation with protein content. Breaking time was negatively correlated with pasting temperature, and tolerance index was significantly negatively correlated with all indicators, except falling number, pasting temperature, and protein content. Amylose content was positively correlated with all indexes, except pasting temperature and protein content.
Table 7.
Correlation analysis between physiochemical properties of wheat flour
|
Water absorption |
Development Time |
Stable time |
Breaking time |
Farinograph Quality number |
Tolerance index |
Amylosecontent |
| Wet gluten content |
−0.825* |
−0.889* |
0.685 |
0.249 |
0.065 |
−0.897* |
0.841* |
| Falling number |
−0.56 |
−0.428 |
0.604 |
0.547 |
0.45 |
−0.448 |
0.745* |
| Peak viscosity |
−0.785* |
−0.787* |
0.770* |
0.644 |
0.44 |
−0.853* |
0.873* |
| Trough viscosity |
−0.814* |
−0.762* |
0.782* |
0.701 |
0.474 |
−0.868* |
0.902* |
| Breakdown |
−0.657 |
−0.737* |
0.667 |
0.491 |
0.344 |
−0.737* |
0.735* |
| Final viscosity |
−0.853* |
−0.756* |
0.807* |
0.704 |
0.433 |
−0.879* |
0.915* |
| Setback |
−0.857* |
−0.699 |
0.793* |
0.665 |
0.345 |
−0.840* |
0.877* |
| Peak time |
−0.811* |
−0.847* |
0.745* |
0.456 |
0.348 |
−0.853* |
0.952* |
| Pasting temperature |
0.536 |
0.318 |
−0.55 |
−0.760* |
−0.474 |
0.561 |
−0.587 |
| Protein content |
0.731* |
0.514 |
−0.753* |
−0.327 |
−0.115 |
0.578 |
−0.45 |
* indicate significantly correlation at P < 0.05.
Sensory qualities of dry noodles Dry noodle scores of near-isogenic Wx wheat lines are shown in Table 8. The color, appearance, hardness, and total score of the wild-type wheat were the highest, while those of WxABD were the lowest from all Wx genotypes. The hardness, appearance, and total score of WxA were higher than those of the other two single null genotypes, and that of WxBD were lower in double null genotypes. The stickiness, elasticity, and smoothness increased in the absence of the Wx-A1 gene. There were no differences in taste for all Wx genotypes, and the lack of the Wx-A1 gene did not significantly decrease the total score.
Table 8.
Scores for dry noodles of near-isogenic
Wx wheat lines
| Genotype |
Dry noodle qualities |
|
Color |
Appearance |
Hardness |
Stickiness |
Elasticity |
Smoothness |
Taste |
Total score |
| Wild type |
17.5 a |
8.4 a |
8.5 a |
13.3 cd |
13.2 ab |
16.7 ab |
7.4 a |
85.0 a |
| WxA |
16.5 b |
8.0 ab |
7.3 c |
14.2 a |
13.7 a |
17.2 a |
7.5 a |
84.4 ab |
| WxB |
15.7 c |
7.7 cd |
8.1 ab |
14.1 ab |
12.8 cd |
16.6 bc |
7.1 a |
82.1 cd |
| WxD |
16.0 bc |
7.1 e |
7.6 bc |
13.6 bc |
12.4 d |
16.3 bc |
7.3 a |
80.3 d |
| WxAB |
17.1 a |
7.9 bc |
7.2 c |
13.3 cd |
13.3 ab |
16.8 ab |
7.0 a |
82.6 cd |
| WxAD |
17.0 a |
8.2 ab |
8.1 ab |
13.1 d |
13.5 ab |
16.3 bc |
7.9 a |
84.1 ab |
| WxBD |
16.2 bc |
7.6 de |
8.4 ab |
13.4 cd |
13.0 bc |
16.1 c |
7.7 a |
82.4 cd |
| WxABD |
13.9 d |
6.3 f |
6.0 d |
12.1 e |
12.5 d |
16.2 c |
7.3 a |
74.7 e |
Values followed by the same letters in the same column are not significantly different at P < 0.05.
Correlation analysis of dry noodle scores and wheat flour qualities is shown in Table 9. Wet gluten content showed a significant positive correlation with color, appearance, hardness, elasticity, and total score, while amylose content showed a significant positive correlation with color, appearance, stickiness, and total score. There were no significant effects of protein content and falling number on individual scores or total scores for dry noodles. In addition, the peak viscosity, trough viscosity, final viscosity, setback, peak time, and stability time were significantly positively correlated with the total score, while water absorption and development time showed a significant negative correlation with the total score.
Table 9.
Correlation analysis between dry noodle scores and physiochemical properties of wheat flour
|
Dry noodle qualities |
|
Color |
Appearance |
Hardness |
Stickiness |
Elasticity |
Smoothness |
Taste |
Total score |
| WGC |
0.917* |
0.971* |
0.741* |
0.648 |
0.778* |
0.477 |
0.376 |
0.996* |
| AsC |
0.801* |
0.785* |
0.677 |
0.830* |
0.419 |
0.478 |
0.055 |
0.862* |
| PC |
−0.644 |
−0.448 |
−0.048 |
−0.25 |
−0.524 |
−0.494 |
−0.148 |
−0.514 |
| FN |
0.455 |
0.282 |
0.504 |
0.637 |
−0.17 |
0.109 |
−0.204 |
0.418 |
| PV |
0.709* |
0.686 |
0.575 |
0.863* |
0.354 |
0.488 |
−0.227 |
0.761* |
| TV |
0.694 |
0.729* |
0.63 |
0.903* |
0.377 |
0.563 |
−0.205 |
0.799* |
| BD |
0.653 |
0.547 |
0.43 |
0.709* |
0.281 |
0.325 |
−0.236 |
0.622 |
| FV |
0.735* |
0.775* |
0.665 |
0.872* |
0.419 |
0.597 |
−0.141 |
0.839* |
| SB |
0.748* |
0.794* |
0.675 |
0.772* |
0.456 |
0.612 |
−0.038 |
0.846* |
| PT |
0.803* |
0.785* |
0.745* |
0.845* |
0.433 |
0.376 |
0.09 |
0.874* |
| PaT |
−0.336 |
−0.492 |
−0.529 |
−0.692 |
−0.175 |
−0.532 |
0.274 |
−0.526 |
| WAb |
−0.815* |
−0.787* |
−0.38 |
−0.769* |
−0.658 |
−0.783* |
0.019 |
−0.852* |
| DvT |
−0.907* |
−0.896* |
−0.519 |
−0.652 |
−0.706 |
−0.556 |
−0.117 |
−0.906* |
| StT |
0.652 |
0.605 |
0.268 |
0.790* |
0.552 |
0.758* |
−0.098 |
0.714* |
| BrT |
0.222 |
0.228 |
0.061 |
0.687 |
0.105 |
0.697 |
−0.594 |
0.31 |
| FQN |
−0.144 |
−0.083 |
−0.057 |
0.744* |
−0.035 |
0.423 |
−0.243 |
0.089 |
| TI |
−0.863* |
−0.893* |
−0.481 |
−0.776* |
−0.759* |
−0.753* |
0.01 |
−0.925* |
* indicate significantly correlation at P < 0.05.
Discussion
The mechanism of starch synthesis is complex; sucrose synthesized in leaves or degraded starch is transported to the storage organs through phloem, and amylose and amylopectin are finally synthesized by ADP-glucose pyrophosphorylase, starch synthase, and debranching enzymes. The starch synthase GBSS, encoded by Wx-A1, Wx-B1, and Wx-D1 genes, plays an important role in amylose synthesis. Lack of the Wx gene not only led to decreased amylose biosynthesis and content, but also caused changes in flour and food qualities. Our current study provided important insights into the biosynthesis and accumulation dynamics of starch and the qualities of wheat flour and food produced using near-isogenic Wx wheat lines.
Effects of Wx genes on the biosynthesis of total starch, amylose, and amylopectin In this study, substantial differences in amylose and total starch synthesis rates were observed in the different Wx genotypes. The amylose content of waxy genotype was the lowest, followed by that of double null genotypes and single null genotypes; however, that of the wild type genotype was the highest. In single null genotypes, genotype WxB showed significantly lower amylose content than the other two genotypes, and genotype WxD showed the highest. In double null genotypes, genotype WxAD showed significantly higher amylose content than the other two genotypes, and genotype WxAB showed the lowest. The results are not entirely consistent with previous studies (Ma et al., 2013). The effect in reduction of amylase content due to the null Wx genes in this study was Wx-B1 > Wx-A1 > Wx-D1. However, lack of Wx genes did not affect the amylopectin content or biosynthesis rate. Moreover, the content and accumulation rates of amylose and total starch were higher in wild-type wheat than in the other Wx genotypes because all Wx genes exhibited dominant expression patterns. Importantly, when all three Wx genes were absent, amylose synthesis was almost complete abolished, indicating that the three Wx genes may have interactive effects. Based on our data describing the accumulation rates of amylose, amylopectin, and total starch, peak wheat grain filling was achieved at 10–20 d after anthesis, and starch accumulation was rapid. However, starch synthesis and accumulation rates decreased gradually as the leaves gradually aged and the seeds transformed into fully ripened seeds. Wx genes have been suggested to act in an epistatic manner (Miura et al., 1999). Therefore, amylose content is not only influenced by Wx genes but is also affected by genetic background and growth environments. Further studies are required to determine the molecular mechanism underlying the different effects of three Wx genes on amylose synthesis.
Effects of Wx genes on physicochemical properties of wheat flour The waxy genotypes showed faster peak viscosities (Blazek and Copeland, 2008), greater pasting degrees (Ma et al., 2013) and resistance to retrogradation, as indicated by lower setback viscosities (Blazek and Copeland, 2008; Sasaki et al., 2000), as compared with non-waxy starches due to lack of amylose. The Wx-B1 null genotype showed higher peak viscosity, trough viscosity, final viscosity and setback than the other two single null genotypes and three double null lines (Kim et al., 2003; Yamamori and Quynh, 2000), which indicated that the Wx-B1 gene null might result in the alteration of amylopectin structure within starch granules of this genotype (Ma et al., 2013; Hansen et al., 2010). Moreover, the doughs made from waxy wheat flours had significantly higher water absorption (Morita et al., 2002a), lower stability during mixing just like the soft wheat flours (Hung et al., 2005b; Morita et al., 2002a), weaker gluten strength (Graybosch et al., 2003), stickier dough, and lesser firmness than the non-waxy wheat, which should be attributable to the high amount of protein and dietary fiber (Huang et al., 2006).
The results of this study were basically consistent with previous studies (Blazek and Copeland, 2008; Graybosch et al., 2003; Hansen et al., 2010; Hung et al., 2005b; 2006; Kim et al., 2003; Ma et al., 2013; Morita et al., 2002a; Sasaki et al., 2000; Yamamori and Quynh, 2000). Lack of Wx genes altered the physiochemical properties of wheat flour. However, absence of different Wx genes did not always cause the same changes in these physicochemical properties. Lack of the Wx-A1 and Wx-B1 genes reduced wheat flour wet gluten content, sedimentation value, and falling number significantly, while the opposite effect was noted for the Wx-D1 gene. Lack of the Wx-B1 and Wx-D1 genes caused an increase in protein content and a decrease in amylose content, but a decrease in protein content was observed when the Wx-A1 gene was null. Lack of the Wx-B1 gene increased peak viscosity and trough viscosity, while lack of the Wx-D1 gene reduced these properties. Overall, the Wx-B1 gene exhibited the most dramatic effects on the physicochemical properties of wheat flour, particularly for break time, development time, farinograph quality number, tolerance index, stability time, wet gluten content, sedimentation value, and amylose content, which may affect the strength of the dough. Most importantly, absence of all three genes caused dramatic changes in farinograph parameters and pasting properties of wheat flour and content of protein, gluten, and amylose, indicating that qualitative changes in wheat flour and products were the result of interactions among the three Wx genes.
Effects of Wx genes on the sensory qualities of dry noodles Noodles are one of the most important foods in many Asian countries, and the eating quality should be significantly influenced by the quality and characteristics of wheat starches and flours. Lower amylose contents lead to better white salted noodle qualities (Jane et al., 1999; Miura and Tanii, 1994; Noda et al., 2001; Wang and Seib, 1996), whereas high paste viscosity, breakdown, low gelatinization temperature and high swelling power of starch were beneficial for the textural properties of white salted noodles (Endo et al., 1988; Crossbie et al., 1991; Panozzo and McCormick, 1993). Waxy wheat flour with high peak paste viscosity and swelling power are considerable for producing superior white salted noodles (Hung et al., 2006). Noodles prepared from the reduced amylose flours by addition of waxy wheat flour had decreased firmness, gumminess and chewiness, whereas the cohesiveness, springiness and resilience of noodles increased (Guo et al., 2003).
In this study, most properties of dry noodle scores were much higher in the wild-type wheat than in the Wx genotypes, and the absence of all three Wx genes resulted in the most substantial decreases in dry noodle scores. Indeed, dry noodle quality deteriorated to different degrees depending on the absence of one, two, or three Wx genes. Importantly, wet gluten content, amylose content, peak viscosity, trough viscosity, final viscosity, setback, peak time, and stability time of dry noodles increased the individual and total scores, while increased water absorption and development time decreased the total and individual scores. Additionally, dry noodle quality was significantly affected by protein content.
The amylose contents of waxy wheat and partial waxy wheat decreased to different degrees depending on the lack of different numbers and types of Wx genes; these parameters were also expected to affect dry noodle quality. Indeed, dry noodle quality was particularly poor for waxy wheat in which amylose was almost completely absent. While the ratio of the color score was higher in the waxy wheat during evaluation of dry noodles, the color could be improved during production using other methods. Therefore, if the negative effects of waxy wheat on color were not considered, the absence of Wx genes would be expected to have less effect on dry noodle quality. In addition, changes in protein quality did not affect the overall quality of the noodles; however, higher wet gluten content and stability time were beneficial for dry noodle quality. Therefore, these two indicators may be used as important indexes in the breeding of new wheat cultivars.
Conclusion
Although the three Wx genes examined in this study had varying effects on amylose biosynthesis, they had only minor effects on amylopectin. Lack of Wx gene expression was expected to affect the physiochemical properties of wheat flour. Almost all properties except taste, stickiness, and total score of dry noodles showed a decrease following silencing of Wx-B1 and Wx-D1 genes, and almost no amylose biosynthesis and very poor dry noodle quality were observed in wheat lacking all three Wx genes. The Wx-B1 gene had the most dramatic effect on starch biosynthesis, physicochemical wheat flour properties, and dry noodle quality from among the three Wx genes.
Acknowledgments This work was supported by the National Key Research and Development Program (2017YFD0100902), Yunnan Science and Technology Project (2015BB016), Kunming Science and Technology Project (2015-1-H-00308), and National Natural Science Foundation of China (31000712). We wish to thank Luo Sichuan, Zhang Huijuan, and Wang Shuo for assistance with the experiments. We would like to thank Editage [http://www.editage.cn/] for English language editing.
References
- AACC 2000. Approved Methods of the AACC (tenthed). American Association of Cereal Chemists, St. Paul, MN.
- Abdel-Aal, E.S.M., Hucl, P., Chibbar, R.N., and Han, H.L. (2002). Physicochemical and structural characteristics of flours and starches from waxy and nonwaxy wheats. Cereal Chem., 79, 458-464.
- Anisworth, C., Tarvis, M., and Clark, J. (1993). Isolation and analysis of cDNA clone encoding the small subunit of ADP-glucose pyrophosphorylase from wheat. Plant Mol. Biol., 23, 23-33.
- Baik, B.K., Park, C.S., Paszczynska, B., and Konzak, C.F. (2003). Characteristics of noodles and bread prepared from double-null partial waxy wheat. Cereal Chem., 80, 627-633.
- Bhattacharya, M., Erazo, C.S.V., Doehlert, D.C., and Mcmullen, M. (2002). Staling of bread as affected by waxy wheat flour blends. Cereal Chem., 79, 178-182.
- Blazek, J. and Copeland, L. (2008). Pasting and swelling properties of wheat flour and starch in relation to amylose content. Carbohydr. Polym., 71, 380-387.
- Chakraborty, M., Matkovic, K., Grier, D.G., Jarabek, E.L., Berzonsky W., and Mcmullen M. (2004). Physicochemical and functional properties of tetraploid and hexaploid waxy wheat starch. Starch-Starke, 56, 339-347.
- Crosbie, G.B. (1991). The relationship between starch swelling properties, paste viscosity and boiled noodle quality in wheat flours. J. Cereal Sci., 13, 145-150.
- Endo, S., Karobe, S., and Nagao, S. (1988). Factors affecting gelatinization properties of starch. J. Jpn. Soc. Food Sci. Technol. (Nippon Shokuhin Kogyo Gakkaishi), 35, 7-14. (in Japanese)
- Gadonna-widehem, P., Debiton, C., David, M., Rhazi, L., and Branlard, G. (2012). A laboratory protocol for determining glucose and maximum ethanol production from wheat grain: application to a complete genetic set of near-isogenic waxy lines. J. Agric. Food Chem., 60, 985-990.
- Graybosch, R.A., Gang, G., and Shelton, D.R. (2000). Aberrant falling numbers of waxy wheats independent of alpha-amylase activity. Cereal Chem., 77, 1-3.
- Graybosch, R.A., Souza, E., Berzonsky, W., Baenziger, P.S., and Chung, O. (2003). Functional properties of waxy wheat flours: Genotypic and environmental effects. J. Cereal Sci., 38,, 69-76.
- Guo, G., Jackson, D.S., Graybosch, R.A., and Parkurst, A.M. (2003). Asian salted noodle quality: impact of amylose content adjustments using waxy wheat flour. Cereal Chem., 80, 437-445.
- Hansen, L.E., Jackson, D.S., Wehling, R.L., Wilson, J.D., and Graybosch, R.A. (2010). Functionality of native tetraploid wheat starches: effects of waxy loci alleles and amylose concentration in blends. J. Cereal Sci., 52, 39-45.
- Hung, P.V., Maed, T., and Morita, N. (2006). Waxy and high-amylose wheat starches and flours characteristics, functionality and application. Trends Food Sc. Tech., 17, 448-456.
- Hung, P.V., Yamamori, M., and Morita, N. (2005). Formation of enzyme-resistant starch in bread as affected by high-amylose wheat flour substitutions. Cereal Chem., 82, 690-694.
- He, Z.H., Yang, J., Zhang, Y,L., Quail, K.J., and Peña, R.J. (2004). Pan bread and dry white Chinese noodle quality in Chinese winter wheats. Euphytica. 139, 257-267.
- Jane, J.L, Chen, Y.Y., Lee, L.F., McPherson, A.E., Wong, K.S., and Radosavljevic, M. (1999). Effects of amylopectin branch chain length and amylose content on the gelatinization and pasting properties of starch. Cereal Chem., 76, 629-637.
- Kim, W., Johnson, J.W., Graybosch, R.A., and Gaines, C.S. (2003). Physicochemical properties and end-use quality of wheat starch as a function of waxy protein alleles. J. Cereal Sci., 37, 195-204.
- Liu, J.J., He, Z.H., Zhao, Z.D., Peña, R.J., and Rajaram S. (2003). Wheat quality traits and quality parameters of cooked dry white Chinese noodles. Euphytica, 131, 147-154.
- Miura, H., Araki, E., and Tarui, S. (1999). Amylose synthesis capacity of the three Wx genes of wheat cv. Chinese Spring. Euphytica, 108, 91-95.
- Miura, H. and Tanii, S. (1994). Endosperm starch properties in several wheat cultivars preferred for Japanese noodles. Euphytica, 72, 171-175.
- Mirua, H., Tanii, S., and Nakamura, T. (1994). Genetic control of amylose content in wheat endosperm starch and differential effects of three Wx genes. Theor. Appl. Genet., 89, 276-280.
- Miura, H., Wickramasinghe, M.H.A., Subasinghe, R.M., Araki, E., and Komae, K. (2002). Development of near-isogenic lines of wheat carrying diferent null Wx alleles and their starch properties. Euphytica, 123, 353-359.
- Morita, N., Maeda, T., Miyazaki, M. Yamamori, M., Miura, H., and Ohtsuka, I. (2002). Dough and baking properties of high-amylose and waxy wheat flours. Cereal Chem., 79, 491-495.
- Nakamura, T., Yamamori, M., Hirano, H., and Hidaka, S. (1993). Identification of three waxy proteins in wheat (Triticum aestivum L.). Biochem. Genet., 31, 75-86.
- Nakamura, T., Yamamori, M., Hirano, H., Hidaka, S., and Nagamine, T. (1995). Production of waxy (amylose-free) wheat. Mol. Gen. Genet., 248, 253-259.
- Noda, T, Tohnooka, T, Taya, S, and Suda I. (2001). Relationship between physicochemical properties of starches and white salted noodle quality in Japanese wheat flours. Cereal Chem., 78, 395-399.
- Panozzo, J.F. and McCormick, K.M. (1993). The rapid viscoanalyser as a method of testing for noodle quality in a wheat breeding programme. J. Cereal Sci., 17, 25-32.
- Park, C.S. and Baik, B.K. (2004). Cooking time of white salted noodles and its relationship with protein and amylose contents of wheat. Cereal Chem., 81, 165-171.
- Park, C.S., Baik, B.K., Ha, Y.W., and Hong, B.H. (2001). Flour quality characteristics of Korean waxy wheat lines. Korean J. Crop Sci., 46, 360-366.
- Sasaki, T., Kohyama, K., Yasui, T., and Satake, T. (2004). Rheological properties of white salted noodles with different amylose content at small and large deformation. Cereal Chem., 81, 226-231.
- Sasaki, T., Yasui, T., and Matsuki, J. (2000). Effect of amylose content on gelatinization, retrogradation and pasting properties of starches from waxy and nonwaxy wheat and their F1 seeds. Cereal Chem., 77, 58-63.
- Sharma, R., Sissons, M., Rathjen, A.J., and Jenner C. (2002). The Null-4A Allele at the waxy locus in durum wheat affects pasta cooking quality. J. Cereal Sci., 35, 287-297.
- Sun, C., Puthigae, S., Staffan, A., and Jansson, C. (1998). The two genes encoding starch-branching enzymes II a and II b are differentially expressed in barley. Plant Physiol., 118, 37-49.
- Wang, L. and Seib, P.A. (1996). Australian salt-noodle flours and their starches compared to US wheat flours and their starches. Cereal Chem., 73, 167-175.
- Yamamori, M. and Endo, T.R. (1996). Variation of starch granule proteins and chromosome mapping of their coding genes in common wheat. Theor. Appl. Genet., 93, 275-281.
- Yamamori, M. and Quynh, N.T. (2000). Differential effects of Wx-A1, -B1 and -D1 protein deficiencies on apparent amylose content and starch pasting properties in common wheat. Theor. Appl. Genet., 100, 32-38.
- Zhang, H.X, Zhang W., Xu C.Z., and Zhou X. (2013). Morphological features and physicochemical properties of waxy wheat starch. Int. J. Biol. Macromol, 62, 304-309.
- Zhang, H.X, Zhang W., Xu C.Z., and Zhou X. (2014). Studies on the rheological and gelatinization characteristics of waxy wheat flour. Int. J. Biol. Macromol, 64, 123-129.
- Zhao, X.C., Batey, I.L., Sharp, P., Crosbie, G., Barclay, I., and Wilson, R. (1998). A single genetic locus associated with starch granule properties and noodle quality in wheat. Cereal Sci., 27, 7-13.


