Original papers
Metabolite Profiling in Dough During Fermentation
2018 年 24 巻 3 号 p. 509-517
詳細
2018 年 24 巻 3 号 p. 509-517
Changes in dough metabolite profiles during fermentation can provide insight into the relationship with bread quality. We examined the changes in dough ingredients according to the amount of yeast and with or without punching. Metabolomic analysis of dough during fermentation utilized proton nuclear magnetic resonance (1H NMR) spectroscopy and gas chromatography/mass spectrometry (GC/MS) techniques. There were small differences in the water-soluble compounds of the dough between with and without punching, but differences in the volatile compounds were found. Doubling the amount of baker's yeast halved the fermentation time, but the contents of some metabolites were different. Correlation analysis indicated that some metabolites showed moderately strong correlations with the specific volume of baked bread. Overall, this study provides insights into the extensive metabolomic diversity associated with yeast activity.
Bread is a major food fermented by yeast. The fermentation process in bread production is very important, greatly affecting the bread's qualities such as flavor and loaf volume. However, the regulation of dough fermentation is one of the most difficult processes in bread production. Yeast fermentation is especially affected by temperature, sugar content, number of cells, and processing time (Struyf et al., 2017). The yeast mainly functions to convert sugars in the dough to carbon dioxide and ethanol. Both carbon dioxide and ethanol make the bread rise, and ethanol contributes to the bread's flavor. Also, during dough fermentation, many metabolites are produced by yeasts and enzymes from wheat flour (Cho and Peterson, 2010; Mondal and Datta, 2008; Struyf et al., 2017). Yeasts consume sugar and amino acids, and then excrete organic acids, esters, and alcohols. The metabolites of yeasts are responsible for the taste and flavor composition of bread.
Many compounds are involved in the flavor of bread, and the composition of these compounds is very complicated. Metabolomics has been used to reveal the overall metabolite composition of bread, generating new information that may be valuable in bread making to improve baked bread. Thus, metabolite profiling has been performed on various breads (e.g., French bread and sourdough bread) over the past several decades (Folkes and Gramshaw, 1977; Frasse et al., 1993; Gobbetti et al., 1995; Guerzoni et al., 2007; Quilez et al., 2006; Salim-ur-Rehman et al., 2006; Schieberle and Grosch, 1985; Vernocchi et al., 2008). However, almost all of the prior research has focused on the flavor of bread after baking.
Many volatile compounds have been detected in baked bread (Cho and Peterson, 2010). Also, volatile compounds that are important for bread flavor are being identified. For example, 2-acetyl-1-pyrroline, 2-nonenal, and 3-methylbutanal are major odorants that contribute to the flavor of wheat bread crust (Cho and Peterson, 2010). The composition of volatile compounds in bread changes depending on the mixing stage and fermentation time (Maeda et al., 2009); in particular, fermentation time has a major influence on volatile compounds. As the fermentation time increases, the influence of the mixing stage on sensory evaluation decreases.
Makhoul et al. (2015) analyzed the effect of differences in wheat flours and yeast strains on the volatile compounds in dough. They reported that the differences in yeast strains have a greater influence on volatile compounds in the bread compared to the differences in wheat flours. Birch et al. (2013) reported that the profiles of volatile compounds changed in response to the amount of yeasts and the fermentation temperature; increasing the concentration of yeasts added to the dough increased the majority of aroma compounds. However, as the amount of yeasts was changed, the fermentation time also changed in a comparison of breads with the same dough volume. The reported data on the influence of the amount of baker's yeast are somewhat limited. With regard to the fermentation temperature, lipid oxidation products increased when the temperature was raised, and esters increased at low temperatures.
Several metabolic studies of sourdough bread have been conducted; however, they focused on the relationship between bread flavor and microbial flora in dough (Aplevicz et al., 2013; Hansen and Hansen, 1996; Kaseleht et al., 2011). In sourdough bread production, the difference in the type of lactic acid bacteria involved in dough fermentation greatly affected the production of flavor compounds.
Although there are many reports of analyses of the volatile compounds of baked bread, little has been reported on bread dough before baking. Metabolomic analysis at each stage of dough fermentation is necessary to determine when various metabolites are produced. Metabolomic analysis of dough is also expected to lead to a deeper understanding of the metabolism of baker's yeasts in dough. If characteristic metabolite changes of dough are clarified, the optimal timing of the end of fermentation may be more easily identified.
The objective of this study was to investigate the metabolite profiles of dough and develop a deep understanding of dough fermentation by yeast. We conducted a metabolomic analysis of dough during the fermentation process using non-targeted gas chromatography/mass spectrometry (GC/MS)- and nuclear magnetic resonance (NMR)-based metabolic profiling approaches. To the best of our knowledge, this is the first use of metabolomic analysis during dough fermentation. We clarified changes in metabolite profiles with the progress of fermentation. We analyzed dough without punching and dough containing twice the amount of yeast in addition to the standard dough. Punching is an important process in dough development; however, its effect on metabolite profiles is still unknown. To shorten the fermentation time in bread making, it is possible to increase the amount of baker's yeast in the dough. Based on metabolite profiles, we investigated whether the fermentation time is halved when the amount of baker's yeast used is doubled. We also conducted a correlation analysis between the metabolite profiles and the specific volume of breads to determine the correlation between metabolite fluctuation and bread quality.
Preparation of dough and bread To prepare the dough, we mixed 100 g of bread flour (Cameria; Nisshin Flour Milling, Tokyo Japan) with 5 g of sucrose, 2 g of NaCl, 1 g or 2 g of dried yeast (Saf-instant® Yeast Red; Lesaffre, Marcq-en-Baroeul, France), and 68 g of water using a Swanson-type mixer (National Mfg., Lincoln, USA). Fermentations were conducted at 30°C for 5 h, and the punching was done every 1 h. At the end of the fermentation, the dough was sheeted, molded, panned, and then proofed at 38°C for 1 h.
The bread was baked at 200°C for 20 min. The loaf volume and weight were measured the next day with a laser volume measurement unit (Selnac-WinVM2100A; Astex, Tokyo, Japan). Pieces of the dough after mixing were subjected to measurement of gas production. Gas production was monitored every 5 min with a Fermograph II instrument (ATTO, Tokyo, Japan).
Preparation of samples for measurements Control dough (CD), dough without punching (DP), and dough using twice the amount of yeast (DY) were prepared for the measurement of metabolites (Fig. 1). Sampling was performed periodically during the fermentation of each type of dough to prepare samples for measurement. For NMR analysis, dough samples were quickly frozen in the freezer. The frozen dough was then lyophilized. The freeze-dried dough was ground with a mortar and pestle. For GC/MS analysis, 5 g of each dough sample was plunged rapidly into a 20-mL screw-cap glass vial, and then placed in a laboratory oven at 105°C and heated for 210 s to quench the activity of the yeast.
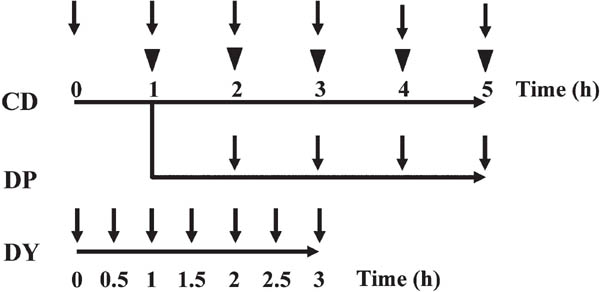
Preparation of dough samples. Sampling scheme of the three types of dough. CD: control dough, DP: dough without punching, DY: dough using twice the amount of yeast. Triangles: punching. Arrows: sampling. CD and DP were sampled hourly. DY was sampled every 30 min.
Detection of water-soluble compounds by NMR NMR analytical samples were prepared as described (Tomita et al., 2015), with modifications. Briefly, 50 mg of the lyophilized dough powder was suspended in 700 µL of 75% methanol and, after vortexing at 25°C for 5 min, the clear supernatant was dried using a centrifugal vacuum evaporator at 30°C for 3 h. The dried residue was dissolved in the same volume of a deuterium oxide (D2O)-based potassium phosphate buffer (KPi) consisting of 100 mM K2HPO4/KH2PO4 (pH 7. 0) in D2O (99.9% D; Cambridge Isotope Laboratories, Andover, USA) containing 1 mM 2,2-dimethyl-2-silapentane-5-sulfonate sodium salt (DSS-d6; Sigma-Aldrich, St. Louis, USA).
After centrifugation, the clear supernatant was used for 1H NMR spectral measurement. NMR spectra were recorded on an Avance-500 spectrometer (Bruker BioSpin, Karlsruhe, Germany) equipped with a carbon/proton CPDUL CryoProbe (Bruker BioSpin) and a SampleJet automatic sample changer (Bruker BioSpin) using the automated software IconNMR (Bruker BioSpin). 1H NMR spectra for metabolomic analysis were acquired at 298 K using the Bruker pulse program zgpr, as previously described (Tomita et al., 2015).
Detection of volatile compounds by GC-MS The volatile compounds present in each dough sample were extracted by headspace solid phase micro-extraction (HS-SPME). A dough sample in a 20-mL vial was pre-incubated for 10 min at 50°C before the volatile compounds were extracted. A SUPELCO 50/30 µm divinylbenzene/carboxen/polydimethylsiloxane fiber (2 cm length; Sigma-Aldrich) was exposed to the headspace of the sample for 20 min at 50°C.
The GC/MS analysis was performed on a GCMS-QP2010 Ultra instrument (Shimadzu, Kyoto, Japan) equipped with an AOC-5000 autosampler (Shimadzu). The volatile compounds absorbed on the SPME fiber were loaded into the GC system in the splitless mode and desorbed at 250°C in the injection port for 5 min. The volatile compounds were separated using a fused silica capillary column (30 m×0.25 mm i.d., 250-µm thickness, DB-5MS; J&W Scientific, Agilent Technologies, Santa Clara, USA).
The oven temperature was increased from 40°C (held for 5 min) to 180°C at a rate of 5°C/min and to 200°C at a rate of 10°C/min, then held for 5 min. Helium was used as the carrier gas at a flow rate of 2 mL/min. Mass spectra were obtained under the following conditions: ionization energy 70 eV; ion source temperature 230°C; interface temperature 250°C; and scan range 33–350 m/z. The retention index was calibrated using the alkane standard solution C6–C20.
The volatile analysis was performed in triplicate for each type of dough independently.
Dataset preparation for non-targeted metabolomics We performed non-targeted NMR-based metabolomics to characterize the dough samples based on their water-soluble metabolite profiles. Prior to the dataset preparation from 1H NMR spectra, we observed that there were no crucial chemical shift fluctuations that would have a significant impact on the data interpretation. To prepare the dataset for a multivariate analysis, we subdivided the processed 1H NMR spectra into 0.04 ppm-wide integral regions (buckets) in the spectral range of 10.0–0.50 ppm. Four buckets containing residual solvent and methanol signals ranging from 4.88 to 4.76 ppm and from 3.36 to 3.32 ppm, respectively, were excluded from the analysis. To correct the difference in concentration between the dough samples, we normalized the buckets to the total intensity of the NMR spectrum of each sample. The generated dataset for NMR-based metabolomics comprised 234 buckets. We used the 234 buckets as explanatory variables of the principal component analysis (PCA).
For the characterization of volatile metabolite profiles by GC/MS-based metabolomics, we prepared a dataset as previously described (Iijima et al., 2016). Briefly, we processed the GC/MS raw data with GCMSsolution software (Shimadzu) and converted them into CDF files. The baseline correction and peak alignment were carried out with MetAlign software (Lommen, 2009), and the convergence of m/z ions for a single compound was achieved with AIoutput software (Tsugawa et al., 2011). We used the 41 compounds listed in Table 1 as explanatory variables of PCA.
| RI* | m/z | Compounds |
|---|---|---|
| 768.3 | 43 | Isobutyl acetate |
| 786.4 | 71 | 3-Methyl-2-buten-1-ol |
| 799.5 | 45 | 2,3-Butanediol |
| 814.0 | 57 | Propyl propionate |
| 817.7 | 207 | Unknown_64 |
| 817.9 | 96 | Unknown_65 |
| 851.4 | 69 | Ethyl crotonate |
| 860.5 | 91 | Ethylbenzene |
| 869.5 | 56 | 1-Hexanol |
| 871.9 | 57 | (E)-2-Hexen-1-ol |
| 879.6 | 43 | 2-Methylbutyl acetate |
| 899.0 | 43 | 2-Heptanone |
| 915.6 | 42 | γ-Butyrolactone |
| 932.6 | 93 | (1S)-(-)-alpha-Pinene |
| 958.4 | 83 | (E)-2-Heptenal |
| 962.1 | 106 | Cinnamyl alcohol |
| 986.1 | 57 | 1-Octen-3-ol |
| 998.3 | 81 | 2-Pentyl furan |
| 1043.3 | 91 | Phenylacetaldehyde |
| 1060.3 | 265 | Unknown_256 |
| 1092.1 | 95 | Unknown_271 |
| 1103.8 | 57 | Nonanal |
| 1110.9 | 91 | 2-Phenylethanol |
| 1119.9 | 82 | Unknown_290 |
| 1128.9 | 341 | Unknown_294 |
| 1129.1 | 155 | Unknown_295 |
| 1146.8 | 95 | (±)-Camphor |
| 1152.6 | 68 | Citronellal |
| 1182.2 | 91 | Methyl phenylacetate |
| 1186.1 | 339 | Unknown_323 |
| 1214.9 | 81 | (E,E)-2,4-Nonadienal |
| 1221.7 | 327 | Unknown_330 |
| 1242.4 | 327 | Unknown_339 |
| 1253.5 | 327 | Unknown_344 |
| 1262.0 | 327 | Unknown_349 |
| 1358.1 | 85 | γ-Nonalactone |
| 1390.9 | 104 | Unknown_379 |
| 1397.3 | 57 | Unknown_383 |
| 1444.7 | 43 | Geranylacetone |
| 1462.2 | 45 | 2-Dodecenal |
| 1673.3 | 195 | Unknown_414 |
Statistical analysis To analyze differences in metabolite profiles among the dough samples, we performed PCA with SIMCA software (ver. 14.0.0. 1359; Umetrics, Umeå, Sweden). We investigated the correlation between metabolite profiles and specific volume by performing orthogonal partial least squares (OPLS) regression, and the generated model was evaluated by leave-one-out cross-validation. To reduce the large influence derived from dominant metabolites, we applied Pareto and unit variance scalings to datasets based on the NMR and GC/MS analyses, respectively. Mean-centering was applied to the specific volume for the OPLS analysis. The SIMCA software automatically selected the optimum number of latent variables.
Determination of succinic acid concentration in dough For the extraction of succinic acid in dough, a portion of the dough sample (1 g) was dissolved in 5 mL of distilled water. After centrifugation at 22 000 g for 10 min, the supernatant was ultrafiltrated with an Ultracel YM-30 column (Millipore, Tokyo, Japan). The succinic acid concentration in the filtrate was analyzed by high-performance liquid chromatography (Shimadzu HPLC LC20AD, Kyoto, Japan) with a UV detector equipped with an Aminex HPX-87H column (Bio-Rad Laboratories, Hercules, USA). Sulfuric acid solution (4 mM) was used as the mobile phase at a constant flow rate of 0.6 mL/min.
Gas production of dough and baked bread To confirm the progress of dough fermentation when the amount of yeast was doubled, the amount of gas generated from the dough was measured. Figure 2 shows the gas production of DP and DY. DY generated almost twice as much gas as DP. To confirm the influence of fermentation length on the specific volume of baked bread, CD and DP were degassed and final proofed at the same timing as the sampling and then baked in an oven. Figure 3 provides a cross-section of the baked bread at each fermentation time (Fig. 3a) and the graph of the specific volume (Fig. 3b). The specific volume of both types of breads was the largest when 1 h of fermentation was used, and then decreased with longer fermentation times.

Gas production during dough fermentation. DP, solid line. DY, broken line. Values are the mean of triplicate experiments.

The specific volume of bread at each fermentation length. a: Cross-section of the breads. b: The specific volume of the breads.
Measurements of water-soluble compounds The water-soluble compounds in the dough were analyzed by 1H NMR. To characterize the dough samples based on the profile of water-soluble compounds, we divided the obtained 1H NMR spectra into 0.04-ppm-wide buckets. We carried out the PCA using the dataset containing all 234 buckets generated from 1H NMR spectra. The score and loading plots are shown in Figure 4. The first and second principal components (PC1 and PC2) accounted for 85.3% and 7.0% of the total variance, respectively.

PCA results for the water-soluble compounds profile. a: Score plot. Labels represent the fermentation length of the dough. b: Loading plot. Labels represent the central chemical shifts (ppm) of integral 0.04-ppm-wide buckets.
In the score plot, PC1 was strongly dependent on the fermentation time (Fig. 4a). The loading plot showed that PC1 was primarily explained by the different levels of 3.46 ppm and 3.7 ppm (predominantly glucose signal), which is sucrose hydrolysate and the substrate for fermentation, and 3.62 ppm (predominantly glycerol signal) (Fig. 4b). The glucose signal decreases with fermentation time (Fig. 5a), and the glycerol signal increases (Fig. 5b). Thus, PC1 is associated with the length of the fermentation time. Because the contribution of PC1 is very large, the majority of metabolite variation can be explained by the length of fermentation time.

Changes in the levels of the water-soluble compounds in the doughs during the fermentation process. Relative intensity of 3.46 ppm (glucose signal), 3.62 ppm (glycerol signal), and 5.42 ppm (maltose signal) were shown in panel a, b, and c, respectively. Values are mean±SD of triplicate experiments.
The PCA revealed that the dough containing twice the amount of yeast was similar to that which doubled the fermentation time of control dough. As for water-soluble compounds, when the amount of yeast in the dough was doubled, the progress of fermentation almost doubled. This is consistent with the result of gas production (Fig. 2). However, there was a slight difference in metabolites. In the loading plot, the level of 5.42 ppm (predominantly maltose signal) showed a significant contribution to PC2. The maltose signal decreases after increasing at the early stage of fermentation (Fig. 5c). Succinic acid (2.38 ppm) was one of the metabolites characterizing the dough containing twice as much yeast. The measurement by HPLC revealed that the dough with twice the amount of yeast contained approx. 1.4 times more succinic acid than the control dough after 3-h fermentation (Fig. 6).

Changes in the amount of succinic acid in the doughs during the fermentation process. Succinic acid was extracted from each type of dough and measured by HPLC. Values are mean±SD of triplicate experiments.
In our comparison of the dough without punching and the control dough, both samples were plotted at almost the same position on the graph (Fig. 4a), indicating that the use of punching had little effect on the dominant water-soluble compounds. Although it is thought that yeasts are activated by the oxygen supply when punching, this phenomenon was hardly observed in this study.
Measurements of volatile compounds Before the analysis of volatile compounds in the dough, we determined the quenching conditions. The yeast reaction was quenched by heating at 105°C. Various heating times were assessed and compared with an unquenched sample. Fermentation of the dough in the vial stopped with heating at ≥210 s. Our comparison of the metabolomic profiles of samples heated for 210 s and those of the untreated samples revealed that there was hardly any change in our analytical conditions (data not shown). On the other hand, slight browning was observed in the dough heated for ≥300 s. We therefore selected 210 s as the heating time for the quenching of the dough.
The volatile compounds in the dough were analyzed by GC/MS. After the peak detection and alignment by MetAlign software, the data were annotated using AIoutput software. We carried out the PCA using the dataset generated from AIoutput software, except for the compounds derived from the SPME fiber used. The score and loading plots are shown in Figure 6. PC1 and PC2 accounted for 26.9% and 19.2% of the total variance, respectively.
In the score plot, PC1 was dependent on the fermentation time (Fig. 7a). The loading plot showed that PC1 was primarily explained by the different levels of 2-methylbutyl acetate and 2-phenylethanol (Fig. 7b). These compounds increased with the progress of fermentation (Fig. 8ab). On the other hand, ethylbenzene decreased with the fermentation time (Fig. 8c). Thus, PC1 is associated with the length of fermentation time.

PCA result for the volatile compounds profile. a: Score plot. Labels represent the fermentation length of the dough. b: Loading plot.

Changes in the levels of the volatile compounds in the doughs during the fermentation process. Relative intensity of 2-methylbutyl acetate, 2-phenylethanol, and ethylbenzene were shown in panel a, b, and c, respectively. Values are mean±SD of triplicate experiments.
PC2 largely divided the samples into two classes, showing the difference of yeast amounts. The loading plot showed that PC2 was primarily explained by the different levels of unknown compounds. There was no notable difference in the dough profile at the beginning of the fermentation; however, the difference in relation to the amount of yeast became large when the fermentation took >2 h.
Multivariate analysis to determine the correlation between metabolite profile and specific volume The OPLS regression was carried out to determine the correlation between the metabolite profile of the dough and the specific volume of baked bread. If a metabolite correlated with the specific volume can be identified, the status of fermentation can be judged by measuring the metabolite. In this study, the volatile compound profiles were used for the OPLS regression to monitor the dough fermentation without sampling the dough. For the volatile compound profiles, the generated OPLS model was comprised of two latent variables, which explained a cumulative 37.6% of the total variance (Fig. 9a). The cumulative determination coefficient (R2) and cumulative cross-validation determination coefficient (Q2) were 0.772 and 0.612, respectively.

OPLS regression results for the correlation between the volatile metabolite profile of the dough and the specific volume of baked bread. a: Observed vs. predicted plot of the specific volume. b: Metabolites with a VIP score of ≥1 are shown.
The variance importance for the projection (VIP) scores showed that γ-nonalactone was the most important for the OPLS model (Fig. 9b). Citronellal, unknown_383, and (E,E)-2,4-nonadienal also contributed to the OPLS model after γ-nonalactone. These metabolites showed a positive correlation with specific volume. γ-Nonalactone exhibited a high positive correlation with the specific volume, showing a R2 value of 0.286.
Baker's yeast (Saccharomyces cerevisiae) is very important for making bread. The flavor of bread differs depending on the strain of baker's yeast, the amount of yeast used, and the length of fermentation time. However, it is still unclear how flavor compounds are produced in the fermentation process. In this study, to clarify the fate of the metabolic products in the fermentation process, we comprehensively analyzed the metabolites contained in the dough at each fermentation stage. The PCA revealed the characteristics among dough samples contributed by the dominant metabolites produced by the yeasts. The results of the PCA demonstrated that the variation of the metabolites in the dough greatly depends on the fermentation length and the yeast amount, and the importance of baker's yeast in the fermentation of dough can be reconfirmed.
Because PC1 of the profiles for both the water-soluble compounds and the volatile compounds indicates the fermentation length, the metabolite profiles of the dough largely depend on the fermentation length. One of the factors in PC1 is the consumption of sugar, amino acids, etc. by the yeast. The ethanol in dough is produced by yeast fermentation of the sugar; however, in this study, the ethanol was excluded from the measurement because it exceeded the upper limit of quantitation. Except for ethanol, an increase in glycerol associated with fermentation time was observed. This observation is consistent with the report by Aslankoohi et al. (2015), who reported that glycerol is important for not only the stress tolerance of yeasts but also gas retention in the dough.
During the fermentation of the dough, we observed an increase in succinic acid when the amount of baker's yeast was doubled. Wine yeast (S. cerevisiae) produced succinic acid under microaerobic conditions (Aceituno et al., 2012). Succinic acid is hardly produced under anaerobic conditions; however, its production is reduced even under conditions of too much oxygen. The initial concentration of oxygen in the dough is high due to vigorous mixing. As the concentration of yeast increases, dissolved oxygen decreases due to its consumption by the yeast, and as a result, succinic acid may have been produced. Succinic acid is one of the major pH-determining metabolites produced by yeast during dough fermentation (Jayaram et al., 2013). Succinic acid has also been reported to enhance dough development (Jayaram et al., 2014a). In addition, as the amount of yeast used increases, the amount of ethanol in the dough increases. Ethanol also greatly affects the physical properties of dough (Jayaram et al., 2014b). Thus, increasing the amount of yeast not only increases the gas generation but also the possibility that dough formation may be accelerated by increases in succinic acid and ethanol.
Our NMR analysis revealed that punching had little effect on the profile of the water-soluble compounds detected in this study. Although punching is important for dough formation, its effect on yeast activity may be somewhat limited. In contrast, the volatile compounds were slightly affected by punching. Although a portion of the volatile compounds has the potential to be released with carbon dioxide by punching, the difference in profiles is considered to be due to the effect of increased carbon dioxide, because many of the volatile compounds hardly changed with punching.
The OPLS regression identified metabolites that were correlated with the specific volume of bread. The metabolite with the highest contribution to the correlation was γ-nonalactone. Loscos et al. reported that wine yeast (S. cerevisiae) produced γ-nonalactone during the fermentation (Loscos et al., 2007). It is thought that baker's yeast produces γ-nonalactone in the dough, as it is also increased in dough by fermentation. γ-Nonalactone has a coconut-like flavor and is one of the odorants of wheat bread crumb (Cho and Peterson, 2010).
(E,E)-2,4-nonadienal has been detected from both bread crust and crumb (Cho and Peterson, 2010); in the bread crumb, the flavor dilution factor of (E,E)-2,4-nonadienal was the fifth largest value. It is very interesting that the stage at which one of the main odorants of bread increases was also characterized by the largest specific volume of bread. The compound citronellal is also correlated with the specific volume and is known to have a floral-type flavor. Citronellal was transiently increased in the early stage of fermentation in the culture of baker's yeast and then decreased by conversion to citronellol (Young and Ward, 1991). In the present study, the fluctuation of citronellal in the dough resembled citronellal fluctuation in the culture of baker's yeast.
It is highly unlikely that the metabolites correlated with the specific volume of bread directly affect the swelling of bread, probably because the increase and decrease in these metabolites matches the observed changes in the specific volume of bread. However, these metabolites may be criteria for the progress of fermentation. Real-time monitoring of these metabolites from the dough may make it possible to finish the dough fermentation optimally. That is, an understanding of the variations in metabolites during fermentation is essential if bread quality is to be improved by fermentation monitoring.
In bread, more than 540 volatile compounds such as alcohols, aldehydes, esters, ketones, and acids have been reported (Cho and Peterson, 2010). Baking is one of the reasons that bread contains so many volatile compounds. Because the baking of the dough causes chemical reactions such as the Maillard reaction, various compounds are formed in the baked bread. Baked bread has a complicated profile of flavor compounds, and we note that the profile of the dough before baking is simpler and the effect of baker's yeast is easier to observe. Because changes in flavor are dependent on the strain of baker's yeast, the metabolomic analysis of the dough is a good tool to observe the yeast characteristics.
It is of interest whether there is a correlation between the metabolic profile of the dough and that of the baked bread. Once these correlations are found, it may be possible to control the metabolite profile and flavor of the baked bread by fermentation regulation. Investigation of the correlation between the metabolic profile of the dough and the palatability of the baked bread is an issue for the future.
Acknowledgements This work was supported by a grant to T. Nakamura and K. Saito from the Ministry of Agriculture, Forestry and Fisheries of Japan, within the project “The special scheme to deploy highly advanced technology for agriculture, forestry and fisheries.” We thank M. Tsuta, Y. Sekiyama, and M. Ohnishi-Kameyama for their valuable advice. The NMR measurement was carried out with the support of the Advanced Analysis Center at National Agriculture and Food Research Organization (Tsukuba, Japan)