Methods
Cassava Starch Acid Modification The acid solutions were prepared with analytical degree reagents. 1.0 liter of solutions was prepared in the concentrations of 5 %, 10 % and 15 % of lactic, acetic and citric acid. 150 g of cassava starch were dissolved in 300 mL of acid solution corresponding to each treatment. The system was stirred without heating for 6 hours/28 °C ± 2 °C. Subsequently, the modified starch was dried at 50 °C for 12 hours and crushed through semi-industrial crusher and 20 mesh of granulometry.
Swelling Power and Solubility Index Swelling power (SP) and solubility index (SOL) were determined using the method of Wang et al., (2010). Starch dispersions were centrifuged and heated in a water bath at temperatures of 90 °C for 5 min. The average heating rate as recorded by thermocouples placed in tubes was 18 °C/min. After heating, samples were centrifuged (6000 rpm, 25 min). The precipitated paste was separated from the supernatant and weighed (Wp), with 86.0 % starch of dry base. Both phases were dried at 105 °C for 12 h and the weight of dry solids in precipitated paste (Wps) and supernatant (Ws) were calculated. SP is the ratio of the weight of swollen starch granules after centrifugation (g) to their dry mass (g), was calculate according to equations 1 and 2.
The SOL is the percentage of soluble dry mass in the supernatant (Ws) to the dry mass of starch sample (W0).
Steady state characterization Steady flow measurements were carried out using an AR2000 rheometer (TA Instruments, New Castle, DE) with cone and plate geometry (60 mm disc, 4° angle) on the samples to obtain shear rate versus shear stress (flow curves) data. The starches were diluted in 50 mL of distilled water, forming a suspension. Shear rate from 0.1 to 350 s−1. Data from the samples was used to estimate the fit of this data to the power law (Eq.3), Herschel-Bulkley (HB) model, Newtonian (Eq.4) and Bingham (Eq.5) model using the following equations:
Where σ is the shear stress (Pa), σ0 is yield stress (Pa), γ is the shear rate (s−1), K is the consistency coefficient (Pa sn), and n is the flow behavior index (dimensionless).
Thermal Analysis Thermogravimetric analysis (STA 6000, PerkinElmer Instruments model, USA) of starches was carried out to access the thermal stability of samples under nitrogen flow of 20 mL.min−1. The samples were heated from 30 to 900 °C with a heating hate of 10 °C min−1.
Scanning electron microscopy (SEM) Samples were dried in a freezer dryer (Christ, Alpha 2–4 LD plus, Germany) for 48 h to convert starch solutions into solid ones which is the most suitable form of samples for SEM analysis. Starch surface samples was observed using FEI Inspect S50 Scanning Electron Microscope (FEI, Czech Republic), an accelerate voltage of 7 kV and 10 kV was used, system pressures were 80 Pa and 100 Pa. The samples were deposited on carbon tapes and coated with gold, using vapor deposition techniques. The samples were scanned using a magnification between 5.000 and 40.000×.
Statistical Analysis Results are expressed as the mean ± standard deviation of triplicate experiments. Data were analyzed by analysis of variance, followed by Tukey's test using STATISTICA 9.0 (Statsoft Inc. OK, USA). A value of p < 0.05 was considered statistically significant. The rheological data was analyzed through Origin 9.1 software (OriginLab, Massachusetts, U.S.A.).
Results and Discussion
Table 2 shows the Starch Swelling Power and Solubility Index.
Table 2.
Physicochemical properties of starches.
| Samples |
Swelling power |
Solubility index |
|
28 °C |
90 °C |
28 °C |
90 °C |
| NCS |
1.18 ± 0.22 |
13.99 ± 0.77 |
1.01 ± 0.08 |
12.33 ± 0.12 |
| LA5 |
0.60c ± 0.13 |
48.71a ± 2.10 |
0.31c ± 0.09 |
33.88a ± 0.28 |
| LA10 |
1.61b ± 0.21 |
19.20b ± 1.99 |
1.58b ± 0.21 |
16.08b ± 0.40 |
| LA15 |
3.49a ± 0.15 |
16.58c ± 1.90 |
3.37a ± 0.14 |
13.22c ± 0.09 |
| AC5 |
0.94c ± 0.10 |
16.44c ± 0.40 |
0.62c ± 0.05 |
32.76a ± 0.12 |
| AC10 |
1.82b ± 0.12 |
18.17b ± 0.32 |
2.52b ± 0.09 |
14.34b ± 0.09 |
| AC15 |
2.25a ± 0.04 |
20.15a ± 0.39 |
3.54a ± 0.12 |
12.30c ± 0.10 |
| CA5 |
3.48c ± 0.08 |
14.65c ± 0.81 |
0.38c ± 0.05 |
35.28a ± 0.09 |
| CA10 |
6.05b ± 0.11 |
18.46b ± 0.67 |
1.10b ± 0.08 |
15.77b ± 0.15 |
| CA15 |
18.04a ± 0.18 |
20.30a ± 0.39 |
2.99a ± 0.15 |
13.23c ± 0.12 |
Means in a column not sharing a common superscript are significantly different at p < 0.05.
As shown in Table 2, for all the starches samples, the SP increased as the temperature and acid concentration increased, however, at a 90 °C, the SP of modified starch samples was decreased with the increase of acid concentration. The SOL was increased with the acid concentration at 28 °C and, decreased at 90 °C with the acid concentration; however, the values are above at 28 °C.
Kusumayanti et al., (2015) found the SP of 13.80 to cassava flour and 3.02 % of SOL. Klein et al., (2013) reported 29.11 and 25.66 % respectively at 100 °C.
These results indicate that the acids may alter the associations between amylose and amylopectin and each component with itself in the starch granules, thus preventing starch granules from swelling (Xie and Liu, 2004). According to Kumoro, et al. (2012) greater swelling power shows harmonious with higher solubility. However, there is no direct correlation between swelling and solubility that could be observed (Chan et al., 2009).
Differences in swelling and solubility profiles indicate difference in the bonding forces within the starch granules. These bonds relax with increase in thermal agitation causing the starch granules to absorb water, swell, and the low molecular weight amylose solubilize and leach out into the aqueous medium (Balagopalan et al., 1988).
Fig. 1 presents the flow curve of native and modified starches.
The NCS rheological behavior was pseudoplastic (n = 0.89) and presented the thixotropic behavior, confirmed to the presence of hysteresis in figure 1a. Starch pastes belong to non-Newtonian liquids of either thixotropic or antithixotropic properties (Dewar and Joyce, 2006). Thixotropy is considered as a property associated with the rheoinstability of gels and pastes of starch (Sikora et al., 2011).
All of the starch modified with lactic and acetic, and citric 15 % presented pseudoplastic behavior, with values of the behavior index (n) below 1.00, and exhibited shear-thinning behavior. The apparent viscosity decreases with the increase of shear rate and acid solution concentration. In this way, since as the acidic character of the medium increases, the starch structure is altered with weaker chemical bonds, decreasing its flow resistance. However, since they required an initial shear stress to flow, therefore, are characterized by the Herschel-Bulkley model. The citric acid treatment 5 % and 10 %, added in suspension, obtained a rheological model of the Bingham plastic.
According to Bhandari et al., (2002), shear-thinning behavior, in which the material behaves as a gel or very viscous liquid at rest or when subjected to mild shear but flows freely when subjected to a larger shear, is a very desirable and crucial rheological property in typical food processing procedures. For example, shear-thinning behavior is shown by some jams and ketchups that become temporarily fluid when shaken or stirred. This behavior is beneficial because it prevents in-can settling and sagging and provides sufficient film build-up and suitable brush or roller drag without brush marks. The acetic acid effect above the rheological behavior of starch was more intense in 10 % and 15 % of solution where there was a direct influence on the yield stress (σ0). In this way, it was possible to infer that the addition of the acids initiates a process of gelatinization of the starches.
The rheological properties of starch have been investigated by many researchers. Chen and Ramaswamy (1999) investigated the effects of temperature, pH value, and cooking time on the rheological property parameters (consistency index (K) and flow behavior index (n)) of tapioca starch using a second order composite design. They found that the power law, Herschel–Bulkley and Casson model well described the flow behavior of tapioca starch. Nwokocha et al., (2009) found the Herschel-Bulkley behavior of cassava starch. Alfano et al., (2017) reported Bingham behavior to emulsions processed with waxy corn starch..
The Table 3 presents the Power Law Rheological Parameters of modified starches.
Table 3.
Rheological Parameters of starches.
| Rheological Parameters |
| Samples |
σ0 (Pa) |
K (Pa.sn) |
n (-) |
R2 |
Model |
| NCS |
0.357 ± 0.03 |
0.0204 ± 0.08 |
1.00 ± 0.00 |
0.9930 |
Pseudoplastic |
| LA5 |
15.71a ± 0.12 |
12.57a ± 0.04 |
0.18a ± 0.01 |
0.9485 |
HB |
| LA10 |
13.97b ± 0.10 |
11.05b ± 0.06 |
0.15b ± 0.01 |
0.9760 |
HB |
| LA15 |
9.36c ± 0.11 |
6.56c ± 0.08 |
0.11c ± 0.01 |
0.9905 |
HB |
| AC5 |
18.13a ± 0.09 |
15.73a ± 0.04 |
0.20a ± 0.01 |
0.9907 |
HB |
| AC10 |
8.96b ± 0.08 |
5.94b ± 0.06 |
0.16b ± 0.01 |
0.9770 |
HB |
| AC15 |
5.55c ± 0.09 |
3.45c ± 0.09 |
0.12c ± 0.01 |
0.9289 |
HB |
| CA5 |
4.53b ± 0.10 |
0.0056c ± 0.03 |
1.00a ± 0.01 |
0.9610 |
Bingham |
| CA10 |
10.37a ± 0.12 |
0.0128b ± 0.04 |
1.00a ± 0.01 |
0.9849 |
Bingham |
| CA15 |
0.680c ± 0.03 |
0.153a ± 0.08 |
0.45b ± 0.01 |
0.9947 |
Pseudoplastic |
Means in a column, for each acid treatment, not sharing a common superscript are significantly different at p < 0.05. HB = Herschel-Bulkley model.
There was a significant difference between the yield shear stress required for the fluid flow between the different treatments. Starches presented reduction in viscosities in greater amount acid solutions; this behavior can be explained by the acid attack to the starch structure during the contact time and promoting the amylose and amylopectin chains destabilization, resulting in the viscosity reduction. According Zhang et al., (2016) the viscosity of acid-hydrolyzed starch is much lower than that of native starch, however, an exception was observed to citric acid treatment, where there was increase in starches viscosity.
The viscosity reduction can be attributed to the amylopectin chains were largely affected by acids treatments, which generated linear starch chains and fragmentation of amylose chains.
Citric acid provided different rheological models of native starch and those treated with acetic and lactic acid, likely due to its carbon chain, where the phenomenon is not fully elucidated. Therefore, the treatments with lactic and acetic acid did not modify the rheological model of cassava starch.
The data presented in the Table 1 indicated that the acid concentration increasing resulted in a decrease on flow behavior and consistency index. This is mainly attributed to the lower hydrodynamic interactions and to the restricted chains flow in dilutes and concentrates solutions (Martínez et al., 2010).
According to Che et al., the starches suspensions flow behavior were described by the power-law model, which applies to treatments with lactic acid, acetic acid and those treated with 15 % citric acid.
Monroy, Rivero and García (2018) found the power law rheological models for starches modified through ultrasound treatments.
These authors obtained the shear-thinning behavior with yield value to the cassava starch modified by enzyme. Che et al. found the same behavior for dilute aqueous solutions of cassava starch.
The thermal stability of modified starches was determined using thermo-gravimetric analysis. The TG/DTG curves showed weight loss with increase in temperature (Fig.2 a,b,c).
The starches showed three main mass loss (Δm) events; the first event as related to dehydration, with a corresponding endothermic peak in DTG curve. It was verified that the weight loss varied between 5.18 and 10.59 % for all starches tested which was lower than the maximum value of 14 % recommended by Brazilian legislation for commercial starches (Brazil, 1978). After the volatile compounds loss (first event) it was possible to observe a stability step for all the samples.
The second event represents the starch depolymerization and the last rage represents the polymer backbone degradation and decomposition, according Namazi and Dadkha (2010). TGA curves of modified starches were similar. However, its possible to perceive thermal variations in some decomposition reactions. The depolymerisation initiated earlier in citric acid starch modified in comparison with other starches. According Mukurumbira et al., this can be attributed to the presence of sulphate groups on the starch surface which catalyze depolymerisation reaction.
As show in Fig.2 LA's starches began to decompose near to 200–250 °C, however, the LA15 presented greater decomposition than the others in this period. In the 300–350 °C the decomposition rate was the highest for lactic acid starches, with 10 % remaining material at 650 °C.
This behavior can be explained because after oxidation of acid hydrolysis, the double helix structure was destroyed and the initial pyrolysis temperature decrease (Zuo et al., 2017). The LA15 decomposition at lower temperatures shows the influence of lactic acid on its structure, followed by LA10 and after LA5, which can be verified by DTG, where the LA15 sample has a smaller area in the region between 300–350 °C.
The use of citric and lactic acid reduced the thermal stability of the modified starches when compared to the native starch, due to destabilization in the amylose and amylopectin chains by acids, reducing the molecular size of starches.
Similar behavior was found by Chen et al. the third stage of acid starch decomposition finished at 600 °C. This region was termed “glowing combustion”, which produced gases (CO, CO2, and H2O) due to the reactions of carbonaceous residues with oxygen.
Fig. 3c. shows the DTG analysis for the starches treated by citric acid. It's possible to observe that the sample CA5 presents greater degradation in temperatures higher than 300 °C when compared to the other samples. The difference between citric acid and the others is that it has three ionizable hydrogens, that is, whereas lactic and acetic acid contains one.
Thermal behavior of starch is mainly influenced by the length of the acid/alkyl chains whereas the amylose/amylopectin ratio has no significant effect (Vanmarcke et al., 2017). The structure is closely associated with the functional properties of starch, and this may be reflected by the various chains distribution. Generally, the longer chains facilitate interactions between starch molecules in solution, while the shorter chains can interfere with such interactions, affecting starch functionality (Bertoft et al., 2016).
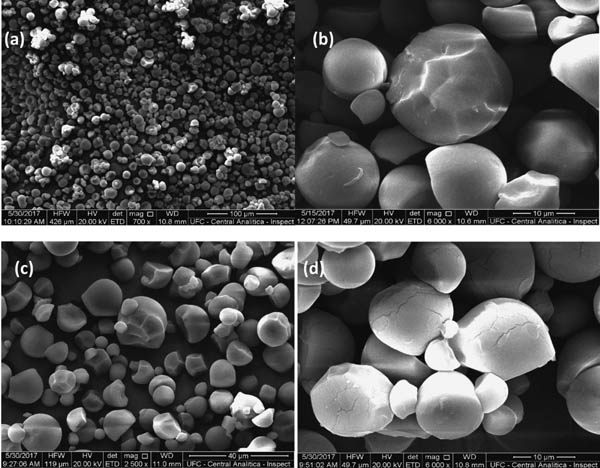
Thermal properties alteration is indicative of the cassava starch chemical modification by lactic acid, as evidenced through SEM presented in Fig. 4. that show the morphology of the NCS, and modified cassava starch by lactic, acetic and citric acid.
Cassava starch had both polygonal and spherical-shaped granules, as shown in the figure above, the morphology of lactic, acetic and citric acid modified cassava starch was very similar to that of the natural starch granules which means that the reaction did not affect the morphology of the granules in acid solutions up to 10 %. A similar result was obtained by Ma et al. It can be clearly seen that the sizes of external cavities
Fig. 4. indicates that lactic and acetic acid had a strong effect on the starch granules surface, while the citric acid did not change of starch surface strongly, causing increased of porosity. Lactic and acetic acids present highest values of acid dissociation constant (pKa equals to 3.85 and 4.77, respectively), they have the ability to release more protons into the medium and, consequently, more clearly alter the structure of the starch. The efficiency of acid hydrolysis at the granule level could be influenced by the porosity of starch granules (Huber and BeMiller).
In this way, it was verified that its possible to promote the expansion of cassava starch using acetic and citric acid, however, the extension of the study to find the reasons and how to optimize this expansion with the combination of other methods becomes necessary.
Acknowledgments The authors acknowledge the technical support for this work from Embrapa Agroindústria Tropical, Federal University of Ceara, FUNCAP, and Central Analítica-UFC/CT-INFRA/MCTI-SISNANO/Pró-Equipamentos CAPES.