Original papers
Effects of Drying Process with Different Temperature on the Nutritional Qualities of Walnut (Juglans regia L.)
2019 Volume 25 Issue 2 Pages 167-177
Details
2019 Volume 25 Issue 2 Pages 167-177
The chemical compositions, fatty acids, total flavonoids content (TFC), total polyphenols content (TPC), and minerals of walnuts were investigated after freeze drying (−55 °C) and heat drying (60 °C, 105 °C, 140 °C) process. The results showed that the contents of protein, soluble sugar, minerals (except for Mn), and carbohydrate were increased with the rise of temperature from −55 °C to 105 °C. Linoleic acid and oleic acid could be detected as the main fatty acids, with the highest contents were also observed at 105 °C (309.0 mg/g and 79.6 mg/g). However, the TFC and TPC were notably increased by 36.9% and 33.9% in kernel when the temperature was increased from −55 °C to 140 °C. In general, the freeze drying and heating drying had an inhibition effect and irritation effect on the nutritional qualities of walnuts, respectively. Therefore, heating treatment could significantly improve the nutritional qualities of walnut, and the recommended temperature for walnut drying was 105 °C.
The industry of nut production has been developing rapidly in recent years. Nut is recommended as part of a healthy diet due to their beneficial nutritional profile consisting of unsaturated fatty acids, tocopherols, polyphenols, phytosterols and flavonoids (Bolling et al., 2011). The health benefits of nut consumptions are associated with preventing the cardiovascular diseases, colon cancer, coronary heart disease, and type II diabetes (Grace et al., 2014). The health-related properties of nut are influenced by the cultivar and its growing conditions. The nutritional values of different cultivars of walnut from Spain were various (Tapia et al., 2013). The results from three regions (north, dry coast, south) of Chile were also presented the effects of growing condition on the contents of minerals in pine nut, in which the contents of Cu, K, Na located in the north Chile doubled those in the dry coast (Lutz et al., 2017). In addition, the nutrient compositions of nuts are also associated with the harvest season (Lynch, et al., 2016) and environmental conditions (temperature) (Amaral et al., 2005). The previous studies indicated that nuts cultivated in region with lower mean maximum annual temperature would exhibit higher contents of unsaturated fatty acids (palmitic, oleic and linoleic acids) and phytosterols (β-sitosterol) (Fuentealba et al., 2017). The above-mentioned factors were covered the preharvest period of walnut. However, during the postharvest period, temperature becomes one of the key factors, which could have important effects on the health-related properties of nuts.
Roasting is one of the main cooking method that applied for nuts, which could lead to various physicochemical changes. Many previous works investigated the effects of roasting treatment on the nutritional qualities of hazelnuts (Manzo et al., 2017), almonds (Agila and Barringer, 2012), pistachios (Hojjati et al., 2013), Brazilian nuts (Ozcan et al., 2018), and walnuts (Schlormann et al., 2015). The roasting treatment resulted in the changes of microstructural and chemical compounds, such as moisture content reducing (Aljuhaimi et al., 2017b), total polyphenols and flavonoids increased (Lerma-Herrera et al., 2017), and fatty acid content changed (Ozcan et al., 2018). Some studies also showed that roasting was related to the formation of special taste and aroma as well as the brittleness of nuts (Hojjati et al., 2013).
Walnut is one of the important tree nuts in the world. The industry of walnut production has been developing rapidly in China in recent years, ranking first in the yield of walnut globally (Han et al., 2018). However, the roasted walnut is not a typical way to eat in China and some other countries. Walnut is often subjected to thermal treatment to reduce the moisture content, and then packed for sell or further processed into other productions. The differences between roasting and thermal treatment include the heating temperature, duration and operation. The roasting process is carried out by commercial electrical oven and microwave (Manzo et al., 2017; Aljuhaimi and Ozcan, 2018). The typical roasting conditions ranged from minimum 140 °C/25 min to 160 °C/15 min for almonds, pistachios and macadamia and up to 176 °C/10 min for pecan, which approximately reflect the minimum and maximum range of roasting temperatures and time periods used for industrial roasting of nuts (Stuetz et al., 2017; Magnuson et al., 2016). Compared with the roasting process, the thermal treatment of walnut in China is often carried out by sunlight or air oven, with a relative lower temperature (< 140 °C) and longer time (> 30 min). Recent studies supported that heating treatment (from 70 °C to 110 °C) had significant influence on moisture, fat content, fatty acid composition, and polyphenols compounds of pecan kernel (Aljuhaimi et al., 2017b). Except heating treatment, freeze drying is now widely used in fruits, vegetables and nuts, which is a dehydration process typically used to make the material more convenient for transport. Freeze drying would keep fruits and vegetables as much fresher as possible nutritional value practically unchanged (Storey and Anderson, 2018; Eisinaite et al., 2016). However, as far as we know, there is no research focus on the changes of nutrients in walnut after freeze drying.
The aim of this study was to evaluate the influence of different heating temperature treatment (60 °C, 105 °C, 140 °C) on nutrient qualities of walnut. Moreover, we also want to know that if freeze drying treatment (−55 °C) has less effect on nutritional qualities of walnut than the heating treatment.
Chemicals A Milli-Q-Plus water purification system from Millipore (Milford, MA, USA) was used throughout the study to obtain the ultrapure water for the analyses. GC-grade 2, 2, 4-trimethylpentane and methanol were obtained from Merck (Darmstadt, Germany). Folin-Ciocalteau and 37-component fatty acid methyl esters (FAMEs) mixture (No.47885-U) were purchased from Sigma (St. Louis, MO, USA). Other solvents were of analytical grade and were purchased from Shanghai GuoYao Chemical Reagents (Shanghai, China).
Sample preparation and drying About 5 kg fresh walnut (Juglans regia L.) was purchased at a local supermarket in Hangzhou, Zhejiang province, China. The samples were stored at 4 °C until analysis.
The walnut samples were dried as without the shell in a drying oven at 60 °C, 105 °C, 140 °C; and in a lyophilizer (Thermo Biofuge Stratos) at −55 °C until a constant weight was achieved. Each drying protocol was carried out three times. The samples were weighed every 3 min (140 °C), 20 min (105 °C), 1 h (60 °C) and 4 h (−55 °C), in order to obtain the drying kinetics curves of walnut. According to the previous study (Nawirska, et al., 2009), the variations in the moisture ratio MR occurring at drying time τ were established in terms of the modified formula:
 |
where M(τ) is walnut moisture content after drying time τ, Me denotes equilibrium moisture content, and M0 stands for initial moisture.
For each drying cycle, temperature were measured every 30 s during the drying process using a contact digital electronic thermometer HT-9815 (Xintai instrument Co., Ltd., Guangdong province, China). In order to obtain the temperature profile in the walnut kernel core during the drying process, three sensors were inserted into three samples. The heated and frozen samples were separately ground into powder with a grinder before analysis.
Chemical composition Moisture, fat, protein, soluble sugar, and carbohydrate content of walnut samples were determined according to AOAC procedures (AOAC 2000). Moisture content of kernel was measured after the sample preparation. Fat content was extracted by Soxhlet apparatus for 10 h (with petroleum ether), and the solvent was evaporated using rotary vacuum evaporator at 40 °C. Oil was stored at −20 °C in brown bottle until GC analysis. The quantity of protein was calculated by multiplying the nitrogen content, determined using the Kjeldahl method, by the coefficient 6.25 (AOAC 2000).
For soluble sugar analysis, 0.5 g kernel of homogenate and 10 mL ethanol/water (8:2, v/v) were placed in a 25 mL colorimetric tube, heated in water at 80 °C for 30 min. Supernatant was transferred to 25 mL tube and added 5 mL ethanol/water (8:2, v/v). This process was repeated three times. Supernatants were combined and brought to 25 mL with deionized water. The supernatant was diluted to 25 mL (diluted 25 times) for soluble sugar analysis. The extracted kernel and 10 mL 3 M HCl were mixed in a 25 mL volumetric flask, and heated in boiling water for 40 min. After cooling, the solution was neutralized with 10 mL 3 M NaOH and brought to 25 mL with deionized water. Finally, the solution was diluted to 25 mL (diluted 25 times) for carbohydrate analysis. 2.5 mL diluted solutions (soluble sugar and carbohydrate) were carefully measured and transferred to 10 mL colorimetric tube, and added 6.5 mL anthrone in freezing water. The mixture was heated in boiling water for 10 min. After cooling, the soluble sugar and carbohydrate were measured at 620 nm in an Optizen Pop UV/Vis spectrophotometer (Perkin Elmer, USA). Blank sample of glucose was used as a reference in spectrophotometric analysis. A standard curve was prepared and the results were expressed as g glucose equivalent/g sample (%).
Fatty acid composition 100 µL oil samples mixed with 4 mL 2, 2, 4-trimethylpentane in 25 mL colorimetric tubes was vortexed for 1 min; then, the samples added to 200 µL 2 M KOH in methanol at room temperature and vortexed for 1 min. Finally, the mixture added about 1 g sodium bisulfate monohydrate to remove the moisture, and the fatty acid methyl esters (FAMEs) were analyzed using in an Agilent 7890A gas chromatography (Agilent Technologies, Palo Alto, California, USA) equipped with a flame ionisation detector (GC-FID), a PAL3 autosampler (Agilent Technologies, Santa Clara, CA, USA) and an HP-INNOWAX fused silica capillary (30 m × 0.25 mm × 0.25 µm) column (Sigma Chemical Co., St. Louis, MO, USA). Walnut FAMEs was injected at 220 °C with an injector volume of 1 µL. The oven temperature was programmed from an initial value of 140 °C (1 min hold) to 250 °C at 4 °C/min (5 min hold). The detector temperature was operated at 220 °C. Nitrogen was used as a carrier gas at a constant flow rate of 1.5 mL/min. Fatty acids were quantified by the external standard calibration method. The results were performed as mg of fatty acid per g of walnut fresh weight and in relative percentage of each fatty acid.
Total flavonoids and total polyphenols content 1.0 g of oil-free and milled samples was added to 10 mL of mixture of ethanol: water (70:30, v/v). The mixture was kept in ultrasonic water-bath for 30 h at room temperature, followed by centrifugation at 8000 rpm for 5 min. The supernatant was diluted 10 times. 0.5 mL of diluent was mixed with 0.5 mL 5% sodium nitrite (NaNO2, w/ v), kept in the room temperature for 5 min. Then the mixture was added 5% 0.5 mL of aluminum nitrate (Al(NO3)3, w/v), kept it in the room temperature for 5 min. Finally, the mixture was added 2 mL 2 M sodium hydroxide (NaOH) and the TFC was measured at 510 nm in an Optizen Pop UV/Vis spectrophotometer (Perkin Elmer, USA). Blank sample of rutin was used as a reference in spectrophotometric analysis. A standard curve was prepared and the results were expressed as mg rutin equivalent/g sample.
1 mL above mentioned diluent (diluted 10 times) was mixed with 0.5 mL of Folin-Ciocalteu reagent. After 5 min, 2 mL of 75 g/L sodium carbonate (Na2CO3) was added. Finally, the mixture diluted to 10 mL and kept it for 1 h at 40 °C without light. The absorbance was measured at 750 nm in a spectrophotometer (Perkin Elmer, USA). Blank sample of gallic acid was used as a reference in spectrophotometric analysis. A standard curve was prepared and the results were expressed as mg gallic acid equivalent/g sample. All samples were carried out in triplicate. The data were showed as milligrams of rutin equivalents (total flavonoids content) and gallic acid equivalents (GAE) (total polyphenols content) per kilogram of defatted meal.
Mineral composition Potassium (K), calcium (Ca), phosphorus (P), magnesium (Mg), copper (Cu), zinc (Zn), iron (Fe), and manganese (Mn), were determined by ICP-OES (iCAP 7000); barium (Ba) was determined by ICP-MS (NexIon 300D, Perkin Elmer, Shelton, CT, USA). The walnut samples preparation procedure according to the method developed in our previous research (Han et al., 2018). Briefly, 0.2 g milled samples were accurately weighted and transferred to polytetrafluoroethylene (PTFE) tube, then added 6 mL nitric acid (HNO3) and 2 mL hydrogen peroxide (H2O2). The PTFE tube was heated gradually to 200 °C for 20 min with the microwave oven (CEM, Matthews, NC, USA). After cooling at the room temperature, the PTFE tube was placed into digestion furnace and the solution was heated to near dryness at 200 °C. Then the solution diluted to 25 mL polypropylene tubes for ICP-OES (K, Ca, P, Mg, Cu, Zn, Fe, Mn) and ICP-MS (Ba) analysis.
Statistical analysis Analytical determinations were carried out in triplicates and the results were expressed as mean value ± standard deviation. The statistical significance of the measured differences among the means of triplicates was analyzed using the analysis of variance (ANOVA). To evaluate differences, the Tukey-karmer's multiple range test was choosing to evaluate the statistical significance (p < 0.05) of the data among different temperature by SPSS 18.0 software package (Statistical Package for Social Scientists, Michigan, USA).
Drying kinetics and temperature profile The relationship between the moisture ratio MR of the samples and the time τ of drying performed (Fig. 1, a, b, c, d) was described by the semi-empirical Page's equation:
 |

Drying curves of walnut samples at different temperature treatments, a--55 °C, b-60 °C, c-105 °C, d-140 °C.
where a, κ, y0 were the constant and showed in Table 1.
| Temperature | Equation | Determination coefficient (R2) | Reduced chi-square (χ2) |
|---|---|---|---|
| −55 °C (τ/h) | y=1.0151·e−0.1511τ−0.0186 | 0.9984 | 0.0002 |
| 60 °C (τ/h) | y=0.9882·e−0.5228τ−0.0084 | 0.9926 | 0.0008 |
| 105 °C (τ/min) | y=0.9854·e−0.0437τ+0.0078 | 0.9966 | 0.0004 |
| 140 °C (τ/min) | y=0.9931·e−0.3521τ+0.0041 | 0.9983 | 0.0002 |
Table 1 shows the equations with the different temperature treatments. The results present high values of the determination coefficient (R2, 0.993–0.998) and low values of the reduced chi-square (χ2, < 0.001), indicating an acceptable goodness-of-fit. The drying curves with different temperature showed similar variation. The moisture ratio MR decreased rapidly at the former period and decreased steadily at later period. Similar results were found for pumpkin (Nawirska et al., 2009) and carrots (Kroehnke, et al., 2018). To reach the equilibrium moisture content of samples the drying time required was found to be 24 h, 7 h, 2 h, and 0.25 h at −55 °C, 60 °C, 105 °C, 140 °C, respectively. Obviously, the drying time was significantly reduced with the temperature improved.
The temperature profiles of walnuts samples obtained during drying processing for different temperature are presented in Fig. 2. As show in Fig. 2, the temperature varied at different rates with the different drying conditions. The temperature inside dried walnuts reached a plateau around −55 °C and 60 °C with 20 min and 55 min for treatment, respectively, whereas the temperature increased rapidly and reached the 105 °C and 140 °C with about 15 min and 20 min, respectively.

Temperature profiles of walnut samples dried at −55 °C, 60 °C, 105 °C, and 140 °C. Temperature data were measured every 30 s during drying process.
Effects of different temperature on the chemical composition Moisture, total fat, crude protein, soluble sugar as well as carbohydrate are the basic components of walnuts. The effects of different temperature on these components are presented in Fig. 3. Fat was the predominant nutrient in walnut, the concentration of which was ranged from 65.8% to 67.3%. Obviously, the moisture content in kernel was decreased from 5.0% to 3.7% with the increasing temperature from −55 °C to 140 °C. The result showed that the high temperature was more conducive to the evaporation of moisture. There was no significant difference (p > 0.05) in the carbohydrate contents among the different treatments, with the levels ranged from 1.3% to 1.6%. Except for carbohydrates, all the other analyzed chemical compositions in walnuts exhibited significant variations (p < 0.05) among the four treatments. When the temperature was increased from −55 °C to 105 °C, the values of protein, soluble sugar, and carbohydrate were enhanced by 1.6%, 0.7%, and 0.1%, respectively. However, as the temperature was increased to 140 °C, a descending performance occurred. Therefore, the contents of protein, soluble sugar and carbohydrate in walnuts exhibited the highest values at 105 °C, with 19.6%, 3.0% and 1.6%, respectively. During the heating process, nut cells and tissue structures were physically damaged, which led to more chemical components were released; some enzymes (esterase) maintain active at the high temperature, which might further help the release of chemical contents (Bai et al., 2017). However, when the temperature was up to 140 °C, the above-mentioned effects induced by heating might be weakened or stopped. In addition, the high temperature might destroy the construction of nuts and reduce enzymes active thus result in denaturation of chemical compounds during drying (Arinola and Adesina, 2014).

Chemical composition of walnut (Juglans regia L.) in different temperature. (a)–(d) Means within each column with different letters are significantly (p < 0.05) different. Data are presented as mean ±standard deviation (n = 3)
According to the results from this study, heating with an appropriate temperature could increase the chemical composition of walnut, whereas those contents could decrease with the keeping elevated temperature. The similar performance was also observed for the fat of pecan walnut, which was increased from 69.1% to 73.6% with the heating temperature from 70 °C to 110 °C, and reduced to 72.6% as the temperature increased to 130 °C (Aljuhaimi et al., 2017b). In addition, the contents of protein in Canarium indicum (Bai et al., 2017) and carbohydrate in walnut (Arinola and Adesina, 2014) also decreased when the heating temperature above 110 °C.
Effects of different temperature on the fatty acids composition Fatty acids are both important dietary sources of energy for human and important structural components for body cells. The fatty acids profiles of walnuts are shown in Table 2. The unsaturated fatty acids accounted for more than 90% of total fatty acids. The polyunsaturated fatty acid (PUFA) represented more than 72% of total fatty acids. Linoleic acid (n-6) and α-Linolenic acid (n-3) could be detected as the main PUFA, with the concentrations ranged from 245.4 ± 4.40 mg/g to 309.0 ± 41.61 mg/g and 34.3 ± 0.06 mg/g to 43.1 ± 5.82 mg/g, respectively. The monounsaturated fatty acids (MUFA) were ranged from 16.8% to 17.3%. The oleic acid was the most abundant MUFA, constituting more than 98% of MUFA. Saturated fatty acid (SFA) was less than 10% of total fatty acids in all samples.
| Temperature/°C | |||||
|---|---|---|---|---|---|
| −55 | 60 | 105 | 140 | ||
| Group 1 | Palmitic acid | 25.27±0.46a | 25.44±0.05a | 30.98±4.24a | 26.72±3.96a |
| (mg/g) | Stearic acid | 12.28±0.22a | 11.73±0.02a | 14.49±1.95a | 12.99±1.89a |
| Arachidic acid | 0.36±0.05a | 0.34±0.04a | 0.3±0.01a | 0.34±0.01a | |
| Oleic acid | 65.85±1.21a | 64.76±0.12a | 79.56±10.71a | 68.93±10.09a | |
| Palmitoleic acid | 0.32±0.07a | 0.37±0.03a | 0.31±0.08a | 0.35±0.09a | |
| Gadoleic acid | 0.82±0.11a | 0.73±0.09a | 0.65±0.02a | 0.67±0.02a | |
| α-Linolenic acid (n-3) | 36.93±0.66a | 34.26±0.06a | 43.09±5.82a | 38.7±5.52a | |
| Linoleic acid (n-6) | 245.44±4.40a | 251.36±0.47a | 309.04±41.61a | 267.35±38.76a | |
| Group 2 | Palmitic acid | 6.52±0.00a | 6.54±0.00a | 6.47±0.02b | 6.42±0.02c |
| % | Stearic acid | 3.17±0.00a | 3.01±0.00d | 3.03±0.00c | 3.12±0.00b |
| Arachidic acid | 0.09±0.01a | 0.09±0.01a | 0.06±0.01b | 0.08±0.01ab | |
| Oleic acid | 17.00±0.00a | 16.65±0.00b | 16.63±0.00b | 16.56±0.02c | |
| Palmitoleic acid | 0.08±0.02a | 0.1±0.01a | 0.07±0.01a | 0.08±0.02a | |
| Gadoleic acid | 0.21±0.03a | 0.19±0.02ab | 0.14±0.02b | 0.16±0.02ab | |
| α-Linolenic acid (n-3) | 9.54±0.01a | 8.81±0.00d | 9.01±0.00c | 9.3±0.02b | |
| Linoleic acid (n-6) | 63.38±0.04c | 64.62±0.02a | 64.59±0.01a | 64.26±0.01b | |
| n-6/n-3 | 6.65±0.01d | 7.34±0.00a | 7.17±0.01b | 6.91±0.02c | |
| SAF | 9.79±0.01a | 9.64±0.01b | 9.57±0.01c | 9.63±0.01b | |
| MUFA | 17.30±0.03a | 16.93±0.01b | 16.83±0.02c | 16.81±0.02c | |
| PUFA | 72.91±0.05c | 73.43±0.02b | 73.60±0.01a | 73.56±0.02a | |
SFA, saturated fatty acids; MUFA, monounsaturated fatty acids; PUFA, polyunsaturated fatty acids. (a)–(d) Means within each column with different letters are significantly (p < 0.05) different. Value are expressed as mean ± standard deviation (n = 3). Group 1: Fatty acid composition content (mg/g) of walnut. Group 2: Fatty acid composition (%) of walnut
The present work revealed that the different drying conditions have not significantly effect on each individual fatty acids fatty acid. Interestingly, the highest contents were exhibited at 105 °C (exclude gadoleic acid). The performance was likely due to the hydrolytic enzymes in damaged cells, which could lead to increased fatty acids after dry heating (Bai et al., 2017).
Besides the contents of fatty acids, the proportion of fatty acids composition is also an important indicator to characterize the nutritional qualities of walnuts. There were significant differences (p < 0.05) among the different drying temperature in fatty acids compositions (except palmitoleic acid). The highest percentage of stearic acid, arachidic acid, oleic acid, gadoleic acid, and α-Linolenic acid could be detected at −55 °C. Walnut exhibited the highest percentage of palmitic acid, palmitoleic acid, and linoleic acid at 60 °C. Compared with samples dried at lower temperature (−55 °C or 60 °C), the sample exhibited lower percentage of specific fatty acids dried at higher temperature (105 °C or 140 °C). Our results is in line with one reported literature (Aljuhaimi et al., 2017b), in which the portions of fatty acids reduced with the heating temperature improved from 70 °C to 130 °C. In addition, the n-6/n-3 ratio of walnut has great significance for human beings, and the recommended dietary n-6/n-3 intake ratio for human beings ranges from 1:1 to 5:1 (Simopoulos 2008). From our work, the optimal ratio of n-6/n-3 was 6.65 (from the freeze drying treatment), which indicated that the drying process (heating) could have a negative effect on the ratio of n-6/n-3.
Effects of different temperature on flavonoids and polyphenols Flavonoids and polyphenols are important antioxidant substances, which show much stronger antioxidant activities than other nutrient compounds (Tas and Gokmen, 2017). The total flavonoids contents (TFC) and total polyphenols contents (TPC) of walnut methanol extracts obtained with different treatments are shown in Fig. 4. The contents of flavonoids were notably raised from 8.4 mg/g to 11.5 mg/g, along with the temperature from −55 °C to 140 °C. After drying at 60 °C, the TFC was increased by 12.7% compared with the values from −55 °C. However, with the temperature from 60 °C to 105 °C, the TFC of walnut increased by 6.6%. Interestingly, the highest growth rate for TFC came from the temperature interval of 105 °C to 140 °C. Some studies indicated that TFC were notably increased by 33.5% in cashew and 131.4% in almond when the temperature was increased from 110 °C to 175 °C (Ghazzawi and Al-Ismail, 2017). The increased TFC in nuts could be contributing to the increased anthocyanin content during heating, as the anthocyanin was heat-resistant (Aljuhaimi et al., 2017a).

Total flavonoids contents (TFC) and total polyphenols contents (TPC) in walnut (Juglans regia L.) in different temperature. (a)–(d) Means within each column with different letters are significantly (p < 0.05) different. Value are expressed as mean ± standard deviation (n = 3)
The variation of TPC was in agreement with TFC. The TPC were ranged from 16.8 mg/g at −55 °C to 22.5 mg/g at 140 °C. At the different temperature intervals, the TPC was increased by 4.5% (−55 °C to 60 °C), 17.0% (60 °C to 105 °C), and 14.0% (105 °C to 140 °C), respectively. The increase of TPC with the temperature was also reported from hazelnut (Marzocchi et al., 2017), Sacha inchi (Sterbova et al., 2017), and cashew (Chandrasekara and Shahidi, 2011). The performance could be due to the Maillard reaction, in which the formation of Maillard derivatives (such as pyrroles and furans) reacts with Folin-Ciocalteu reagent (Ghazzawi and Al-Ismail, 2017). Additionally, it is supposed that the increase of TPC by the heating process is probably an easier extraction of polyphenols substances linked to the matrix, due to a greater matrix destructuration when the heating temperature is increased (Marzocchi et al., 2017).
Effects of different temperature on the mineral composition Mineral contents of kernels with freezing and heating treatment are given in Fig. 5. Walnuts are rich in K, Ca, P, and Mg, in which the concentrations were 3719.4–4372.0 mg/kg, 1717.6–1890.9 mg/kg, 3936.8–4511.4 mg/kg, and 1801.2–2100.6 mg/kg, respectively. Walnuts also contain other elements such as Fe, Mn, Zn, Cu, and Ba (data of Ba not shown), with the detected concentrations were 25.7–31.7 mg/ kg, 45.2–54.6 mg/kg, 31.6–34.8 mg/kg, 17.1–20.3 mg/kg, and 1.5–1.6 mg/kg, respectively. Interestingly, the highest Mn content was recorded at 60 °C, whereas the lowest content was found at 105 °C. This result was different with other elements. Except for Mn, the variations of the analyzed mineral elements showed a similar performance under the four drying process. When the temperature was raised from −55 °C to 105 °C, the contents of mineral elements were improved and reached to a top at 105 °C. The increase percentages for the analyzed mineral elements were ranged from 7.3% to 23.3%. However, when the sample was submitted to the heating process at 140 °C, all the mineral elements were decreased, with the decrease percentages of 4.7%–9.8%. This similar performance was reported in roasted walnuts, in which the decreased percentages of Fe and Mg were 169.2% and 9.8% with the roasting temperature, improved from 180 °C to 220 °C (Djikeng et al., 2018). Previous works showed that some antinutritional substances were present in nuts and could form tight complexes with the mineral elements, which could be significantly destroyed by heat (Djikeng et al., 2018; Makinde and Akinoso, 2013). We conclude that the heating process resulted in the dissociation of the complexes and the improvement of free mineral elements. The dissociation effect might reach a top at 105 °C, or the correspondingly increased temperature (140 °C) even had a negative effect on the dissociation process. However, with the treatment temperature form 120 °C to 180 °C, the mineral contents in sesame increased percentages from 12.3% (Cu) to 91.7% (Mg) (Makinde and Akinoso, 2013). The results in sesame are significantly different from ours, which probably caused by the different nut and treatment temperature.

Minerals composition of walnut (Juglans regia L.) in different temperature (µg/kg). (a)–(d) Means within each column with different letters are significantly (p < 0.05) different. Value are expressed as mean ± standard deviation (n = 3)
Effects of different temperature on the nutritional qualities The comparisons of nutritional qualities of walnuts dried by heating and freezing treatments are presented in Fig. 6 (a, b, c). Notably, the heating treatment had an irritation effect for most of nutritional qualities. Dried walnut by heating treatment showed higher values for the chemical compositions, minerals, antioxidant substances (polyphenols and flavonoids), and part of fatty acids than dried samples by freezing treatment. Compared with freeze drying treatment, the improved percentages of nutritional qualities were from 1.0% to 34.0% during heat drying treatment. Among these changed qualities, some chain reactions occurred. During heating treatment, Maillard reaction could occur between soluble sugar and protein in nuts, thus resulting in the formation of variety of byproducts, which might increase the TPC and TFC (Chandrasekara and Shahidi, 2011). On the other hand, the TPC in sesame increased significantly as the heating temperature increased due to the liberation of polyphenols compounds (Jeong et al., 2004). On the contrary, heat drying treatment had an inhibition effect for some fatty acids such as gadoleic acid and arachidic acid, in which the inhibition effect for these mentioned qualities were not more than 21%.
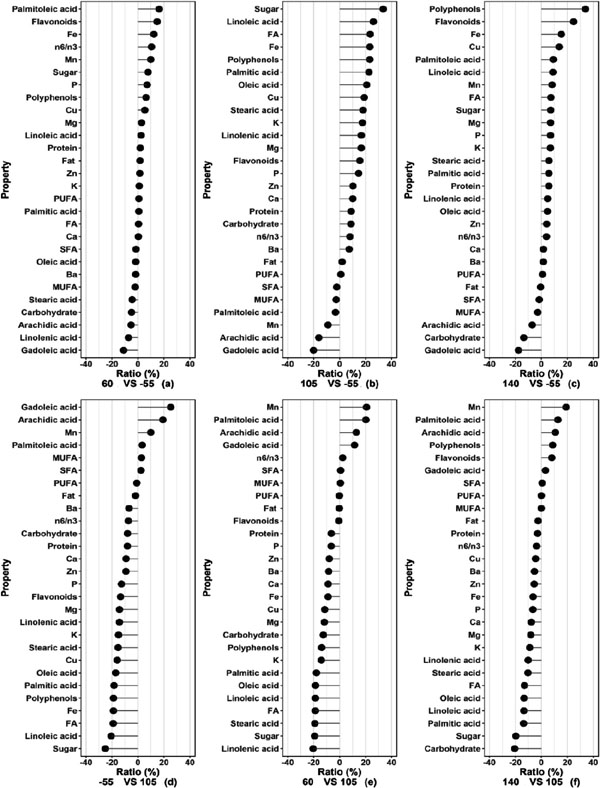
Effects of temperature treatments on the health-related properties
The comparisons of nutritional qualities of walnuts dried by 105 °C and other temperatures are shown in Fig. 6 (d, e, f). Obviously, dried walnut by other temperatures (−55 °C, 60 °C, 140 °C) had a notable inhibition effect for most of nutritional qualities. The inhibition effects for these qualities were ranged from 0.3% to 25.1%. However, 105 °C is an optimal drying temperature to improve these qualities. In addition, dried at 105 °C had an irritation effect for the gadoleic acid, arachidic acid, palmitoleic acid, SFA, and Mn. The irritation effects on these nutritional qualities were ranged from 0.6% to 20.7%.
In this work, the effects of heat and freeze drying on nutritional qualities of walnuts were investigated. The results indicated that heating treatment had an irritation effect for most of nutritional qualities, with the highest irritation effect of polyphenols. Although a high temperature could improve the drying efficiency, some nutritional qualities could be destroyed or decreased by the high temperature, especially when the temperature up to 140 °C. However, freezing treatment had an inhibition effect for most of nutritional qualities of walnuts. Although samples by freeze drying were found to be beneficial for PUFA and ratio of n-6/n-3, the chemical compositions, minerals, antioxidant substances, and some of the fatty acids exhibited a notable decrease performance, with the highest inhibition effect of gadoleic acid. Therefore, taking into account the variations of the comprehensive nutritional qualities, the heat drying of 105 °C was recommended as an optimal process for walnut drying, in which the protein, soluble sugar, carbohydrate, palmitic acid, stearic acid, oleic acid, α-Linolenic acid, and minerals showed the highest values.
Acknowledgments This study was supported by the Opening Project Fund of Key Laboratory of Rubber Biology and Genetic Resource Utilization, Ministry of Agriculture (RRI-KLOF201703); the Fundamental Research Funds of CAF (CAFYBB2017QC002).