Abstract
A novel method was developed to separate the tea polyphenols epigallocatechin gallate (EGCG) and epicatechin gallate (ECG) by two-step chromatography. In the first-step, four different macroporous absorption resins were compared by dynamic desorption, of which only AB-8 resin resulted in enriched fractions for EGCG and ECG. Their purity was 53.69%, and 65.77%, with recovery rates of 88.05%, and 83.46%, respectively. For the second-step, The recovery rates of 85.36% and 86.09% for EGCG and ECG were obtained respectively by a novel stationary phase of β-CD bonded agar gel. The overall recovery efficiency of the complete procedure was 75.16% for EGCG and 71.85% for ECG, respectively, and the purity of the obtained preparations reached 97.63% for EGCG and 98.09% for ECG. The chromatographic behavior of β-cyclodextrin bonded agar gel was studied with elution by acetonitrile, which indicated that both hydrophilic and hydrophobic interactions between the polyphenols and the solid phase occurred.
Introduction
Intake of sufficient fluids is part of a healthy life style, for which green tea can be a suitable source. Tea has been consumed for centuries worldwide, and is highly popular in China. Green tea is high in catechins (polyphenols), with the main constituents of epicatechin gallate (ECG) and epigallocatechin gallate (EGCG). These compounds have been attributed a variety of benign activities. They function as anti-oxidants (Kongdo et al., 1999; Simos et al., 2011) and immune modulators (Wong et al., 2010; Wu et al., 2012), and have been considered suitable additives for anti-tumorigenic (Lim et al., 2006; Lecumberri et al., 2013) and anti-inflammation therapy (Kapoor et al., 2004; Riegsecker et al., 2013). The gallates have been shown to have anti-viral (Zhang et al., 2012) and anti-bacterial activity (Anderson et al., 2011; Cui et al., 2012). The extraction and isolation of catechins from tealeaves has been well established (Vuong et al., 2010). However, it can be a challenge to separate EGCG from ECG, because their physiochemical properties are highly similar, although it is essential to obtain either product at high purity for commercial and practical application. The required purity of EGCG in Chinese New Resource Food is above 94%. Liquid-liquid extraction can only recover EGCG- or ECG-enriched fractions with relative low purity (Bazinet et al., 2007; Ye et al., 2014). Additional purification procedures have been adopted to increase the purity of EGCG or ECG fractions, such as simulated moving bed chromatography (Wang et al., 2012) or Sephadex LH-20 in combination with high-speed counter-current chromatography (Yang et al., 2008). These methods are expensive and complicated, even some unenvironment-friendly solvent was used, which limits their large-scale application. In some cases less expensive column chromatography was employed including macroporous resin and polyamide (Wang et al., 2014; Jin et al., 2015) or alternative adsorption materials (Lai and Gu, 2014), but two or more steps were required for purification of EGCG only, while ignoring ECG or other useful compounds. Obviously, there is a need to improve existing methods for a highly efficient, safe, and economic alternative. In this study, we have set the goal to develop an easy and practical method to separate and purify EGCG and ECG obtained from column chromatography, for which we used β-cyclodextrin (β-CD).
β-CD is a cyclic oligosaccharide with seven D-glucopyran-ose, units that are connected through α-1,4-linkage. It forms agel with a hydrophilic surface and conical-shaped hydrophobic cavities, which can selectively form inclusion complexes with specific molecules (Rekharsky and Inoue, 1998). β-CD has been applied as the stationary phase in liquid chromatography separation (Yang et al., 2011; Lai et al., 2012; Li et al., 2016; Yu et al., 2017; Hou et al., 2018). Agar is mainly composed of agarose, which has been widely applied in separation media. Compared with agarose, agar, which further contains agaropectin, is more widespread and cheaper. We bound β-CD to agar to produce a microsphere gel, AG-β-CD, and studied its immobilization properties as a novel stationary phase to purify EGCG and ECG from enriched fractions. These fractions resulted from chromatography using a macroporous resin, for which four alternatives were compared. The combined procedure resulted in high purity of EGCG and ECG fractions. The composition of the mobile phase, the flow rate and loading quantities were optimized to reach higher recovery rates. Furthermore, chromatographic behavior of AG-β-CD was investigated by the retentive properties of catechin and the tea polyphenols on AG-β-CD were studied.
Materials and Methods
Materials A crude preparation of tea polyphenols, containing 38.68% EGCG and 17.28% ECG, was obtained from Gosun Biotechnogies Company (Hangzhou, China). High purity standards of EGCG, ECG and catechin (all 98% purity) were purchased from Sigma-Aldrich (St. Louis, MO, USA). Their structural formulas are given in supplementary Fig. S1 and Fig. S2, which shows their obtained HPLC chromatograms. Relevant parameters of the macroporous resins ADS-7, ADS-17, ADS-21 and AB-8 are shown in supplementary Table S1. Other reagents were obtained at AR grade.
Preparation of the β-cyclodextrin bonded agar gel microsphere
The AG-β-CD was prepared in three steps:
a) Emulsification agar microspheres were produced starting with 1.0 L 10% (w/w) agar-water mixture in a 5 L round bottom glass flask equipped with U-shaped polytetrafluoroethylene (PTFE) stirrer and a reflux cooler placed in a controlled temperature jacket. The mixture was incubated at 80 °C and 3000 rpm until the agar was completely dissolved, and then slowly added into 1.0 L of epichlorohydrin-Span 85 (4:1, v/v) and the incubation was continued at 80 °C and 6000 rpm for 40 min. The temperature was then slowly lowered to 25 °C over a time span of 120 min. The agar gel microspheres were filtered by a Buchner funnel and washed with 50% (v:v) ethanol, then with water and finally with 50% ethanol until the washout was clear.
b) For cross-linking of the agar microspheres, 100 g moist gel was mixed in 100 mL water in a 1 L flask equipped with a U-shaped PTFE stirrer as above, to which 15 g Na2CO3 were added. This was incubated at 35 °C and 200 rpm for 30 min, after which 4 mL 50% NaOH and 1.2 g NaBH4 were added, and subsequently 25 mL epichlorohydrin was added at a rate of 0.1 mL/min, followed by addition of 50 mL 50% NaOH at a rate of 0.2 mL/min. The reaction temperature was increased to 50 °C and incubation was continued for 18 h at 200 rpm. Following gradual cooling to 25 °C the stirring was stopped, and the pH was adjusted to 5∼6 by addition of acetic acid. The cross-linked agar gel microspheres were filtered by Buchner funnel and washed with 50% ethanol, water and 50% ethanol in turn.
c) Bonding β-cyclodextrin onto the agar started with 5 g β-CD dissolved in 100 mL water at 35 °C in the same reaction device as step (b), to which 100 g cross-linked agar gel microspheres were added at 200 rpm. The subsequent reaction procedure was the same as in step (b). The bonded β-CD agar gel microsphere was stored in 50% ethanol at room temperature for further use.
Separation by macroporous adsorption resins A static absorption experiment was performed to compare different macroporous adsorption resins that are commonly used: AB-8, ADS-7, ADS-21 and ADS-17 (Wang et al., 2014; Jin et al., 2015). To compare their separation capacity for EGCG and ECG, dynamic desorption was performed. The resins were soaked in 95% ethanol for 24 h, and washed with water to remove all alcohol. Each resin was packed in a column (400 mm length × 26 mm i.d.) with a bed volume (BV) of 150 mL. A mixture of 1.5 g crude-grade tea polyphenols containing 610.24 mg EGCG and 158.51 mg ECG was dissolved in 150 mL water and filtered using a hydrophilic membrane with 0.45 µm pore size. The filtrates were loaded into the column at a flow rate of 1 BV/h. 1 BV water was employed to eliminate the unabsorbed filtrate, then the column was eluted with 2 BV of 10%, 20%, 30%, 40% and 50% (v/v) aqueous ethanol each, at a constant flow rate of 1 BV/h. Eluents of 1 BV were collected over time. All samples were analyzed for content and purity of EGCG and ECG by HPLC (see section 6). A fraction was defined as EGCG-enriched when the content ratio of EGCG/ECG was greater than or equal to 10; for ECG-enriched fractions, the ECG to EGCG ratio had to be ≥ 10. Enriched fractions were separately concentrated by freeze-drying, and the freeze-dried powder was stored at 4 °C for further purification with AG-β-CD.
Recovery and separation using resin AB-8 were optimized, loading the column with 3 g tea polyphenols dissolved in 100 mL and filtered as above. The column was washed with 2 BV water to remove pigments and then eluted with aqueous ethanol using different stepwise gradients of increasing alcohol concentrations at a flow rate of 1 BV/h. Five elution protocols were applied, with Method 1: 2 BV of 10% alcohol followed by 2 BV of 20%, 2 BV of 30%, and 2 BV of 40%; Method 2: 6 BV of 10%, 4 BV of 20%, 2 BV of 30% and 2 BV of 40%; Method 3: as Method 2 but with an initial concentration of 15% for the first 6 BV; Method 4: 6 BV of 18% followed by 4 BV of 30%; Method 5: 8 BV of 16% followed by 4 BV of 30%. The recovery rates of ECG and EGCG were recorded.
Purification of enriched fraction by β-cyclodextrin bonded to agar EGCG- and ECG-enriched fractions were separately purified by AG-β-CD, which was packed into a column (40 mm ×10 mm i.d.) with a BV of 25±1 mL. For this, 20 mg freeze-dried powder (see section 3) was dissolved in 5 mL (initial) mobile phase (see below) and filtered using a 0.45 µm disposable syringe PVDF filter. The filtrate was then loaded onto the column and eluted with water/methanol at a flow rate of 1 mL/min. For eluation of EGCG three mobile phases were tested: 70% MeOH, 80% MeOH, and 65% MeOH for 0∼120 min followed by 70% MeOH (120 min). For eluation of ECG the first two tested mobile phases were the same as for EGCG, and the third was 60% MeOH (0∼40 min) followed by 80% MeOH. Eluent was collected in 10 mL fractions according to their chromatographic peak at 280 nm. All samples were analyzed by HPLC.
Chromatographic behavior of AG-β-CD When agar was emulsified and cross-linked in absence of β-CD, the formed microspheres hardly had absorption capacity, both in pure water and in organic solvents. The chromatographic behavior of AG-β-CD was investigated for EGCG and ECG, and these were compared to the related polyphenol catechin. The retention properties of the three polyphenols on AG-β-CD were studied as follows: 2 mg of EGCG, ECG and catechin each were dissolved in 5 mL initial mobile phase in combination, and this mixture was separated as described in section 4 except for the mobile phase, which was 20%, 40%, 60%, 80% and 100% acetonitrile (ACN). The same experiment was performed with C18-bonded silica gel replacing AG-α-CD, with all other conditions identical as described in section 6.
HPLC analysis All samples were analyzed by HPLC (Waters e2695, Waters Corporation) equipped with a 250 mm×4.6 mm RP C18 column at a temperature of 35 °C. Mobile phases consisted of 99.99% methanol (mobile phase A) and 0.075% acetic acid in water (mobile phase B) with a solvent flow rate of 1.0 mL/min and an increasing-decreasing A/B ratio using the following gradients: 0–10 min with 15%/85% A/B, increasing to 20/80 (10–30 min) and to 50/50 (30–35 min), then decreased to 15/85 A/B (35–45 min). The eluate was monitored with a 2998 PDA detector at 280 nm, with an injection volume of 10 µL. The calibration curves of EGCG and ECG were Y=1.19×10⁷X−1.92×10⁶; Y=7×10⁶X−2.46×10⁵ with R2 correlation coefficients of 0.999 for both, where Y was the peak area, X was the concentration of analyte (mg/mL).
Results and Discussion
AG-β-CD characterization Scanning electron microscopy (SEM) was used to study the morphology of the prepared microspheres during the three steps of preparation. All samples were dehydrated before SEM. Emulsification ager microspheres easily melt in the process of dehydration and drying and lose their spherical shape (Fig. 1a, 1d). Minor deformations and cracks on the surface of crosslinked microspheres are visible (Fig. 1b, 1e). Fig. 1c and Fig. 1f show spherical shaped micropshperes with an intact surface after bonded with β-CD. The particle size was analyzed which showed that AG-β-CD had a mean grain size of 17.11 ± 0.4 µm with 85.64% in the range of 10 ∼ 200 µm.

The FT-IR spectra of the crossliked agar microspheres and the bonding of β-CD onto the agar microspheres was investigated, with results shown in Fig. 3S in the supplementary file. Identical peaks are visible in the spectra of agar microspheres and AG-β-CD around 3500 cm−1 and 1639 cm−1, which respectively represent OH-group stretching vibration absorption and bending vibration absorption. These two peaks decreased in intensity with AG-β-CD, indicating that part of the OH-group on the agar microspheres is bonded to β-CD or crosslinked with each other. The FT-IR spectra of AG-β-CD displays sharp peaks at 1086 cm−1 and 1044 cm−1, and glycopyranoside at 877 cm−1, which is absent or weak in the FT-IR spectra of agar compared with β-CD. These results show that β-CD was successfully bound onto crosslinked agar microspheres.
Separation of EGCG and ECG by macroporous adsorption resins Dynamic adsorption was occupied to select adsorbents from separation capability of tea polyphenols. Fig. 2 showed that separation capacity of four kinds of resin between EGCG and ECG. Resins ADS-7 and ADS-17 demonstrated strong absorption ability but less separation ability, 32.12 mg EGCG-enriched fraction and 18.19 mg ECG-enriched fraction were eluted separately with 30% ethanol and 50% ethanol by ADS-7, elution curves of two compounds practically overlapped in ADS-17 and only 42.6 mg ECG-enriched fractio were obtained. ADS-21 and AB-8 showed better separation capability for EGCG and ECG, for ADS-21, 186.87 mg EGCG-enriched fraction and 19.2 mg ECG-enriched fraction could be recovered from the enriched fractions separated by 20% and 50% ethanol respectively, while the bulk of EGCG and ECG were eluted together with 30%–40% ethanol. Resin AB-8 produced an EGCG-enriched fraction containing 179.97 mg and an ECG-enriched fraction with 44.4 mg, by 20% and 40% ethanol, respectively. For the view of both obtaining high recovery of EGCG and ECG, AB-8 was adopted in first process to optimize for separation EGCG and ECG.

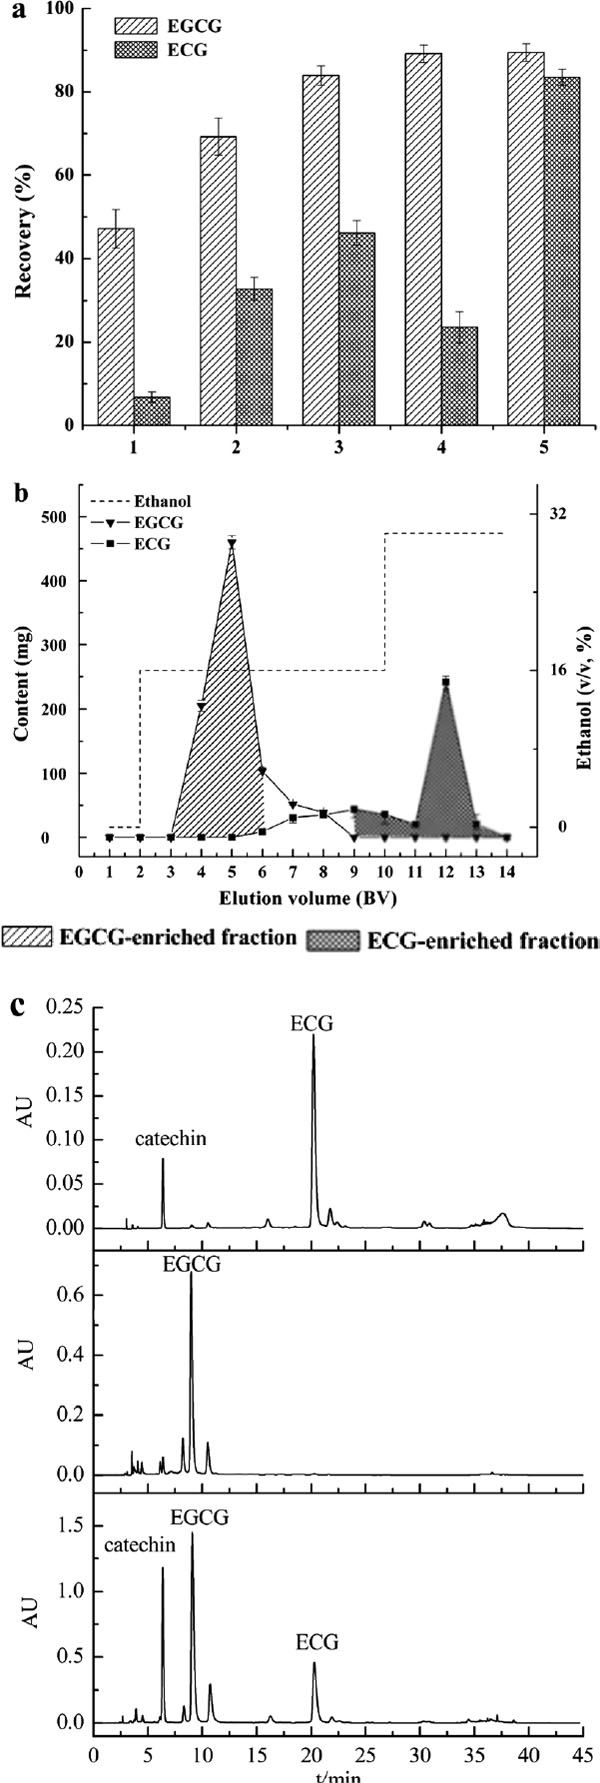
Aqueous ethanol with different concentration can make the reaction between different catechins molecules and adsorption resins stronger or weaker (Wang et al., 2014). The observed partial separation is due to the slightly lower polarity of ECG compared to EGCG, due to presence of an extra hydroxyl-group in the latter (Fig. S2). The weak polarity of AB-8 resin resulted in stronger absorption of ECG and, as a consequence, EGCG eluted at a lower ethanol concentration. In the next set of experiments, different elution protocols were compared using an AB-8 column loaded with 3 g crude tea polyphenol mixture. Using eluation Method 1, the recovery of EGCG reached 47.12%, but that of ECG was only 6.76%. Increasing the initial bed volume with low ethanol concentrations, from 2 and 4 BV with 10% and 20%, respectively in Method 1, to 6-4 BV with 10–20% in Method 2, increased the recovery of both ECG and EGCG to 69.22% and 32.79%, respectively (Fig. 3a). This was further improved to 88.38% and 44.36%, respectively, using 6–10 BV with 15–20% ethanol in Method 3, but most of the ECG was still wasted in the tailing zone of EGCG. The recovery of EGCG could be further increased to 87.51% using Method 4, with 6 BV of 18% followed by 4 BV of 30% ethanol, but this decreased the recovery of ECG to 23.58%. The best results were obtained with Method 5, using 8 BV of 16% ethanol to elute EGCG and then eluting ECG with 30% ethanol. This resulted in 88.05% recovery of EGCG and 83.46% of ECG. The eluation curve is shown in panel b of Fig. 3. The average purity of EGCG and ECG in these two fractions was 53.69% and 65.77%, respectively. When the same method was applied to an AB-8 column loaded with 4 g polyphenol mixture, eluation by Method 5 with a flow rate of 2 BV/h did not further improve separation or recovery of EGCG and ECG (results not shown). Fig. 3c shows the HPLC chromatography of EGCG- and ECG-enriched fractions that were obtained with Method 5 by AB-8 resin. Although the two fractions were collected with low purity of EGCG and ECG, this simple method provides a cost-effective means to separate EGCG from ECG (Du et al., 2013; Cui et al., 2017). Furthermore, the method developed here clearly shows the advantage of dynamic elution over static adsorption. This is not the first description to use AB-8 resin for purification of tea polyphenols, but we demonstrate that a two-step elution with defined ethanol concentrations can improve the separation of ECG and EGCG considerably (Wang et al., 2014; Jin et al., 2015).
Purification of EGCG and ECG by AG-β-CD Since ECG and EGCG could not be completely separated by the AB-8 column alone, a second purification step was introduced, using the novel matrix β-CD bound to agarose, AG-β-CD, that was prepared as described in the methods. A pilot experiment indicated that the compounds were hardly eluted from this matrix by 60% methanol, while both were eluted, together with impurities, by 90% methanol (results not shown). Experiments with three different methanol concentrations within this range are shown in Fig. 4. Elution with 70% methanol (Fig. 4a) recovered 84.18% of the loaded EGCG, and with 80% methanol (Fig. 4b) the recovery rate of EGCG was 82.59%. For ECG these rates were 66.85% and 69.23%, respectively (Fig. 4d, e, Supplementary Table S2). By application of a two-step elution, using 65% methanol for 120 min followed by 70% for EGCG, or 60% methanol for 40 min followed by 80% for ECG, impurities could be more effectively separated from the target compounds (Fig. 4c, f). The recovery rate of EGCG with a purity over 95% now reached 88.74% and that of ECG was 83.92%.

The two-step elution procedure was further optimized by variation of the flow rate and sample loading. As summarized in supplementary Table S2, for both EGCGand ECG the optimal sample loading was 30 mg, and with this load there was no further improvement of recovery rate, regardless of the increase of flow rate. The optimal EGCG purification conditions using AG-β-CD is given by elution with 65% methanol for 120 min to remove impurities, then elution with 70% methanol, with a sample loading of 30 mg and a flow rate of 1 mL/min (Fig. 5a). For a sample load of 30 mg ECG, impurities are removed with 60% methanol within 40 min, and elution is performed with 80% methanol at a flow rate of 1 mL/ min (Fig. 5c). Triplicate experiments using these optimized conditions resulted in an average EGCG recovery of 85.36% and of 86.09% for ECG, with a purity over 95% whose HPLC spectra are shown in Fig. 5b and d. The relative standard deviation was 0.98% and 1.13%, respectively. It is proved that purification of EGCG and ECG by AG-β-CD is reliable and effective way. And compared with other β-CD stationary phase, EGCG and ECG both were obtained with high purity (Lai et al., 2012).

The two-step process with separation on AB-8 resin followed by AG-β-CD purification produced overall recovery rates of 75.16% for EGCG and 71.85% for ECG, with purity of 97.63% for EGCG and 98.09% for ECG. Obtaining such high purity fractions for EGCG and ECG with a good recovery is exceptional. Not only were the two compounds simultaneously separated with high purity and yield, the procedure is also simpler than those described in the literature (Bazinet et al., 2007; Yang et al., 2008; Lai et al., 2012; Du et al., 2013; Lai and Gu, 2014; Ye et al., 2014; Wang et al., 2014; Jin et al., 2015; Cui et al., 2017). Furthermore, only a dilution of ethanol and methanol were needed, which is considerably safer, cheaper and more environmentally friendly than the chemicals used in other methods (Yang et al., 2008; Wang et al., 2012; Lai et al., 2012; Du et al., 2013; Lai and Gu, 2014). Furthermore, most of catechin were collected with ECG-enriched fractions by AB-8 resin and then purificated in the process of ECG purification by AB-β-CD (seeing the Fig. 3 (top) and the bottom of Fig. 5d), this phenomenon indicated that EGCG, ECG and catechin have potential to be separated by above two-step process (data not shown).
Explaining the chromatographic behavior of AG-β-CD These predictions were confirmed experimentally by elution with variable ACN concentrations. As shown in Fig. 6a, elution of catechin was faster than that of EGCG, and that was again slightly faster than ECG, and the elution order of 80% ACN showed a typical spectrum (Fig. 6b). The results were some difference with the C18-bonded silica gel, which produced an elution order of catechin followed by EGCG and then ECG (Fig. 6c). Those results indicate that the observed retentive properties of AG-β-CD are not restricted to hydrophobic interactions.

The U-shaped curves of Fig. 6a indicate absence of a linear relationship between retention time and acetonitrile concentration. Elution of EGCG and ECG from AG-β-CD occurs with a mobile phase containing over 40% ACN as well as less than 80% ACN. These findings may be caused by the presence of both hydrophobic and hydrophilic interactions between the compounds and AG-β-CD. Hydrophobic interaction is dominant inside the hydrophobic cavities of β-CD and the 2-benzyl chromone of the polyphenols, and this could be enhanced by the benzene ester present in EGCG and ECG. Such interactions are abolished by high ACN concentrations. Hydrophilic interactions are formed between the hydrophilic surface of β-CD and the hydroxyl groups of the three compounds, which are destroyed by low ACN concentrations. Above results demonstrated that AG-β-CD have double interaction of hydrophilic and hydrophobic interactions (Li et al., 2016). Meanwhile, it is proved that separating EGCG and ECG simultaneous only by β-CD stationary phases is not easy (Lai et al., 2012; Lai, and Gu, 2014; Cui et al., 2017), we just exploited ingenuity two steps for both obtaining high purity of EGCG and ECG with high recovery.
Conclusion
The two-step chromatographic procedure was used to preparation high purity of EGCG and ECG with high yield. The separation with AB-8 resins and purification with AG-β-CD was evaluated and optimized. The main conclusions of this work were as follow:
(1) The first step involves adsorption to macroporous resin AB-8, which performed better than three other tested resins. This indicated that dynamic elution was superior to static adsorption for evaluating the separating capacity between EGCG and ECG.
(2) The overall recovery efficiencies of the complete procedure were 75.16% and 71.85%, respectively. The purity of the obtained preparations was 97.63% for EGCG and 98.09% for ECG.
(3) The retention properties of the polyphenols with different concentrations of acetonitrile revealed that their affinity to AG-β-CD was caused by both hydrophilic and hydrophobic interactions.
In conclusion, the two-step method can be employed for separating and purification of active ingredients from tea polyphenols.
Acknowledgements This research was financially support by the Fund of Scientific and Technological Innovation Team for Outstanding Youth in Hubei Province (T201832) and the Special Fund from Wuhan Technology and Business University (S2018001).
The authors have no conflict of interest to declare.
References
- Anderson, J.C., Mccarthy, R.A., Paulin, S., and Taylor, P.W. (2011). Anti-staphylococcal activity and β-lactam resistance attenuating capacity of structural analogues of (-)-epicatechin gallate. Bioorg. Med. Chem. Lett., 21, 6996-7000.
- Bazinet, L., Labbé, D., and Tremblay, A. (2007). Production of green tea EGC- and EGCG-enriched fractions by a two-step extraction procedure. Sep. Purif . Technol., 56, 53-56.
- Cui, L., Liu, Y.X., Liu, T., Yuan, Y.H., Yue, T.L., Cai, R., and Wang, Z.L. (2017). Extraction of Epigallocatechin Gallate and Epicatechin Gallate from Tea Leaves Using β-Cyclodextrin. J. Food Sci., 82, 394-400.
- Cui, Y., Oh, Y.J., Lim, J., Youn, M., Lee, I., Pak, H.K., Park, W., Jo, W., and Park, S. (2012). AFM study of the differential inhibitory effects of the green tea polyphenol (-)-epigallocatechin-3-gallate (EGCG) against Gram-positive and Gram-negative bacteria. Food Microbiol., 29, 80-87.
- Du, Q.B., Jiang, H.Y., Yin, J.F., Xu, Y.Q., Du, W.K., Li, B., and Du, Q.Z. (2013). Scaling up of high-speed countercurrent chromatographic apparatus with three columns connected in series for rapid preparation of (-)-epicatechin. J. Chromatogr. A, 1271, 62-66.
- Hou, X., Lu, X., Niu, P., Tang, S., Wang, L., and Guo, Y. (2018). β-Cyclodextrin-modified three-dimensional graphene oxide wrapped melamine foam for the solid-phase extraction of flavonoids. J. Sep. Sci., 41, 2207-2213.
- Jin, X., Liu, M.Y., Chen, Z.X., Mao, R.K., Xiao, Q.H., and Gao, H. (2015). Separation and purification of epigallocatechin-3-gallate (EGCG) from green tea using combined macroporous resin and polyamide column chromatography. J. Chromatogr. B, 1002, 113-122.
- Kapoor, M., Howard, R., Hall, I., and Appleton, I. (2004). Effects of Epicatechin Gallate on Wound Healing and Scar Formation in a Full Thickness Incisional Wound Healing Model in Rats. Am. J. Pathol., 165, 299-307.
- Kondo, K., Kurihara, M., Miyata, N., Suzuki, T., and Toyoda, M. (1999). Scavenging mechanisms of (-)-epigallocatechin gallate (EGCG) and (-)-epicatechin gallate (ECG) on peroxyl radicals and formation of superoxide during the inhibitory action. Free Radic. Biol. Med., 27, 855-863.
- Lai, S.M. and Gu, J.Y. (2014). Two-step chromatographic procedure for the preparative separation and purification of epigallocatechin gallate from green tea extracts. Food Bioprod. Process., 92, 314-320.
- Lai, S.M., Gu, J.Y., Huang, B.H., Chang, C.J., and Lee, W.L. (2012). Preparative separation and purification of epigallocatechin gallate from green tea extracts using a silica adsorbent containing β-cyclodextrin. J. Chromatogr. B, 887–888, 112-121.
- Lecumberri, E., Dupertuis, Y.M., Miralbell, R., and Pichard, C. (2013). Green tea polyphenol epigallocatechin-3-gallate (EGCG) as adjuvant in cancer therapy. Clin. Nutr., 32, 894-903.
- Li, Y.Y., Zhu, N., Chen, T., Wei, M.M., and Ma, Y.L. (2016). Stationary Phase Based on β-Cyclodextrin and Poly(N-isopropylacrylamide) for HILIC and RPLC. Chromatographia, 79, 29-36.
- Lim, Y.C., Lee, S.H., Song, M.H., Yamaguchi, K., Yoon, J.H., Choi, E.C., and Baek, S.J. (2006). Growth inhibition and apoptosis by (-)-epicatechin gallate are mediated by cyclin D1 suppression in head and neck squamous carcinoma cells. Eur. J. Cancer, 42, 3260-3266.
- Rekharsky, M.V. and Inoue, Y. (1998). Complexation Thermodynamics of Cyclodextrins. Chem. Rev., 98, 1875-1918.
- Riegsecker, S., Wiczynski, D., Kaplan, M.J., and Ahmed, S. (2013). Potential benefits of green tea polyphenol EGCG in the prevention and treatment of vascular inflammation in rheumatoid arthritis. Life. Sci., 93, 307-312.
- Simos, Y., Karkabounas, S., Verginadis, I., Charalampidis, P., and Filiou, D., Charalabopoulos, K., Zioris, I., Kalfakakou, V., Evangellou, A. (2011). Intra-peritoneal application of catechins and EGCG as in vivo inhibitors of ozone-induced oxidative stress. Phytomedicine, 18, 579-585.
- Vuong, Q.V., Golding, J.B., Nguyen, M., and Roach, P.D. (2010). Extraction and isolation of catechins from tea. J. Sep. Sci., 33, 3415-3428.
- Wang, S., Liang, Y., and Zheng, S. (2012). Separation of epigallocatechin gallate from tea polyphenol by simulated moving bed chromatography. J. Chromatogr. A, 1265, 46-51.
- Wang, W.T., Ma, C.Y., and Chen, S.W. (2014). Preparative purification of Epigallocatechin-3-gallate(EGCG) from tea polyphenols by adsorption column chromatigraphy. Chromatographia, 77, 1643-1652.
- Wong, C.P., Nguyen, L.P., Noh, S.K., Bray, T.M., Bruno, R.S., and Ho, E. (2010). Induction of regulatory T cells by green tea polyphenol EGCG. Immunology Letter., 139, 7-13.
- Wu, D., Wang, J., Pae, M., and Meydani, S.N. (2012). Green tea EGCG, T cells, and T cell-mediated autoimmune diseases. Mol. Aspects Med., 33, 107-118.
- Yang, C., Li, D., and Wan, X. (2008). Combination of HSCCC and Sephadex LH-20 methods: An approach to isolation and purification of the main individual theaflavins from black tea. J. Chromatogr. B, 861, 140-144.
- Yang, L., Li, C., Yuan, T., Tan, T., and Zhang, L. (2011). Preparation of highly pure daidzin on oligo-β-cyclodextrin-Sepharose HP and investigation of chromatographic behavior of isoflavones by molecular docking. J. Chromatogr. B, 879, 1773-1780.
- Ye, J.H., Li, N.N., Lu, J.L., Zheng, X.Q., and Liang, Y.R. (2014). Bulk preparation of (-)-epigallocatechin gallate-rich extract from green tea. Food Bioprod. Process., 92, 275-281.
- Yu, X., Ling, X., Zou, L., and Chen, Z. (2017). Novel polymeric monolith materials with a β-cyclodextrin -graphene composite for the highly selective extraction of methyl jasmonate. J. Sep. Sci., 40, 1556-1563.
- Zhang, H.S., Wu, T.C., Sang, W.W., and Ruan, Z. (2012). EGCG inhibits Tat-induced LTR transactivation: Role of Nrf2, AKT, AMPK signaling pathway. Life Sci., 90, 747-754.